Available online on 30.08.2019 at http://jddtonline.info
Journal of Drug Delivery and Therapeutics
Open Access to Pharmaceutical and Medical Research
© 2011-18, publisher and licensee JDDT, This is an Open Access article which permits unrestricted non-commercial use, provided the original work is properly cited
Open
Access
Research Article
Formulation and Evaluation of Floating Tablets of Sitagliptin with Extract of
Triphala
Revathi S*
1, Gopal V
2, Jeyabalan G
11 Sunrise University, Alwar, Rajasthan, India
2 College of Pharmacy, Mother Theresa Postgraduate and Research Institute of Health Sciences, Puducherry, India
ABSTRACT
The aim of the present work is to formulate, optimize and evaluate hydrodynamically balanced antidiabetic system incorporated with sitagliptin and phytochemical constituents of Triphala extract for the treatment of constipation associated with diabetes. The Triphala churna of two different ratios, 1:1:1 (TC1) and 1:2:4 (TC2) were subjected to hot percolation using Soxhlet apparatus using methanol as solvent. The floating matrix tablets of Sitagliptin with methanolic Triphala extract was prepared by wet granulation technique using HPMC K4M as polymer, starch/honey as binder and sodium bicarbonate & citric acid as effervescent agents by 24 factorial design. The compatibility studies showed
that there is no chemical interaction between the drug, polymer and the excipients used in the tablets. The independent variables are drug & Triphala extract ratio (X1), Triphala proportion (X2), binder used for granulation (X3), and amount of effervescent excipients used (X 4). The dependent variables are hardness (Y1), buoyancy lag time (Y2), total floating time (Y3), in-vitro drug release (Y4), and T50% (Y5). The prepared floating tablets were subjected to all post compression parameters such as hardness, friability, swelling capacity, buoyancy, total floating time, drug content & in-vitro drug release and were found to be within normal limits. Based on drug content, buoyancy lag time and in-vitro drug release the formulations F14 and F16 were selected for in-vivo study of the formulation.
Keywords: Triphala, Sitagliptin, honey, floating tablet.
Article Info:Received 08 July 2019; Review Completed 12 August 2019; Accepted 17 August 2019; Available online 30 Aug 2019
Cite this article as:
Revathi S, Gopal V, Jeyabalan G, Formulation and Evaluation of Floating Tablets of Sitagliptin with Extract of Triphala,
Journal of Drug Delivery and Therapeutics. 2019; 9(4-A):38-47 http://dx.doi.org/10.22270/jddt.v9i4-A.3278
*Address for Correspondence:
Revathi S, Sunrise University, Alwar, Rajasthan, India
INTRODUCTION
Floating systems or hydrodynamically controlled systems are low-density systems that have sufficient buoyancy to float over the gastric contents and remain buoyant in the stomach without affecting the gastric emptying rate for a prolonged period of time. While the system is floating on the gastric contents, the drug is released slowly at the desired rate from the system. Floating drug delivery systems have emerged as an efficient means of enhancing the bioavailability and controlled delivery of many drugs. The increasing sophistication of delivery technology will ensure the development of increase number of gastroretentive drug delivery to optimize the delivery of molecules. [1]
Sitagliptin is a dipeptidyl-peptidase inhibitor that has been approved for the therapy of type 2 diabetes. Sitagliptin is effective in lowering HbA1c, and fasting as well as
pancreatitis but was associated with constipation as adverse effect in patients. [3]
Triphala is a traditional ayurvedic herbal formulation composed of three medicinal plants, Terminalia chebula, Terminalia bellirica, and Emblica officinalis which means the combination of three fruits. Triphala is the most popular ayurvedic herbal formula of India, because it combines the properties of both a purgative and lubricating bulk laxative. [4] Functional constipation can be managed by using a non-habit-forming herbal laxative formulation that included Triphala as one of the ingredient and was found to be effective and safe. [5]
Chemicals
Sitagliptin was obtained as a gift sample from Richer Pharmaceuticals, Hyderabad, HPMC K4M was obtained from Yarrow Chem Products, Mumbai, sodium bicarbonate & citric acid were obtained from Loba Chemie Pvt. Ltd. Mumbai, starch, magnesium stearate, talc were obtained from SD Fine Chemicals and honey was obtained from Khadi, Salem. All the other chemicals used were of analytical grade.
Collection and identification of Triphala fruits
The fruit specimens of Terminalia chebula, Terminalia bellirica and Emblica officinalis were collected in and around Rajahmundry, Andhra Pradesh. The fruit specimens were identified and authenticated by Dr. J. Suneetha M.Sc., M.Phil., PhD, Professor and Head, Department of Botany, Government Art College, Rajahmundry, Andhra Pradesh. Specimen No: GAC/RJ/BO/2019/03/34. A voucher specimen was stored in our laboratory.
Preparation of Triphala churna
The dried fruits of Triphala is pulverised into fine powder using a stainless steel electrical mixer and passed through # 100 mesh sieves. Then, the powders of Terminalia bellirica, Emblica officinalis, and Terminalia chebula are mixed in ratio of 1:1:1 (TC1) and 1:2:4 (TC2) and stored in an airtight container for extraction.
Preparation of aqueous and methanolic extracts of Triphala 6, 7
An accurately weighed powder of formulations TC1 & TC2 were subjected to hot percolation in a Soxhlet extractor with 75% of methanol at 80°C to get methanolic extract. The Triphala powders (TC1 &TC2) were added in boiling solvent in a percolator for 2 h and then the process of hot continous percolation was continued. The resultant extract was concentrated using rotary vacuum evaporator. This concentrated extract is evaporated to dryness over a water bath and stored in a desiccator.
PREFORMULATION STUDIES
Solubility8, 9
100 mg of Sitagliptin is dissolved in 1 ml of different types of solvents such as water, simulated gastric fluid of pH 1.2, pH
6.8 buffer & pH 7.2 buffer. Every 10 mg of drug is added periodically to check the complete solubility of drug in 1 ml of various solvents.
Compatibility Studies10
Fourier Transform Infrared Spectrometry (FTIR):
Compatibility study of drug with the excipient was determined by I.R. Spectroscopy (FT-IR) using Perkin Elmer spectrum RX1 FT-IR spectrometer model. The pellets were prepared at high compaction pressure by using KBr and the ratio of sample to KBr is 1:100. The pellets thus prepared were examined and the spectra of drug with other ingredients in the formulations were compared with that of the original spectra.
Preparation of Simulated Gastric Fluid (Without Enzyme)11
Required amount of sodium chloride was dissolved in concentrated hydrochloric acid and is diluted to 1000 ml with distilled water to obtain a solution of pH 1.2.
Formulation of Floating Tablets
Hydrodynamically balanced floating matrix tablets were formulated with Sitagliptin and methanolic Triphala extract by wet granulation method using 24 full factorial design. The
active ingredient was mixed with Triphala extract, HPMC K4M, sodium bicarbonate, citric acid, and magnesium stearate using 10% w/v starch paste or 10% v/v honey as binder to make a good wet mass of granules. Talc is used as a glidant with granules for free flowing of granules into punches. The proportion of Triphala extract used is 1:1:1 (TC1) and 1:2:4 (TC2) of Terminalia bellirica, Emblica officinalis, and Terminalia chebula. After mixing well, the granules were passed through #60mesh sieve and dried in hot air oven at 40°C for 45 minutes for complete drying. Finally, the mixture was weighed and compressed on an
8 mm flat face punch machine.
Statistical Optimization Technique12, 13
The optimization was designed statistically using 24 full
factorial design. A 2-level full-factorial design consists of 16 full-factorial design points as in Table 1.
Table 1:Layout of 24 full factorial design13
F. Code F1 F2 F3 F4 F5 F6 F7 F8 F9 F10 F11 F12 F13 F14 F15 F16
X1 -1 -1 -1 -1 -1 -1 -1 -1 +1 +1 +1 +1 +1 +1 +1 +1
X2 -1 -1 -1 -1 +1 +1 +1 +1 -1 -1 -1 -1 +1 +1 +1 +1
X3 -1 -1 +1 +1 -1 -1 +1 +1 -1 -1 +1 +1 -1 -1 +1 +1
X4 -1 +1 -1 +1 -1 +1 -1 +1 -1 +1 -1 +1 -1 +1 -1 +1
This design generally involves independent variables X1, X2, X3, & X4. The dependent formulation variables selected are Y1, Y2, Y3, Y4, and Y5. The levels of independent variables and the dependent formulation variables are shown in table 2 & table 3 respectively. The results obtained from the
STATISTICAL OPTIMIZATION
Table 2: Independent Variables
Code Variables Low level (-1) High Level (+1)
X1 Sitagliptin: Triphala extract ratio 50 mg: 300 mg 50 mg: 600 mg
X2 Triphala proportion 1:1:1 (TC1) 1:2:4 (TC2)
X3 Binder proportion 10% w/v starch paste 10% v/v honey
X4 Sodium bicarbonate: Citric acid 100 mg: 30 mg 150 mg: 45 mg
Table 3: Dependent Variables
Code Dependent Variables
Y1 Hardness
Y2 Buoyancy lag time
Y3 Total floating time
Y4 In-vitro drug release at 12 hrs
Y5 T 50%
Physicochemical evaluation of floating tablet14
Pre-Compression Parameters:
Angle of repose
In order to determine the flow property, the angle of repose was determined. It is the maximum angle that can be obtained between the free standing surface of the powder heap and the horizontal plane.
= tan -1 (h/r)
Where, h = height, r = radius, = Angle of repose
Bulk density and tapped density
A quantity of 5 gm of the powder (W) from each formula was introduced into a 25 ml measuring cylinder. After the initial volume (Vo) was observed, the cylinder was allowed to fall under its own weight onto a hard surface from the height of 2.5 cm at 2 sec intervals. The tapping was continued until no further change in volume was noted. The bulk density, and tapped density were calculated using the following formulas
Bulk density = W / Vo and Tapped density = W / Vf
Where, W= weight of the powder,
Vo = initial volume, Vf = final tapped volume
Compressibility index Carr’s indices
Compressibility index is an important measure that can be obtained from the bulk and tapped densities. In theory, the less compressible a material the more flow able it is. A material having values of less than 20 to 30% is defined as the free flowing material. The limits are mentioned in the table below.
CI = 100(VO– Vf)/V
(ausner’s Ratio
= (W / Vf) / (W / Vo)
where,
W / Vf = Tapped density and W / Vo= Bulk density.
Post-Compression Parameters14:
Tablet Dimensions
Thickness and diameter were measured using a calibrated dial caliper. Three tablets of each formulation were taken randomly and thickness & diameter were measured individually.
Hardness
The hardness of the tablets was determined using Monsanto Hardness Tester. Three tablets were randomly picked in each formulation and hardness of the tablets was determined.
Friability
The friability of tablets was determined using Roche friabilator. Ten tablets were initially weighed (wo initial) and
transferred into friabilator. The friabilator was operated to run at 25 rpm for 4 minutes or run up to 100 revolutions. The tablets were weighed again (w -final). The percentage friability was then calculated by
Percentage of friability =
Weight Variation
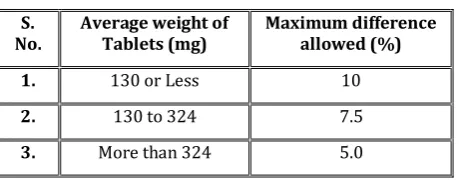
Twenty tablets were selected at random and the average weight was determined. Not more than two of the individual weights deviate from the average weight by more than the percentage deviation shown in table below.
Table 4: Weight Variation Tolerances for Uncoated Tablets
S. No.
Average weight of Tablets (mg)
Maximum difference allowed (%)
1. 130 or Less 10
2. 130 to 324 7.5
3. More than 324 5.0
% Maximum positive deviation = (WH–A/ A) x 100
% Minimum negative deviation = (A-WL/ A) x 100
Where, WH = Highest weight in mg,
Tablet Density
Tablet density is an important parameter for floating tablets. The tablet will float when its density is less than that of gastric fluid (1.004g/cc). The density decreases due to the expansion and upward force of CO2 gas generation. The
density was determined using following formula.
v = r2h & d = m/v
Where, v = volume of tablet (cc), r = radius of tablet (cm),
h = crown thickness of tablet (mm), m = mass of tablet
Buoyancy / Total Floating Time15
The time between introduction of dosage form and its buoyancy on the simulated gastric fluid and the time during which the dosage form remain buoyant were measured. The tablets were placed in a 100 ml beaker containing simulated gastric fluid. The time required for the tablet to rise to the surface and float was determined as floating lag time. The duration of time the dosage form constantly remained on the surface of the medium was determined as the total floating time.
Swelling Study16
The individual tablets were weighed accurately and kept in 50 ml of water. Tablets were taken out carefully after 60 min blotted with filter paper to remove the water present on the surface and weighed accurately. Percentage swelling was calculated by using the following formula.
Test for Content Uniformity
The absorbance of both the standard preparation and the sample preparation after suitable dilutions were measured in a UV-visible spectrophotometer at 267 nm using 0.1 N HCl as blank. The same procedure was repeated for three times.
In-vitro Drug Release Study10
In-vitro release studies were carried out using USP type II, paddle dissolution test apparatus. 900ml of simulated gastric fluid was taken in dissolution vessel and the temperature of the medium was maintained at 37°C 0.5°C. The speed of rotation of paddle was 50 rpm. 1 ml of sample was withdrawn at predetermined time intervals and same volume of fresh medium was replaced. The samples were analyzed for drug content against simulated gastric fluid as a blank at max 267 nm using UV Spectrophotometer.
RESULTS AND DISCUSSION
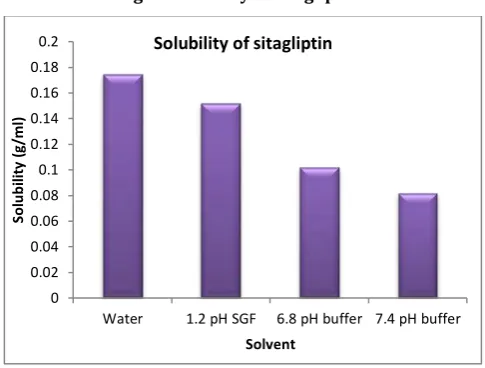
The solubility studies of Sitagliptin showed that the highest amount of solubility is in distilled water, then in simulated gastric fluid at pH 1.2. The alkaline solutions show less solubility of Sitagliptin than in simulated gastric fluid at pH 1.2.
The FT-IR Spectrum of pure Sitagliptin was compared with the FT-IR spectrum of physical mixture of tablet (Figure 3). There was no appearance or disappearance of any characteristics peaks. This shows that there is no chemical interaction between the drug and the excipients used in the tablet. The presence of peaks at the expected range confirms that the materials taken for the study are genuine.
Fig 1: Solubility of Sitagliptin
Fig 2: Standard curve of Sitagliptin
Fig 3: FT-IR spectra of Sitagliptin + Excipients
The mixture of all formulations was evaluated for pre-compression parameters before pre-compression into tablets for
angle of repose, bulk density, tapped density, Hausner’s
ratio, compressibility index and was found to be within normal limits and the powder has cohesive properties.
0 0.02 0.04 0.06 0.08 0.1 0.12 0.14 0.16 0.18 0.2
Water 1.2 pH SGF 6.8 pH buffer 7.4 pH buffer
S
o
lu
b
il
it
y
(
g
/m
l)
Solvent
Solubility of sitagliptin
y = 0.026x + 0.003
R² = 0.999
0
0.2
0.4
0.6
0.8
1
0
10
20
30
40
A
b
s
(n
m
)
Conc (mcg/ml)
Fig 4: Buoyancy after 2 min Fig 5: Buoyancy after 2 hours
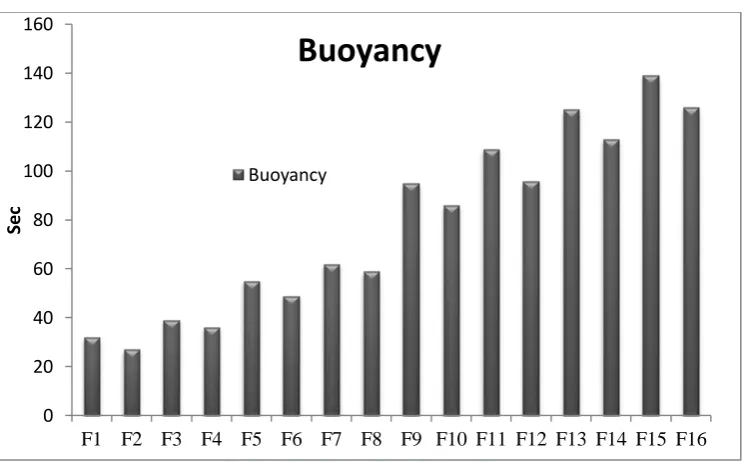
Fig 6: Buoyancy of formulations F1 – F16
The tablets of all formulation were subjected to various evaluation parameters such as average weight, thickness, diameter, hardness, friability, tablet density, in-vitro buoyancy lag time, total floating time, swelling index, drug content and in-vitro dissolution study. The results of all these tests were found to be satisfactory. The buoyancy and total floating time of the formulations were from 27 sec to 139 sec and 4.3 to 9.3 hr respectively. As the effervescence excipient concentration has increased the total floating time of the formulations have also increased. The buoyancy has increased because the total weight of the tablet had increased which made the effervescence excipients delay to diffuse out of the tablet.
All the formulations using 10% v/v honey as the binding agent showed extended time for drug release when compared to that of the 10% starch as the binder. This shows the more binding capacity of honey than the starch. All the formulations in which higher amount of
amount of solvent to diffuse through the formulation surface. The formulations using TC2 took more time to release the drug when compared to that of TC1 may be because of more binding capacity of phytochemical constituent to the binder. The formulations using higher amount of extract took extended time for complete drug release up to 11 hours. This is obviously because of increase in tablet weight and lesser diffusivity of solvent into the formulation. Overall, the highest amount of drug release was found as 98.85 % and 98.97% in 10 and 11 hours of the formulations F14 and F16 respectively.
All the formulations exhibited zero-order drug release showing the rate of drug release is independent of the concentration of the drug present in the formulation. Formulations F1 –F8 were best fit into Higuichi’s and formulations F9 – F16 were best fit into Korsmeyer-Peppa’s indicating that the diffusion is the dominant mechanism of drug release in these formulations. The mechanism of drug
0
20
40
60
80
100
120
140
160
F1
F2
F3
F4
F5
F6
F7
F8
F9 F10 F11 F12 F13 F14 F15 F16
S
e
c
Buoyancy
Table 5: Kinetic values of formulations F1-F16
F.code
Zero –order First -order Higuichi’s Korsemeyer-Peppa’s
R2 R2 R2 R2
F1 0.949 0.909 0.989 0.988
F2 0.898 0.846 0.988 0.975
F3 0.938 0.928 0.991 0.981
F4 0.927 0.853 0.996 0.992
F5 0.958 0.856 0.981 0.980
F6 0.954 0.857 0.987 0.987
F7 0.938 0.843 0.980 0.973
F8 0.931 0.764 0.981 0.974
F9 0.986 0.848 0.969 0.991
F10 0.985 0.812 0.973 0.994
F11 0.991 0.836 0.958 0.989
F12 0.989 0.773 0.964 0.992
F13 0.994 0.809 0.942 0.986
F14 0.993 0.742 0.943 0.983
F15 0.996 0.853 0.937 0.988
F16 0.997 0.771 0.942 0.995
Fig 7: In-vitro dissolution of F1-F8
Fig 8: In-vitro dissolution of F9 – F16
0
20
40
60
80
100
120
0
1
2
3
4
5
6
7
8
%
dr
ug
re
le
a
se
Time in hrs
In-vitro drug release of F1-F8
F1
F2
F3
F4
F5
F6
F7
F8
0
20
40
60
80
100
120
0
2
4
6
8
10
12
%
d
ru
g
r
e
le
as
e
Time in hrs
In-vitro
drug release of F9-F16
F9
F10
F11
F12
F13
F14
F15
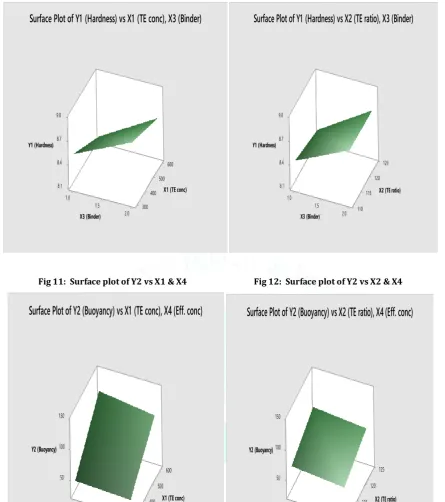
Fig 9: Surface plot of Y1 vs X1 & X3 Fig 10: Surface plot of Y1 vs X2 & X3
Fig 11: Surface plot of Y2 vs X1 & X4 Fig 12: Surface plot of Y2 vs X2 & X4
0 6 0 0 0 5 . 8 1 4 . 8 0 0 4 8.7 0 . 1 9.0 5 . 1 300 .0 2 ness) d r a H ( 1 Y T ( 1 X Ec onc)
3 (Binde)r X
urface Plot of Y1 (Hardness)
vs X1 (TE conc), X3 (B
i
S
nder)
125 0 2 1 1 . 8 4 . 8 5 1 1 .7 8 0 . 1 9.0 5 . 1 0 1 1 0 . 2 dness) r a H ( 1 Y E T ( 2 X r aito)3 nde)r X (Bi
urface Plot of Y1
S
(Hardness) vs X2 (TE ratio), X3 (Binder)
5 600 00 0 5 0 0 1 0 0 4 0 4 1 150 0 6 1 300 0 8 1 0 0 2 yancy) o u B ( 2 Y E T ( 1 X c on)c
)c n o c .f X4 (Ef
urface Plot of Y2 (Buoyan
S
c
y) vs X1 (TE conc), X4 (Eff. conc)
125 0 2 1 0 5 0 0 1 15 1 0 4 1 150 0 6 1 180 110 0 2 0 Y (Buo2 yanc)y
)o it ar E T ( 2 X )c n o c . 4 X (Eff
urface Plot of Y2
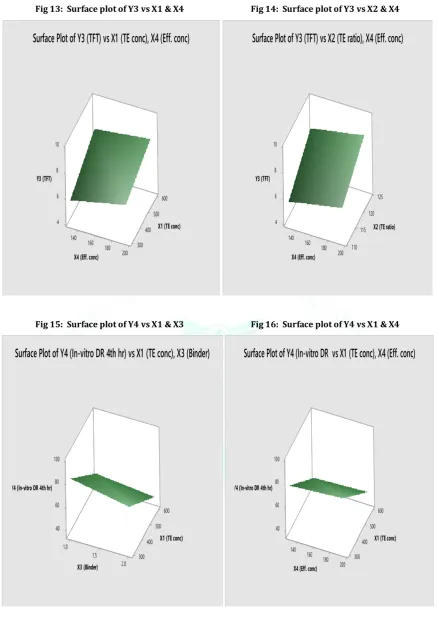
Fig 13: Surface plot of Y3 vs X1 & X4 Fig 14: Surface plot of Y3 vs X2 & X4
Fig 15: Surface plot of Y4 vs X1 & X3 Fig 16: Surface plot of Y4 vs X1 & X4
0 0 6
0 0 5 4
6
0 0 4 8
4 1 0 10
1 06 300
180 0 0 2 (TFT)
3 Y
E T ( X1 c on)c
4 .fc on)c X (Ef
urface Plot of Y3 (TFT) vs
1 (TE conc), X4 (Eff. c
o
S
X
nc)
125
0 12 4
6
5 1 1 8
0 4 1 10
1 06
180 110
0 0 2 Y3 ( F )TT
) oi ta r E T ( 2 X
)c n o c .f fE 4 X (
urface Plot of Y3 (TFT) vs X2 (TE ratio), X
S
4
(Eff. conc)
6 00
0 0 5 0
4 0 6
0 0 4 0
8
0 . 1 100
5 .
1 300
0 . 2 Y (In-vitro4 DR4 thh )r
)c n o c E T ( 1 X
3 X (Binder)
urface Plot of Y4 (In-vitro DR
S
hr) vs X1 (TE conc), X3 (Binder)
4t
h
0 6 0
0 0 5 0
4 60
0 0 4 80
0 4 1 100
6
1 0 300
0 8 1
0 0 2 Y4 (In-vitr oDR4 th h )r
1 (T ) X E conc
f X E( 4 f conc).
urface Plot of Y4 (In-vitro DR
vs X1 (TE
c
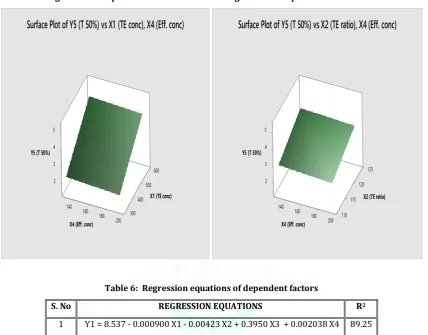
Fig 17: Surface plot of Y5 vs X1 & X4 Fig 18: Surface plot of Y5 vs X2 & X4
Table 6: Regression equations of dependent factors
S. No REGRESSION EQUATIONS R2
1 Y1 = 8.537 - 0.000900 X1 - 0.00423 X2 + 0.3950 X3 + 0.002038 X4 89.25
2 Y2 = -252.1 + 0.22083 X1 + 2.000 X2 + 10.50 X3 - 0.1231 X4 99.39
3 Y3 = -17.90 + 0.005625 X1 + 0.1740 X2 + 0.112 X3 + 0.01135 X4 95.53
4 Y4 = 287.1 - 0.11052 X1 - 1.447 X2 - 7.43 X3 + 0.0408 X4 96.89
5 Y5 = -9.548 + 0.007612 X1 + 0.07817 X2 + 0.4463 X3 - 0.002327 X4 99.58
Results of ANOVA
From the results of ANOVA it was observed that the independent factors X1 (Drug: TE ratio) and X3 (binder) influences the dependent factor Y1 (hardness). Honey showed more binding capacity than starch. Increase in concentration of TE in formulation slightly influenced by little decrease in the hardness of the tablet in few formulations only.
Buoyancy (Y2) is influenced by drug: TE ratio (X1), Triphala ratio (1:2:4) and amount of effervescent (X4). Increase in concentration of Triphala extract has increased the time of buoyancy of the formulations. Increase in concentration of effervescent excipients decrease the buoyancy lag time of the formulations. TC2 extract has increase the time of buoyancy than TC1.
Total floating time (Y3) was influenced by X1, X2, & X4. Increase in concentration of Triphala extract (X1) increase the total floating time. The ratio of Triphala (X2) has slight effect on total floating time by increasing the TFT when TC2 is used. Effervescent excipients (X4) have high influence on total floating time by increasing it.
Percentage of drug release at 4th hour (Y4) was affected by
drug release very lightly, may be due to the diffusivity of CO2 out of formulations.
T50% of drug (Y5) was affected by Triphala extract concentration (X1). The increase in concentration of Triphala extract increased the T50%. This may be due to dispersion of drug in Triphala extract. Amount of effervescent (X4) has no effect on T50%. Triphala ratio (X2) has slight effect on T50%. It showed a slight increase in time of release for T50% when TC2 is used.
CONCLUSION
The FT-IR reports showed that the Triphala extract is compatible Sitagliptin and all other excipients used for formulation. The hydrodynamically balanced tablets were then prepared by wet granulation method and were optimized using 24 full factorial design. All the
pre-compression and post pre-compression parameters were evaluated and found to be within acceptable limits. All the formulations exhibited zero-order drug release and non-fickian or anomalous diffusion is dominant mechanism in drug release since it best fit in Korsmeyer-Peppa’s.
0 0 0 6
0 5 2
3
0 0 4 4
0 4 1 5
0 6
1 300
0 8 1
0 0 2
T 50%) ( 5 Y
E T ( 1 X c on)c
)c n o c .f X4 (Ef
urface Plot of Y5 (T 50%
S
) X1 (TE conc), X4 (Eff. conc)
vs
125
0 12 2
3
1 51
4
0 4 1 5
0 6 1
0 8
1 110
0 0 2
Y5 (T 50%)
) o it a r E T ( 2 X
)c n o c .f f 4 (E X
urf
REFERENCES
1. AV Mayavanshi, SS Gajjar. Floating drug delivery systems to increase gastric retention of drugs: A Review. Research J. Pharm. and Tech 2008; 1(4): 345 – 348.
2. Baptist Gallwitz. Review of sitagliptin phosphate: a novel treatment for type 2 diabetes. Vascular Health and Risk Management 2007; 3(2): 203 - 210.
3. Samuel S. Engel, Elizabeth Round, Gregory T. Golm, Keith D.Kaufman, Barry J. Goldstein. Safety and Tolerability of Sitagliptin in Type 2 Diabetes: Pooled Analysis of 25 Clinical Studies. Diabetes Ther 2013; 4: 119 - 145.
4. Munira Momin, K.Pundarikakshudu. Optimization and Pharmacotechnical Evaluation of Compression-Coated Colon-Specific Drug Delivery System of Triphala Using Factorial Design. Drug Development Research 2005; 65: 34 - 42. 5. Munshi R, Bhalerao S, Rathi P, Kuber VV, Nipanikar SU, Kadbhane
KP. An open-label, prospective clinical study to evaluate the efficacy and safety of TLPL/AY/01/2008 in the management of functional constipation. Journal of Ayurveda & Integrative Medicine 2011; 2(3): 144 - 152.
6. Sadaf Fatima, Romana Parveena, Tooba Naz Shamsia, Gurjeet Singh et al. Phytochemical analysis and In-vitro Biochemical Characterization of aqueous and methanolic extract of Triphala, a conventional herbal remedy. Biotechnology Reports 2018; 17: 126-36.
7. V Eugin Amala and M Jeyaraj. Comparative evaluation of phytocomponents present in the methanolic extract of
Terminalia chebula, Terminalia bellirica, and Phyllanthus emblica, fruit extracts using GC-MS analysis. International Journal of Pharma and Bio sciences 2014; 5(4): 927 - 934. 8.
https://www.scbt.com/scbt/product/Sitagliptin-phosphate-monohydrate-654671-77-9.
9. Januvia. Scientific discussion. European medicines Agency 2007 Doc. London. 1-39.
10. Robert M. Silverstein., Francis X. Webster., Infrared Spectrometry. In: Robert M. Silverstein. Editors. Spectrometric Identification of Organic Compounds. 6th Ed. John Wiley and Sons. Inc. New York. Pg. 71 – 143.
11. USP 31 / NF 26. 2008, Asian ed. Volume – 2, Official Monographs. Pg. 1820 – 1822.
12. Garetha K Lewis, Didier Mathieu, and Rogerphan-luu, Pharmaceutical experimental design, 1999; Pg. No: 88-93. 13. M. Cavazzuti, Optimization Methods: From Theory to Design
scientific and technological aspects in mechanics. 2013. XVIII. 13-42.
14. Banker G S., Anderson N R., and Tablets In: Lachman L.Lieberman HA, Kanig JL, And Editor. The Theory and Practice of Industrial Pharmacy.3rd Edition 1986, 293-335.
15. Amit Kumar Nayak, Ruma Maji. Gastroretentive drug delivery systems: A Review. Asian Journal of Pharmaceutical and Clinical Research 2010; 3(1): 02 - 10.