Available online on 30.08.2019 at http://jddtonline.info
Journal of Drug Delivery and Therapeutics
Open Access to Pharmaceutical and Medical Research© 2011-18, publisher and licensee JDDT, This is an Open Access article which permits unrestricted non-commercial use, provided the original work is properly cited
Open Access
Research Article
Novel UV Spectrophotometer Methods for Quantitative Estimation of
Concensi (Amlodipine 10mg and Celecoxib 200mg) Using Hydrotropic
Solubilizing Agents
Durga Kushwaha*
, Sunil Diwakar
1,
R. K. Roy
1, Sarita Karole
1, Hemant Kushwaha
1, Prabhat Jain
21Oriental College of Pharmacy, Raisen Rd, Patel Nagar, Bhopal, (MP) 462022
2Scan Research Laboratories, Sector A H No. 109, J K Road, Indrapuri, Bhopal, MP 462023
ABSTRACT
Two simple, accurate, novel, safe and precise methods were developed for the simultaneous estimation of poorly water-soluble drugs Amlodipine besylate (AMD) and Celecoxib (CLX) in a in-house formulation using 2M sodium benzoate as a hydrotropic solution. AMD and CLX show maximum absorbances at 243 and 255 nm, respectively. Sodium benzoate did not show any absorbance above 225 nm and thus no interference in the estimation of drugs was seen. AMD and CLX follow Beer’s law in the concentration range of 2-10g/ml and 10-50g/ml (r2 =
0.9992 and 0.9995). Method-A employs the simultaneous equation method using 243 and 255 nm as two analytical wavelengths; method-B employs the absorption ratio method, which uses 243 and 250nm as two analytical wavelengths for estimation of AMD and CLX. The mean
percent label claims of in-house formulation were found to be98.74± 0.912and 99.22± 1.012in method-1, 97.89± 0.872and 99.49± 0.903 in
method 2 for AMD and CLX, respectively. The developed methods were validated according to ICH guidelines and values of accuracy, precision and other statistical analysis were found to be in good accordance with the prescribed values therefore both methods can be used for routine monitoring of AMD and CLX in industry in the assay of bulk drug and pharmaceutical formulation.
Keywords: Amlodipine besylate, Celecoxib, Simultaneous equation method; Absorption ratio method, Hydrotropic solubilizing agents
Article Info:Received 22 June 2019; Review Completed 17 Aug 2019; Accepted 23 Aug 2019; Available online 30 Aug 2019 Cite this article as:
Kushwaha D, Diwakar S,RoyRK, Karole S, Kushwaha H, Jain P, Novel UV Spectrophotometer Methods for Quantitative Estimation of Concensi (Amlodipine 10mg and Celecoxib 200mg) Using Hydrotropic Solubilizing Agents, Journal of Drug
Delivery and Therapeutics. 2019; 9(4-A):651-655 http://dx.doi.org/10.22270/jddt.v9i4-A.3546
*Address for Correspondence:
Durga Kushwaha, Oriental College of Pharmacy, Raisen Rd, Patel Nagar, Bhopal, (MP) 462022
INTRODUCTION
Amlodipine besylate (AMD) chemically
[3-ethyl5-methyl(4RS)-2-[(2-aminoethoxy) methyl]-4-
(2-
chlorophenyl)-methyl-1-dihydropyridine-3,5-dicarboxylatebenzenesulfonate (Figure 1a) is a
dihydropyridine long acting calcium-channel blocker that inhibits the transmembrane influx of calcium ions into vascular smooth muscles and cardiac muscles, which in turn affects their contractile process and results in reduced blood pressure. It is used in the treatment of hypertension and angina.
Amlodipine besylate have an absolute bioavailability of 64
to90% and half-life of about 30-50 hours1-4. Celecoxib (CLX)
is chemically designated as 4-[5-(4-
methylphenyl)-3-7(trifluoromethyl)-1H-pyrazol-1-yl] benzenesulfonamide
(Figure 1b) and is a diaryl substituted pyrazole 5, 6. The
mechanism of action of CLX is believed to be due to inhibition of prostaglandin synthesis, primarily via inhibition of Cyclooxygenase-2 (Cox-2). It is supplied only in
tablets and capsules for oral administration. CLX is practically insoluble in water which precludes its use in
parenteral and oral solutions dosage forms7. Formulation of
lipophilic drugs is frequently hampered by their poor aqueous solubility which again can limit their therapeutic applications.
NH
O
O
O
O
Cl
O
NH
2S O
O H2N
N N
F F
F
(a) (b)
AMD is official in IP8, BP9. Several analytical methods that
have been reported for the estimation of amlodipine besylate in biological fluids and/or pharmaceutical
formulations include spectrophotometric10-14, HPLC15-17and
HPTLC18. A survey of literature showed HPLC methods for
the estimation of CLX in pharmaceutical preparations19-23
and in biological fluids24-26. It was also estimated by
HPTLC27, spectroflurometric28 and densitometric29,
spectrophotometric30,31 methods. Hydrotropic solubilization
is the phenomenon by which aqueous solubility of poorly water soluble drugs and insoluble drugs increases. Various techniques have been employed to enhance the aqueous solubility and hydrotropy is one of them. Sodium salicylate, sodium benzoate, urea, nicotinamide, sodium citrate and sodium acetate are the most common examples of hydrotropic agents utilized to increase the water solubility
of the drug. Maheshwari32,33 and Jain et al34-43 have analyzed
various poorly water-soluble drugs using hydrotropic solubilization phenomenon for single drug or in combination
viz. Frusemide, ketoprofen, amlodipine besylate,
pramipexole dihyrochloride, olmesartan maedoxamil, lomefloxacin, furazolidone, entacapone, metronidazole & Ofloxacin, Ornidazole, Tinidazole, Metronidazole & Furazolidone. Various organic solvents such as methanol, chloroform, dimethyl formamide and acetonitrile have been employed for solubilization of poorly water-soluble drugs to carry out spectrophotometric analysis. Drawbacks of organic solvents include their higher cost, toxicity and pollution. Hydrotropic solution may be a proper choice to preclude the use of organic solvents. UV/VIS spectroscopy is an instrumental technique of choice for the mentioned purpose in industrial laboratories due to its simplicity and ease of operation. Kitov Pharma announced that the Food and Drug Administration (FDA) has approved Consensi (amlodipine
and celecoxib) for patients with osteoarthritis
pain and hypertension. He trial used celecoxib capsules and amlodipine tablets that were individually over-encapsulated and then taken together or with matching placebos. Patients were randomized to 1 of 4 treatment arms: celecoxib 200mg + amlodipine 10mg, amlodipine 10mg, celecoxib 200mg or placebo; all treatments were given once a day for 14 days. Results showed that the combination of celecoxib and amlodipine provided similar blood pressure reduction to an equal dose of amlodipine. We suppose that Consensi, as a single pill combination treatment for osteoarthritis and hypertension, presents a unique value proposition of
potentially increasing treatment adherence44. Therefore, it
was thought worthwhile to employ hydrotropic solution to extract out the drug from fine powder of marketed formulation to carry out spectrophotometric estimation. There are no reports yet for the determination of this combination by proposed methods. The present work emphasizes on the quantitative estimation of AMD and CLX in their combined dosage form by UV Spectroscopic methods.
MATERIALS AND METHODS
Pure sample of AMD and CLX was obtained as a gift sample from Matrix Laboratories, Mumbai and Reddy’s Labs, Hyderabad, India respectively. Sodium benzoate was obtained from Merck Chemical Division, Mumbai. All other chemicals used were of analytical grade. Reverse osmosis water was used throughout the study. In House synthetic mixture of AMD and CLX were prepared in the ratio of (10:200mg). Label claim of AMD and CLX in tablet is 10 and
200mg respectively. A Labindia 3000+ UV/VIS
spectrophotometer with 1 cm matched quartz cells was used for the estimation.
Preliminary solubility studies of drugs
Solubility of both drugs was determined at 25±1°C. An excess amount of drug was added to two screw capped 25 ml of volumetric flasks containing different aqueous systems viz. distilled water and different combination of hydrotropic agent. The volumetric flasks were shaken mechanically for 12 h at 25±1°C in a mechanical shaker. These solutions were allowed to equilibrate for next 24 hr and then centrifuged for 5 min at 2000 rpm. The supernatant liquid was taken for appropriate dilution after filtering through Whatman filter paper #41 and analyzed spectrophotometrically against water as blank. After analysis, it was found that the enhancement in the solubility of AMD and CLX was found to be more than 32 and 26 folds, respectively in a 2M sodium benzoate as compared to solubility studies in other solvents Selection of hydrotropic agent
AMD and CLX were scanned in hydrotropic agent in the spectrum mode over the UV range 200-400 and 2M sodium benzoate solution was found to be most appropriate because:
AMD and CLX are soluble in it (32 and 26 fold enhancement of solubility).
AMD and CLX are stable in hydrotropic agent.
AMD and CLX, both exhibit good spectral characteristics in it.
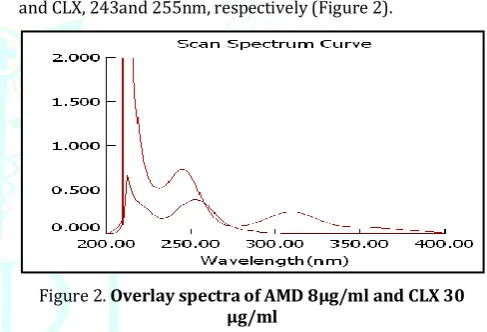
Sodium benzoate has no interference with the λmax of AMD
and CLX, 243and 255nm, respectively (Figure 2).
Figure 2. Overlay spectra of AMD 8μg/ml and CLX 30
μg/ml Establishment of stability profile
Stability of AMD and CLX was observed by dissolving in a 2M sodium benzoate solution used as hydrotropic agent. Solution of AMD and CLX was scanned under time scan for 30 min. Spectra of the drug under time scan shows that drug is stable in hydrotropic solution.
Linearity range and calibration graph
Preparation of standard stock solutions of AMD and CLX Standard stock solutions of 1000 μg/ml were prepared by dissolving separately 100 mg of each drug in hydrotropic solution and the flask was sonicated for about 10 min to solubilized the drug (Stock-A).
Preparation of working standard solution for calibration
curve
Table 1 Optical characteristics and linearity data of AMD and CLX
S. N. Parameters AMD CLX
1 Working λ 243 255
2 Beer’s law limit (μg/ml) 2-10 10-50
3 Correlation coefficient (r2)* 0.9992 0.9995
4 Slope (m)* 0.075 0.010
5 Intercept (c)* 0.002 0.002
6 LOD (μg/ml) 0.298 0.343
7 LOQ (μg/ml) 0.081 0.734
* Average of five determinations
Study of overlay spectra of drugs and selection of method The spectra exhibit major absorbance maxima at 243 nm and 255 nm for AMD and CLX, respectively and isosbestic point at 250 nm Figure 2. Due to difference in absorbance maxima and having no interference with each other both drugs can be simultaneously estimated by the simultaneous equation method (Method A) and the Q-analysis method (Method B).
Vierordt’s simultaneous equation method (Method 1)
The wavelength 243 nm (λmax of AMD) and 255 nm (λmax of
CLX) was selected. The absorbencies of AMD and CLX were measured at 243 nm and 255 nm. This method of analysis is based on the absorption of drugs X and Y at the wavelength maxima of the other. The quantification analysis of AMDand CLX in a binary mixture was performed by using Eqs (1) and
(2). Where CX and CY are the concentrations of AMD and CLX,
respectively in the diluted sample, ax1 and ax2 are
absorptivities of AMD at λ1 and λ2, ay1 and ay2 are
absorptivities of CLX at λ1 and λ2, respectively (Table 2). A1
and A2 are the absorbances of samples at the 243 and 255
nm, respectively45.
CX =A2ay1- A1ay2/ax2ay1-ax1ay2 (1)
CY= A1ax2 -A2ax1/ax2ay1 -ax1ay2 (2)
Q-analysis method (Method 2)
In this method absorbances of both the drugs were
calculated at two selected wavelengths; among which λ1 is
the wavelength of isoabsorptive point of both drugs and λ2 is
the λmax of either drug among both drugs. From the overlain spectra wavelength 250 nm (isoabsorption point) and 243 (λmax of AMD) were selected for the study. The absorbencies at 250 nm and 243 nm for CLX were obtained and similarly for AMD absorbencies are measured at 250 nm and 243 nm. The concentrations of the individual components were calculated by using the following equations;
CX = Qm- Qy/Qx -Qy×A1/ax1 (3)
CY= Qm- Qy/Qy -Qx× A1/ax1 (4)
Where Qm= A2/A1, A1 is absorbance of sample at
isoabsorptive point, A2 is absorbance of sample at λmax of
one of the two components. ax1 and ax2 represent
absorptivities of AMD at λ1 and λ2 and ay1 and ay2 denote
absorptivities of CLX at λ1 and λ2, respectively (Table 2); CX
and CY are the concentrations of AMD and CLX,
respectively45, 46.
Table 2 Absorptivities of AMD (x) and CLX (y) at λ1 and λ2
Drug Method-1 Method-2
243nm (λ1) 255nm (λ2) 250 nm (λ1) 243nm (λ2)
AMD ax1 0.0248 ax2 0.0053 ax1 0.0179 ax2 0.0064
CLX ay1 0.0229 ay2 0.0514 ay1 0.0434 ay2 0.0514
QX 0.2900 QY 1.4015
N=5 Analysis of in-house formulation
Twenty in-house tablets of AMD and CLX were weighed and ground to a fine powder; amount equal to 10 mg of AMD was taken in a 100 ml volumetric flask. The CLX present in this amount of tablet powder was 200 mg. Then 80 ml of sodium benzoate solution was added and the flask was sonicated for about 10 min to solubilize the drug present in tablet powder and the volume was made up to the mark with hydrotropic
solution. After sonication filtration was done through Whatman filter paper No. 41. Filtrate was collected and further diluted with RO water to get the final concentrations of both drugs in the working range. The absorbances of final dilutions were observed at selected wavelengths and the concentrations were obtained from the simultaneous equation method and the absorbance ratio method. The result of statistical evaluation of tablet analysis is reported in Table 3.
Table 3 Results and statistical parameters for tablet analysis: In-house (AMD10/CLX-200)
S. No. Drug Label claim Amount found Recovery%* S.D.* %COV* %COV*
Method-1 AMD 10 9.874 98.74 0.912 0.923 0.168
CLX 200 198.43 99.22 1.012 1.019 0.187
Method-2 AMD 10 9.789 97.89 0.872 0.890 0.169
CLX 200 198.98 99.49 0.903 0.453 0.161
* Average of five determinations Validation of method
The developed methods for simultaneous estimation of AMD and CLX were validated as per ICH guidelines (Linearity,
Accuracy, Precision and Robustness) 47.
Linearity
Linearity of AMD and CLX was established by response ratios of drugs. Response ratio of both drugs was calculated
by dividing the absorbance with respective concentration and then a graph was plotted between concentration and response ratio.
quantification (LOQ) for AMD and CLX were found to be 0.298μg/ml, 0.081μg/ml and 0.343μg/ml, 0.734μg/ml, respectively (Table 1) indicating that the proposed UV method is highly sensitive.
Accuracy
The accuracy of the proposed methods was assessed by recovery studies at three different levels i.e., 80%, 100% and
120%. The recovery studies were carried out by adding a known amount of standard solution of AMD and CLX to preanalyzed tablet solutions. The resulting solutions were then re-analyzed by proposed methods. Total amount of drug found and percentage recovery were calculated. Results of recovery studies are reported in Table 4.
Table 4 Results of recovery studies on marketed formulations
Recovery level% % Recovery (Mean ± SD)*
Method-1 Method-2
AMD CLX AMD CLX
80 99.05±0.284 95.20±0.101 99.42±0.475 98.39±1.023
100 99.06±0.400 96.62±0.093 98.44±0.672 99.64±0.172
120 99.83±0.308 95.08±0.086 97.74±0.451 98.54±0.673
Mean 99.31±0.331 95.64±0.094 98.54±0.532 98.86±0.622
* Average of five determination Precision
Precision of the methods was studied at three levels as repeatability, intermediate precision (Day to Day and analyst to analyst) and reproducibility (Table 5 & 6).
Table 5 Results of validation (Mean ± SD)
Parameter Method-1
Precision (Mean ± SD)* AMD % RSD CLX % RSD
Repeatability 99.21±0.033 0.571 99.72±0.043 0.189
Day to day 98.71±0.050 1.071 99.54±0.038 0.171
Analyst to analyst 99.12±0.033 0.656 99.46±0.150 0.475
Reproducibility 98.94±0.071 0.984 99.67±0.039 0.196
* Average of five determinations
Table 6 Results of validation (Mean ± SD)
Parameter Method-2
Precision (Mean ± SD)* AMD % RSD CLX % RSD
Repeatability 98.74 ± 0.61 0.618 98.84 ± 1.04 1.052
Day to day 98.84 ± 1.04 1.052 99.51 ± 0.81 0.814
Analyst to analyst 99.55 ± 0.93 0.934 98.55 ± 0.28 0.284
Reproducibility 98.43 ± 0.88 0.894 98.78 ± 0.27 0.273
* Average of five determinations
RESULTS AND DISCUSSIONS
Based on the solubility and stability and spectral characteristics of the drugs, 2M sodium benzoate was used as a hydrotropic solution. It was found that solubility enhancement of AMD and CLX was more than 32 and 26-fold, respectively in hydrotropic solution as compared with distilled water. AMD and CLX show maximum absorbances at 243 and 255 nm, respectively. Sodium benzoate solution did not show any absorbance above 225nm and thus no interference in the estimation of drugs was seen. AMD and CLX follow Beer’s law in the concentration range of
2-10μg/ml and 10-50μg/ml (r2=0.9992 and 0.9995). Method-1
employs the simultaneous equation method using 243 and 255nm as two analytical wavelengths; method-2 employs the absorption ratio method, which uses 255 and 243nm as two analytical wavelengths for estimation of AMD and CLX. The optimized methods showed good reproducibility and mean recovery with 99.31±0.331and 95.64±0.094in method-1 and 98.54±0.532and 98.86±0.622in method-2 for AMD and CLX respectively. The mean percent label claims of in-house tablet dosage were found to be 98.74± 0.912and 99.22± 1.012in method-1, 97.89± 0.872and 99.49± 0.903 in method-2 for AMD and CLX, respectively. The standard deviation, coefficient of variance and standard error were obtained for AMD and CLX were satisfactorily low. Result of
precision at different levels was found to be within acceptable limits (RSD < 2).
CONCLUSION
There was no interference of 2M sodium benzoate solution in the estimation and hence the two UV spectrophotometric methods were found to be simple, accurate, economic and rapid for simultaneous estimation of AMD and CLX in bulk and in-house tablet dosage forms. The proposed method can be successfully employed for the routine analysis of AMD and CLX containing dosage forms.
REFERENCES
1. Budavari S. The Merck index: An encyclopedia of chemicals, drugs and biologicals, Merck Research Laboratories, Division of Whitehouse Station, NJ: Merck and Co. Inc, 2001; pp 86.
2. Hardman JG, Limbird LE, Gilman AG. Goodman and Gilman's The
Pharmacological Basis of Therapeutics, McGraw Hill, New York, 2001; pp 871.
3. Sweetman SC. Martindale: The Complete Drug Reference, Royal
Pharmaceutical Society of Great Britain, London, 2005; pp 862. 4. Jain DK, Jain N, Sharma HK, Jain R, Jain SK. Development and
5. Leahy KM, Ornberg RL, Wang Y, Zweifel BS, Koki AT, Jaime L. Masferrer, cyclooxygenase2 inhibition by celecoxib reduces proliferation and induces poptosis in angiogenic endothelial cells in vivo. Cancer Res 2002; 62:625-631.
6. Clemett D, Goa KL. Celecoxib: a review of its use in
osteoarthritis, rheumatoid arthritis and acute pain. Drugs 2000; 59(4):957-80.
7. Mengle-Gaw L, Hubbard RC, Karim A. A study of the platelets effects of SC-58635, a novel selective cox-2 inhibitor. Arthiritis
Rheum 1997; 40 Suppl: S93.
8. The Indian Pharmacopoeia, The Controller of Publications, New
Delhi, 1996; 72.
9. British Pharmacopoeia, CD‐ROM, British Pharmacopoeia, HMSO,
London, 2001; 72.
10. Gohil K, Trivedi P, Molvi KI. Spectrophotometric method for amlodipine besylate in bulk and in tablet dosage forms. Indian J
Pharm Sci 2005; 67:376.
11. Khopade SA, Jain NK. Difference spectrophptometric estimation
of amlodipine besylate. Indian Drugs 2000; 37(7):351‐353.
12. Kasture AV, Ramteke M. Simultaneous UV‐spectrophotometric
method for the estimation of atenolol and amlodipine besylate in combined dosage form. Indian J Pharm Sci 2006; 68:394‐6.
13. Topale PR, Gaikwad NJ, Tajane MR. Simultaneous UV‐
spectrophotometric estimation of losarten potassium and amlodipine in tablet. Indian Drugs 2003; 40(2):119‐121.
14. Jain HK, Agrawal RK. Spectrophotometric methods for
simultaneous estimation of amlodipine besylate and lisinopril in tablets. Indian Drugs 2000; 37(4):196‐199.
15. Rao JR, Kadam SS, Mahadik KR. RP‐HPLC determination of
amlodipine and benzepril hydrochloride in tablets. Indian Drugs
2002; 39 (7):378‐381.
16. Rajeswari K, Sankar GG, Rao AL, Seshagirirao JVLN. RP‐HPLC method for the simultaneous determination of atorvastatin and amlodipine in tablet dosage form. Indian J Pharm Sci 2006; 68 (2): 275‐277.
17. Jain N, Jain R, Banweer J, Jain DK. Development and validation of a rapid rp-hplc method for the determination of amlodipine besylate and olmesartan medoxomil in their combined tablet formulation.Int J Curr Pharm Res 2010;2(2): 40-43.
18. Argekar AP, Powar SG. Simultaneous determination of atenolol
and amlodipine in tablets by high‐performance thin‐layer
chromatography. J Pharm Biomed Ana 2000; 21(6):1137-1142.
19. Baboota S, Faiyaz S, Ahuja A, Ali J, Shafiq S, Ahmad S Development and validation of a stability- indicationg hplc method for analysis of celecoxib in bulk drug and
microemulsion formulation. Acta Chromatogr 2007;
18:116-129.
20. Roa RN, Meena S, Nagaraju D, Ral AR, Ravikanth S. Liquid-Chromatographic separation and determination of process-related impurities, including a regio-specific isomer of celecoxib on reversed-phase c18 column dynamically coated with hexamethyldisilazane. Anal Sci 2006; 22 (9): 1257-60.
21. Starek M. Review of the applications of different analytical techniques for coxibs research. Talanta 2011; 85 (1): 8-27.
22. Hashem H, Toundelberg C, Jira T. Chromatographic application
on calixarene bonded stationary phases: a stability indicating lc-method for determination of celecoxib in tablet formulation.
Chromatographia 2010; 71 (1-2):91-94.
23. Murthy TEGK, chowdary YA, Narendra KK, Gowri SD, Durvasa
RB. Reverse phasse hplc determination of celecoxib in dosage forms. The Pharma Review 2006; 97.
24. Giuseppe C. Analytical procedure for determination of
cyclooxygenase-2 inhibitors in biological fluids by high performance liquid chromatography: review anti-inflammatory and anti-allergy agents. Med Chem 2009; 8: 22-37.
25. Jalalizadeh H, Amini M, Ziaee V, Safa A, Farsam H, Shafiee A. Determination of celecoxib in human plasma by
high-performance liquid chromatography. J Pharm Biomed Anal
2004; 35 (3): 665-670.
26. Zhang M, Moore GA, Gardiner SJ, Begg EJ. Determination of celecoxib in human plasma and breast milk by
high-performance liquid chromatographic assay. J Chromatogr B
2006; 830 (2): 245-8.
27. Sante RT, Swati P, Sachin K. High-performance thin-layer
chromatographic determination of celecoxib in its dosage form.
J Planar Chromatogr 2004; 17 (1): 61-64.
28. Chandran S, Jadhav PR, kharwade PB, Saha RN. Rapid and
sensitive spectrofluorimetric method for the estimation of celecoxib. Indian J Pharm Sci 2006; 68(1): 20-25.
29. Starek M, Rejdyck M. Densitometric analysis of celecoxib,
etoricoxib and valdecoxib in pharmaceutical preparations. J
Planar Chromatogr 2009; 22(6): 399 -403.
30. Roy A, Yohannan D, Lalith K, Saha RN. Development of rapid spectrophotometric methods for estimation of celecoxib and acyclovir in formulations. Indian J Pharm Edu Res 2008; 42(3): 215-221.
31. Patel NS, Nandurbarkar VP, Patel AJ, Patel SG. Simultaneous spectrophotometric determination of celecoxib and diacerein in bulk and capsule by absorption correction method and
chemometric methods. Spectrochim Acta A Mol Biomol Spectrosc
2014; 125: 46-52.
32. Maheshwari RK. Analysis of frusemide by application of
hydrotropic solubilization phenomenon. Indian Pharm 2005; 4:
55-58.
33. Maheshwari RK. A novel application of hydrotropic
solubilization in the analysis of bulk samples of ketoprofen and salicylic acid. Asian J Chem 2006; 18: 393-396.
34. Jain N, Jain R, Jain A, Pandey SP, Jain DK. Spectrophotometric quantitative estimation of amlodipine besylate in bulk drug and
their dosage forms by using hydrotropic agent. Eurasian J Anal
Chem 2010; 5(3): 212-217.
35. Jain N, Jain R, Kulkarni S, Jain DK, Jain S. Ecofriendly spectrophotometric method development & their validation for quantitative estimation of pramipexole dihyrochloride using mixed hydrotropic agent. J Chem Pharm Res 2011; 3(1): 548-552.
36. Jain N, Jain R, Sharma HK, Jain DK, Jain S. Application of mixed hydrotropic solubilization phenomenon for quantitative
analysis of olmesartan maedoxamil in tablet. The Pharma
Review 2011; 113-116.
37. Jain R, Jain V, Jain N, Jain DK, Jain SK. Ecofriendly
spectrophotometric method for quantitative estimation of lomefloxacin using hydrotropic approach. J App Pharm Sci 2012; 02 (04): 111-114.
38. Jain N, Jain R, Jain DK, Maheshwari RK, Jain S. Novel UV-Spectrophotometric method for quantitative estimation of furazolidone using mixed hydrotropic agent. Pakistan J Pharm Sci 2013; 26(1): 59-162.
39. Jain R, Jain N, Jain DK, Jain S. A Novel approach using
hydrotropic solubalization technique for quantitative
estimation of entacapone in bulk drug and dosage form. Adv
Pharm Bull 2013; 3(2): 409-413.
40. Jain R, Jain N, Jain DK, Jain SK. Economic spectrophotometeric method for quantitation of metronidazole and ofloxacin using
mixed hydrotropy technique. PHARMANEST an Int J Adv Pharm
Sci 2013; 4(5): 1097-1109.
41. Jain DK, Patel V, Banjare L, Jain N, Maheshwari RK. Solid as solvent-novel technique for spectrophotometric analysis of ornidazole tablets using melted phenol as solvent. Asian J
Biomed Pharm Sci 2015; 4(40): 26-29.
42. Jain DK, Patel VK, Bajaj S, Jain N, Maheshwari RK. Novel approach for spectrophotometric estimation of solid dosage forms of tinidazole using solids (eutectic liquid of phenol and niacinamide) as solubilizing agent (mixed solvency concept).
World J Pharma Pharm Sci 2015; 4(4): 763-769.
43. Jain R, Jain N, Jain DK, Patel VK, Rajak H, Jain SK. Novel UV spectrophotometer methods for quantitative estimation of metronidazole and furazolidone using mixed hydrotropy solubalization. Arabian J Chem 2017; 10:151-156.
44. Han DH. Consensi approved to treat hypertension and
osteoarthritis pain. MPR the right dose of information, 2018.
45. Beckett AH, Stenlake JB, Davidson AG. Practical Pharmaceutical
Chemistry, forth ed., vol. 2, CBS Publishers and Distributors, New Delhi, 2002; pp 275-293.
46. Pernarowski M, Kneval AM, Christian JE. Application of
absorbency ratios to the analysis of pharmaceutics, theory of analysis of binary mixtures. Ind J Pharm Sci 1960; 50: 943-947. 47. ICH, Q2 (R1). Validation of analytical procedures: text and