ISSN: 2149-214X
www.jeseh.net
Characterizing Middle Grade Students’
Integrated
Alternative
Science
Knowledge about the Effects of Climate
Change
Sarah J Fick1, Nancy Butler Songer2
1Wake Forest University 2Drexel University
To cite this article:
Fick, S.J. & Songer, N.B. (2017). Characterizing middle grade students’ integrated
alternative science knowledge about the effects of climate change. Journal of Education in
Science, Environment and Health (JESEH), 3(2), 138-156.
DOI:
10.21891/jeseh.325792
This article may be used for research, teaching, and private study purposes.
Any substantial or systematic reproduction, redistribution, reselling, loan, sub-licensing,
systematic supply, or distribution in any form to anyone is expressly forbidden.
Authors alone are responsible for the contents of their articles. The journal owns the
copyright of the articles.
Characterizing Middle Grade Students’ Integrated Alternative Science
Knowledge about the Effects of Climate Change
Sarah J Fick, Nancy Butler Songer
Article Info
Abstract
Article History
Received: 21 March 2017
Recent reforms emphasize a shift in how students should learn and demonstrate knowledge of science. These reforms call for students to learn content knowledge using science and engineering practices, creating integrated science knowledge. While there is existing literature about the development of integrated science knowledge assessments, few studies examine the character of alternative integrated science knowledge (AISK) that students demonstrate when responding to these assessment items. This study describes the AISK middle grade students demonstrate in response to integrated science tasks. Students completed a pre-instruction task by making predictions, justifying their predictions about the geographic range of species’ habitats, and adjusting that prediction based on a climate change scenario. These findings revealed four areas of AISK: 1) Climate Data Interpretation and Analysis, 2) Identifying Climate Patterns, 3) Identifying Causes of Climate Patterns, and 4) Justifying Climate Claims. For each area, specific patterns in AISK were identified and described. The findings indicate that integrated assessments can provide insights into students’ struggles coordinating science content and practices for integrated knowledge products, and present a continuum to which students’ AISK can be compared. This work has potential to be used for the development of teaching strategies to support students’ developing integrated science knowledge.
Accepted: 20 May 2017
Keywords Integrated knowledge Middle grades Climate change Predictions
Introduction
What does it mean to know or understand science knowledge? For many years, individuals in pre-college science classes were characterized as knowing science knowledge if they could recite definitions of key scientific terms or recall important scientific formulas. Since the 1990s, there has been a slow shift in terms of how we characterize science knowledge in the United States (NRC, 1996; NRC, 2012; NGSS Lead Sates, 2013) and internationally (e.g. United Kingdom Department of Education, 2015; National Curriculum Board, 2009). In the United States, the Framework for K-12 Science Education (Framework; NRC, 2012) and the Next Generation Science Standards (NGSS Lead States, 2013) have shifted to an emphasis on science knowledge as having three interconnected dimensions: (1), disciplinary core ideas (DCIs), (2) science and engineering practices (SEPs), and (3) crosscutting concepts (CCCs).
The documents used in the United Kingdom (United Kingdom Department of Education, 2015) and in Australia (National Curriculum Board, 2009) delineate similar components to science knowledge. This shift in how we describe science knowledge, towards a description of that interconnects science facts and content with science ways of knowing necessitates a corresponding shift in characterizing an individual’s understanding of science concepts (Songer & Kali, 2014). While research exists that characterizes students’ knowledge associated with disciplinary core ideas and science practices (e.g. Gotwals & Songer, 2013), there is a need for additional research that characterizes students’ misconceptions associated with this newer integrated science knowledge and that characterizes intermediate and final form integrated science knowledge.
The crosscutting concepts (CCCs) will support students in making connections across science disciplines and to support deeper understanding of science content (NRC, 2012), though little research has empirically examined classroom practice using the CCCs. The science and engineering practices (SEPs) are the ways of knowing, e.g., the means through which the science content is developed. The Framework (NRC, 2012) suggests that students should be learning science as an integration of science practices, disciplinary core ideas, and crosscutting concepts (e.g., a three-dimensional product).
Characterizing Integrated Science Knowledge
While integrated science knowledge is the goal, not all integrated products are accurate or complete. Students’ integrated responses, when not complete or accurate, can reveal student’s challenges and struggles. Though questions remain about what kinds of tasks provide good evidence of students complete and incomplete integrated science knowledge. A recent document from the National Academy of Science titled, Developing Assessments for the Next Generation Science Standards (NRC, 2014), states that tasks designed to provide evidence of integrated science knowledge should have these characteristics:
“multiple components that reflect the connected use of different scientific practices in the context of interconnected disciplinary ideas and crosscutting concepts,
reflect the progressive nature of learning by providing information about where students fall on a continuum between expected beginning and ending points in a given unit or grade; and
an interpretive system for evaluating a range of student products that is specific enough to be useful in helping teachers understand the range of student responses and that provides tools to helping them decide on next steps in instruction.” (NRC, 2014; p. 130)
The research literature documents that studies describing students’ integrated knowledge on a continuum from early to late form integrated science knowledge are needed. In particular, we need research that characterize the products of learning associated with the development of integrated science knowledge.
Alternative Integrated Science Knowledge (AISK)
While many research groups have focused on students’ alterative science knowledge (e.g. Driver et al., 2008; Minstrell, 2001; Arslan et al., 2012) their contributions primarily focus on the ways that students misunderstand content only, e.g., without consideration for how students’ might represent misunderstandings in integrated science knowledge. For example, Driver and colleagues’ work focused on ways of eliciting students’ alternative science knowledge using images (Driver et al., 2008), though the images are generally ones produced by others to clarify how students are thinking about a concept. Similarly, Keeley and colleagues (e.g. Keeley & Tucker, 2016) created a series of books focused on prompts to understand which common misconceptions students demonstrate. While at times these researchers provided insights about how students reason (e.g. Keeley & Tucker, 2016) and their certainty about their knowledge (Arslan et al., 2012), in general, there is no systematic documentation of alternative integrated science knowledge (AISK) existing in the literature.
Students’ Scientific Predictions
Scientific predictions consist of evidence generated to support a claim about an unknown or future event that can be verified at a later time. Two examples of everyday predictions that individuals encounter are daily weather reports and predictions about the long-term impacts of climate change. Predictions are an important tool used by scientists. For example, the Intergovernmental Panel on Climate Change (IPCC) generates predictions about the future impacts of climate change (IPCC, 2014). Despite the common use of scientific predictions, those outside science often do not understand how predictions are generated or how they should be interpreted (Pielke et al., 2003).
progress in students’ understanding, where a student’s initial prediction can serve as a marker of the starting point.
Based loosely on models of decomposing the science and engineering practice of explanation or argument building explored by a variety of research teams (Songer, Kelcey, Gotwals, 2009; McNeill et al., 2006; Windschitl et al., 2008), we have adopted a definition of a scientific prediction that identifies the prediction as the claim, similar to a claim within a scientific argument, and identifies reasoning and/or evidence as the supporting material for the prediction (see Lee & Songer, 2003). The supporting material might be evidence from a previous experiment (evidence), a related scientific definition or principle (reasoning), and/or previous experience with the phenomenon (prior knowledge or experience). Since a student can use any available related information in support of a prediction a new term is needed; in this case, the term justification is used. Students’ selection of justification to support their scientific predictions involves a similar process to selecting evidence from data or selecting appropriate reasoning, an area where students traditionally struggle (e.g. Sadler 2004). Therefore, in these studies, the process of selecting justification involves identifying appropriate evidence, experience, or scientific principles to support the prediction. While using justification is an important part of encouraging students to support their thinking, teachers often fail to push students to use justifications to support their predictions (Arias et al., 2016).
Study Design
This study is designed to answer the research question: What alternative integrated science knowledge do eighth grade students demonstrate in response to integrated assessment items? This descriptive study focuses on characterizing the types of information that eighth grade students demonstrate pre-instruction relative to assessment task prompts that ask students to develop integrated predictions about the effects of climate change on species habitats. An assessment was developed that required students to demonstrate their knowledge of the disciplinary core ideas of climate data through three sub-areas of the science practice of interpretation and analysis: identification, pattern identification, and data manipulation. The assessment questions required a variety of levels of prior knowledge of scientific and geographic phenomena through the science practices of interpretation and analysis. This assessment focused on integrated knowledge designed to be a realistic replication of a classroom task.
Data Analysis Constructs
This assessment was designed to generate evidence of students’ pre-instruction integrated science knowledge about potential human impacts on species’ habitat due to climate change. The three dimensions of integrated science knowledge (e.g., DCI, CCC and SEP) that formed the basis for this assessment is illustrated in Table 1. The assessment was also designed to provide evidence of students’ abilities to develop integrated knowledge products about the potential effects of climate change (DCI), analyzing data from models (SEP) to find patterns (CCCs) to support a prediction (SEP) in integrated science knowledge products. If students were completely successful, they would demonstrate DCIs about climate change’s effect on species habitat (CCC-cause and effect) through the SEP of using models to make predictions. The specific DCIs, CCCs, and SEPs associated with various assessment questions are represented in Table 2.
completely random [statistically random]. There is an order to the way things look.” Pattern recognition requires that students notice when there is a non-random organization of the data. The recognition of patterns requires the ability to observe regularity. When students are asked to describe a pattern, that process requires some geographic or scientific prior knowledge. Describing a pattern or explaining why it might occur requires knowledge of geography and scientific processes that might cause the pattern. Pattern recognition was considered a content dependent scientific practice. While students might observe a pattern, it is possible they do not recognize it as such unless they have supporting scientific content.
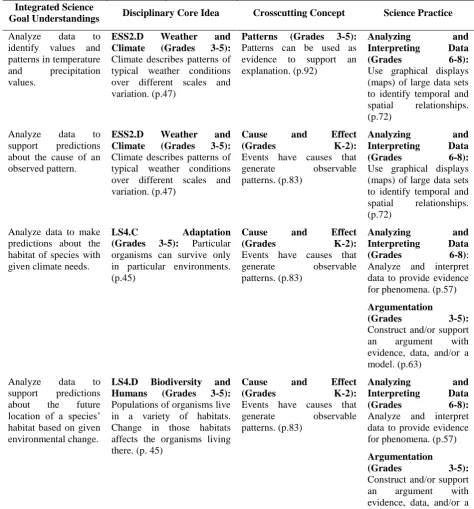
Table 1. Integrated science goal understandings that served as the focus of the assessment Integrated Science
Goal Understandings Disciplinary Core Idea Crosscutting Concept Science Practice
Analyze data to identify values and patterns in temperature and precipitation values.
ESS2.D Weather and Climate (Grades 3-5): Climate describes patterns of typical weather conditions over different scales and variation. (p.47)
Patterns (Grades 3-5): Patterns can be used as evidence to support an explanation. (p.92)
Analyzing and
Interpreting Data
(Grades 6-8):
Use graphical displays (maps) of large data sets to identify temporal and spatial relationships. (p.72)
Analyze data to support predictions about the cause of an observed pattern.
ESS2.D Weather and Climate (Grades 3-5): Climate describes patterns of typical weather conditions over different scales and variation. (p.47)
Cause and Effect
(Grades K-2):
Events have causes that generate observable patterns. (p.83)
Analyzing and
Interpreting Data
(Grades 6-8):
Use graphical displays (maps) of large data sets to identify temporal and spatial relationships. (p.72)
Analyze data to make predictions about the habitat of species with given climate needs.
LS4.C Adaptation
(Grades 3-5): Particular organisms can survive only in particular environments. (p.45)
Cause and Effect
(Grades K-2):
Events have causes that generate observable patterns. (p.83)
Analyzing and
Interpreting Data
(Grades 6-8):
Analyze and interpret data to provide evidence for phenomena. (p.57) Argumentation
(Grades 3-5):
Construct and/or support an argument with evidence, data, and/or a model. (p.63)
Analyze data to support predictions about the future location of a species’ habitat based on given environmental change.
LS4.D Biodiversity and Humans (Grades 3-5): Populations of organisms live in a variety of habitats. Change in those habitats affects the organisms living there. (p. 45)
Cause and Effect
(Grades K-2):
Events have causes that generate observable patterns. (p.83)
Analyzing and
Interpreting Data
(Grades 6-8):
Analyze and interpret data to provide evidence for phenomena. (p.57) Argumentation
(Grades 3-5):
Construct and/or support an argument with evidence, data, and/or a model. (p.63)
Note: Statements in columns 2-4 of this table are direct quotes of the elaborated dimensions found in NGSS Volume 2: Appendixes, page numbers refer to the page on which the text can be found. (NGSS Lead States,
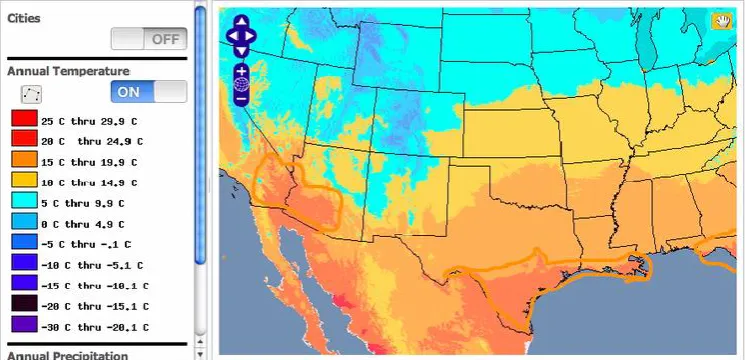
Figure 1. A precipitation map, with precipitation classified by 50cm bands of annual average precipitation. Below the map is an example of one of the question bundle that would accompany this type of map, in this case it is the question bundle associated with map 7
The second type of analysis task includes the adjustment of data values by a constant change to represent changing environmental conditions (Figure 2). After recognizing magnitude and direction of the change, students then adjust the values represented by the various colors to reflect the change, and circle the new areas satisfying the data range. Data adjustment was considered a scientific practice, because it requires students to visualize a constant change in the data.
Finally, the students were required to apply observations from a map as justification in support of a scientific prediction in answer to a scientific question (Table 2: Questions 13, 17, and 19). This required the student to select a supporting observation or pattern from the data represented on the map associated with the answer to a scientific question and to describe that observation or pattern in words as evidence. Predictions included a claim, and two justifications. The two justifications could include data, a scientific concept, or a definition that supports their answer to the scientific question. Because this task was intended to focus on interpretation and analysis, students’ knowledge of scientific phenomena and political labels was intentionally kept to a minimum in the assessment task, but it was a component of all aspects of the process.
Implementation of the Assessment
Middle grade students have prior experience with maps in a variety of contexts and circumstances both in and out of the school environment. In addition, students might have experience with the disciplinary core knowledge related to human impacts on climate change, species’ habitats, or climate change. These experiences and knowledge serve as foundational DCI knowledge that students draw on when demonstrated integrated science knowledge, such as the analysis of climate data or interpreting a climate model.
The assessment tasks utilized an online visualization tool (Peters & Songer, 2013) for the presentation of geographic visualizations. As shown in Figure 1 and Figure 2, the assessment questions were presented on the same webpage as the tool. The complete set of assessment items is presented in Table 2, and each change in webpage is represented by the row labeled with a map number. For each page of the assessment, a single question, or a set of questions was associated with a single map of temperature or precipitation data. When a student changed maps, or set of questions, the map would reset to the original settings thereby providing students with a blank map on which to begin the next question. The exception to this was for map 8, for this map, students were provided with the circles that they created when answering the questions for maps 6 and 7. Students completed the assessment tasks on a laptop during a free period. The assessment tasks were designed so that evidence of students’ integrated science knowledge as well as the errors and incomplete integrated science knowledge could be demonstrated by requiring students to circle areas on a map that matched the given criteria, make predictions about future conditions, and to justify their predictions using any prior knowledge they had. For example, as seen in Figures 1 and 2, students used average temperature and average precipitation data as evidence in generating scientific predictions about where they might find specific environmental conditions. In addition to being aligned with the NGSS (Table 1; NGSS Lead States, 2013), these integrated knowledge tasks are aligned with standards recommendations from the National Council on Geographic Education (Bednarz et al. 1994).
Additional Considerations in Assessment Task Design
The amount of prior content knowledge related to climate, climate change, species habitat, and biological evolution required to be complete the assessment tasks was kept to a minimum by providing data within the task itself to serve as justification for the predictions, and by accepting any accurate response. Students did not need to know the names of states within the United States, but were expected to be able to pick out the border between the US and Canada, and the US and Mexico from lines on the map that outlined the individual states that make up the United States, since questions required students to “circle the areas within the United States”.
Study Population
The students who completed the assessment consisted of six eighth-grade students in a science focused charter school in the urban center of a large Midwestern city. The school serves students living anywhere in the city district, which encompasses almost the entire city. The eighth-grade class that year was composed of 96.4% African-American students, the remaining <4% being made up of other races; 61% of the students were male, with only 39% female. Less than 10 students in the school were classified as English Language Learners.
The school was a charter school in a very low SES school district. Of the six students interviewed, two students were female, and one student was of an ethnicity other than African-American. The students were from different classroom sections, but they had the same science teacher. The teacher selected students who represented a range of abilities to participate in the study. Students’ abilities were based on their performance in science class. Since the participants were at the very end of their eighth-grade year, they can be considered students transitioning from the middle grades (middle school) to upper grades (high school). All the students had been at the school for two or three years and therefore had experience with a research-based National Science Foundation sponsored curricular units focused on the development of integrated science knowledge in a variety of different disciplinary core ideas.
Data Collection
Students completed the assessment individually in their science classroom with the teacher present. The teacher was in a different part of the room focused on completing other tasks. The assessment consisted of 19 questions that took from 40 to 70 minutes to complete. The assessment was delivered through an interactive assessment format made up of clusters of tasks. For all questions, students could interact with the maps on the site by zooming in and zooming out, turning on and off the precipitation and temperature data layers, and circling areas on the map to identify particular locations. The assessment task began with an example question, that was focused on introducing the student to the tools and features of the maps, which asked students to locate and circle the state they lived in. The example was followed by 19 questions which are the focus of this research study.
For all pilot and research study interviews, the first author was present as students responded to the questions and a think aloud protocol (Ericsson & Simon 1993) was used. As students completed the task, the first author prompted the students to provide information about the process they were using to answer the questions, and why the students selected the particular answers. The assessment completion was recorded using ScreenFlow (Telestream 2011) software. ScreenFlow software stores a continuous record of the screen of the computer with a coordinated record of the ambient noise in the room. Recordings consisted of a continuous screenshot of the students’ screen activities accompanied by audio of the students’ described responses, the think aloud description of the process they used for answering the question, and the written responses students provided for the assessment questions.
Data Analysis
Students’ verbal and written responses were initially transcribed. This process of transcription used both the audio recording and the coordinated screenshots to determine any context specific verbal responses, such as “it’s right here,” where the student indicated a location with their cursor. In examining students’ responses to the assessment tasks, iterative rounds of coding (Miles & Huberman 1994) initially characterized written responses as correct or incorrect.
Results
Types of Errors
The integrated science knowledge errors that students demonstrated consisted of different combinations of the DCI, CCC, and SEP, thus resulting in new types of AISK. The errors were categorized into one of five types:
o Error Type 1: Climate Data Interpretation and Analysis: Earth’s Systems + Analyzing and Interpreting Data.
o Error Type 2: Identifying Climate Patterns: Earth’s Systems + Pattern + Analyzing and Interpreting Data.
o Error Type 3: Identifying Causes of Climate Variation: Earth’s Systems + Cause and Effect + Analyzing and Interpreting Data.
o Error Type 4: Justifying Species Range Predictions: Earth’s Systems + Biological Evolution + Analyzing and Interpreting Data + Argumentation.
o
Each type of error was associated with several observed categories of error (Table 3). Each category of error could be ranked on a hierarchy describing the level of the problem (Table 3, right column). The hierarchies were determined based on whether there was sufficient information to judge the response, and subsequently whether the student used appropriate information in generating that response. The types of error, and categories of error, are elaborated with examples from students’ responses. It is important to note that certain types of errors were only possible on certain questions (see Table 4). For example, students never made an error in pattern identification when circling on the map.
Students’ Errors When Making Climate Change Predictions
This paper is focused on the types of errors that students in their attempts to demonstrate integrated science knowledge, e.g., knowledge statements that include both DCI and SEPs or DCI, SEPs and CCCs in an integrated statement. Since it is difficult to determine the cause of the error, the sections below focus on describing the errors, not the cause. The errors selected below focus on the difficulties that students had with making integrated predictions. By focusing on the errors associated with justifying climate change predictions, we can concentrate on the ways in which we might support students to develop integrated knowledge.
Error Type 1: Climate Data Interpretation and Analysis: Earth’s Systems (DCI) + Analyzing and Interpreting Data (SEP)
These errors are associated with interpreting and analyzing the data represented in the maps. These were errors in which students had difficulty coordinating the DCI and the SEP of data analysis to communicate the information presented. For example, students circled areas that were smaller or larger than the area with the specified data or they demonstrated errors in interpreting the climate data represented in the maps.
The early part of the assessment focused on identifying climate values on the map. These assessment items asked students to identify locations with specified conditions (“Analyzing and Interpreting Data + Earth’s Systems”, Table 1). In students’ responses, they needed to circle the areas that met the specified conditions. Often students were inexact in their circling, including other data values in with the correct ones (e.g. Figure 3). At other times the students circled part of the correct response but did not include all the data in their response (e.g. Figure 4). These responses were a level 2 error (Table 3), because they included correct areas, but also included incorrect areas, or were missing some correct areas. All the students who participated in the study did this at least once (Table 4: Error Type 1, Level 2). A third variation within this error type are the instances where the students circled areas that did not include the correct values (e.g. Figure 5). There were several different ways that students might do this. The initial comparison between the key and the map might result in the student picking the wrong color, a level 1 error (Table 4: Error Type 1, Level 1), or the question might ask a student to do a data adjustment that resulted in the student picking the wrong color to represent the adjusted data values, a level 3 error (Table 4: Error Type 1, Level 3).
values (Table 4: Error Type 1), while most students included some of the correct values, many students missed part of the range. It was more common for students to circle some of the correct results than none as shown by a comparison of rows 1 and 2 in Table 3. There was one student who answered more than half of these questions correctly, student 6.
Error Type 2: Identifying Climate Patterns: Earth Systems (DCI) + Pattern (CCC) + Analyzing and Interpreting Data (SEP)
These errors focused on students having difficulty describing a pattern they identified in the data. Many students referred to the data without reference to locations. Two questions required students to describe the patterns they identified on the map (Table 2, Questions 5 & 8). The students’ descriptions clarified what the student selected as being a pattern. In their descriptions, students frequently referred to the colors observed in the maps without reference to geographic information (Table 3: Incomplete Description of Climate Pattern). Since it was difficult to determine exactly what part of the data the students were describing, these errors were coded as incomplete descriptions of the climate pattern, a level 1 error (Table 4: Error Type 2, Level 1). For example, student stated:
The pattern looks like its going from blue orange blue orange – Student 2 (Question 5) The pattern looks like the readings turned to the right, or laid on their right side. – Student 3 (Question 8)
Based on the descriptions provided by the students, it was difficult to determine to what extent their observations reflected a pattern as defined in the task: “A pattern is when something is placed in a way that is not completely random. There is an order to the way things look.” (The definition of a pattern included in the assessment). While students often accurately described something that could be a pattern, their responses often lacked connection to the data presented or the disciplinary core knowledge that could be integrated into the response to support their observation.
Error Type 3: Identifying Causes of Climate Variation: Earth’s Systems (DCI) + Cause and Effect (CCC) + Analyzing and Interpreting Data (SEP)
There were several responses that indicated a lack of accurate knowledge about the causes of climate variation (Table 4: Error Type 3). These answers were in response to questions that asked students what might be a cause of the pattern they observed. In these cases, students’ lack of knowledge about climate became apparent in their difficulty being able to describe the cause of a pattern. These items asked students to, “in complete sentences, describe what might cause the pattern” (see Questions 6 and 9, Table 2). This phrasing, including “might”, was intended to allow students unfamiliar with the cause room for speculation, engaging their prior knowledge. These responses that showed AISK about what causes variation in climate were level 2 errors (Table 3: Inaccurate Description of Pattern Cause). Some examples of these responses are:
I think that different types of time zones/dates cause different temperatures. – Student 2 (Question 6) The air pressure as your higher in the atmosphere rather than going lower. – Student 4 (Question 6)
These responses make clear students’ AISK about things that can be classified as a cause of varying climates. Student 2 seemed to have alternative science knowledge about a places’ positioning on the globe being related to the temperature, and the reason why we have time zones. Some additional probing of the student’s understanding would clarify the students’ meaning here. This was the most common difficulty with this question type (Table 4: Error Type 3, Level 2).
Figure 3. Map of student 3’s response to question 14. The area that the student circled includes many different precipitation values, particularly in the area identified in the Pacific Northwest. This is also the case for the area
identified in the Southeast though, since there are three different precipitation values in the area identified
Figure 4. Map of student 4’s response to question 10. The area that student 4 circled represents one of two temperature bands that were specified by the question. This error was continued as the student transformed the
data to represent a changing climate in question 11.
Figure 5. A map showing student 6’s response to question 2. The area that student 6 circled is one temperature band away from the values specified by the question (15°C to 19.9°C). The student’s response does not include
Error Type 4: Justifying Climate Claims: Earth’s Systems (DCI) + Argumentation (SEP)
Students also made errors when justifying their climate predictions. These errors were demonstrated when students provided an incomplete description of their justification (level 1), used unrelated information to support their prediction (level 2), made a prediction statement as justification (level 3), or an alternative idea about the DCI material included in their justifications (level 4). In other words, students often used something other than relevant DCI evidence to support their claim. Many students had difficulty relating the DCI associated with earth systems with the SEP of argumentation to generate justified predictions based on climate data or in providing sufficient and accurate justification that was scientific and not personal. For example, students made a variety of errors in supporting their predictions with accurate DCI climate change knowledge for justification. Students did not receive instruction about constructing predictions supported by justification, and correspondingly many of the errors were based on the kinds of DCI information that students provided as justification. It is possible that some of these errors could be attributed to lack of prior knowledge or insufficient DCI knowledge to identify appropriate support.
Some students used unrelated personal knowledge as justification for their predictions (Table 4: Error Type 4, Level 2). One example was: “The areas where tornados are most common.” – Student 6 (Question 17)
Neither tornados nor, more generally, natural disasters were discussed in the task. Weather and climate phenomena were presented in terms of annual average temperature, and the potential for change in those averages was presented. Another example demonstrates that, if a student referenced information insufficiently, it was unclear if the student based their reasoning on personal knowledge or information provided in the task. For example, in this level 1 answer, the student uses vague terms, making it unclear whether the information used is from the task: “For the [justification] the bog lemming likes the heat so with less rain level and in dry spots it would like to stay there.” – Student 5 (Question 17). In this example, the student refers to conditions the animal prefers such as “likes the heat” and “dry spots.” These phrases are referential to a standard level of temperature, a normal, which is not clearly defined. In this case, “likes heat” refers to an undefined range of temperatures. While this may appear to focus on minute details, the students were given ranges of values that the bog lemming preferred which corresponded to specific colors on the temperature and precipitation map. This student translated those ranges into a personal value system, not clearly specified, and used that system as a justification for the prediction. Some students used a claim as justification for a different claim, a level 3 error. An example from a students’ work is:
The plants and animals would die and travel further like the bog lemming to find food. – Student 4 (Question 17).
This student further provided information about what might happen to other animals, after having made a claim about what they expected to happen to the bog lemming.
Three students made a level 4 error, an inaccurate description of the science process (Table 4: Error Type 4, Level 4). In response to question 13, student 4 wrote:
if it became hotter, (5 degrees) the [sic] would travel up to a warmer habitat.
This response uses all the correct principles, except that the student adjusted the temperature inaccurately. If the average temperature were getting warmer, then the location of the animal’s preferred habitat would be where it had been previously cooler. This error in adjustment is a scientifically based error (Table 3: Inaccurate Description of Science Process).
Patterns across Students
In looking across student responses as represented in table 4, there are no clear patterns in the level of error that a student made across the questions. The errors that student 1 made primarily fall in the category of incorrect or imprecise identification, which speaks to the necessity of basic identification skills for beginning the assignment. For most students, there was one level of error that was most common for each error type. There were several students who got 50% or more questions right for a particular type of question, but for the questions that they got wrong, there was not a distinguishable pattern in the level of error made.
Discussion
This research shows examples of assessment items and student responses that represent students’ progress on integrated science knowledge. By asking questions that asked students to analyze data to find patterns and make predictions about the cause and effect of changing climate, these assessment tasks revealed many different AISK that students held about the cause of climate change and the effects of these changes on species. A review of the results across all students and tasks reveals these general patterns:
The use of maps that showed variation in temperature and precipitation seemed to make the task more complex, increasing the level of difficulty of the associated tasks.
While most students were successful with the basic identification tasks with this representation, some struggled with the introductory questions. Those who were successful with identification were generally challenged by the questions that required them to make an adjustment, describe a pattern, make a prediction, or describe a possible cause.
The application questions were frequently more challenging for the students. As a result, these tasks elicited a wider range of students’ AISK about climate change, its causes and its associated impacts on species.
Students’ errors did tend to clump around a single level or two within an error type, but the level in one error type did not appear associated with whether a student was successful in a different error type.
A common theme across several types of errors was that students’ responses indicated confusion about the cause of climate variation as an underlying principle, such as differences in latitude being associated with variation in the range of temperatures typically experienced. Many students in this study struggled with both the application of and the mechanism for this information. This kind of foundational knowledge, often initiated at the elementary levels, is one that teachers might want to use to build a knowledge of climate change. These findings do more than that, they show us several more specific areas where students demonstrated various alternative science knowledge about how the science content was visually presented, what the science content represented, and how to use that information to answer complex questions. Each of these areas is a possible place where a student might need specific scaffolding (Reiser & Tabek, 2014) to develop deep knowledge related to climate change. The format of these assessment tasks facilitated seeing the challenges that students faced to express integrated science knowledge about this content.
This research also characterized the types of AISK that students demonstrate about the interpretation and analysis of climate data, the identification and explanation of climate patterns using data, and the use of data justifying predictions. This AISK is different from those described by Driver and colleagues (2008) because they incorporate content and practices together to reveal deeper challenges that students have using their knowledge of the DCI than might be represented on an assessment item focused on the DCI alone.
Need Assessment Tasks that Characterize Alternative Integrated Science Knowledge (AISK)
The tasks presented here required students to demonstrate their knowledge of disciplinary core idea and crosscutting concepts through the science practices and therefore students’ progress towards achieving complete integrated science knowledge. In several of the questions, students were asked to find patterns and make predictions about the cause and effect of those patterns. These questions proved difficult for students, and as a result we were able to generate new typologies of AISK that students demonstrate about climate, climate change, and species habitat that students expressed during the assessment.
types of errors that fell short of these ideals. Characterizing these errors is the first step in both understanding students’ progress towards integrated knowledge and in crafting new teaching and learning strategies to help students become more successful. Though there has been prior work developing and evaluating integrated assessments (e.g. Gotwals & Songer, 2013), thus far, the focus has not been on characterizing students’ alternative knowledge relative to a standard (Songer & Kali, 2014).
These findings build on the work of others (e.g. Driver et al., 2008; Keeley & Tucker, 2016) in supporting teachers to identify common alternative science knowledge that students might hold related to core content. Driver and Keeley and colleagues (e.g. Keeley & Tucker, 2016; Driver et al., 2008) provided information about challenges that students demonstrate with disciplinary core ideas and provided valuable assessment tasks for diagnosing students’ alternative science content knowledge. One conclusion that can be taken away from Keeley’s formative assessments is the value of a clearly written diagnostic tool that explains students’ responses. Building on that work, these results provide useful information so that teachers can more easily identify and address students’ AISK when developing and demonstrating integrated knowledge. In addition, this work presents the analysis tools used to interpret the alternative integrated knowledge represented in students’ responses. These analysis tools can serve as a model for diagnosis tools that describe the possible answers you might receive to these constructed response questions. Building on the work that Keeley has done in developing formative assessment probes to understand students’ misconceptions and making them available and useful for teachers, this work suggests the value of an additional type of formative assessment probe that reveals a range of integrated alternative science knowledge.
Moving Forward
The examples presented here show the need for formative assessments that support teachers to identify the challenges that students have developing integrated knowledge. This research also shows that students can express integrated knowledge even when the disciplinary core ideas are challenging for students. When content is more complex, such as climate change, students’ ability to draw from that content knowledge towards the creation of integrated knowledge products is considerably more challenging. In such difficult content areas, asking students to create integrated predictions can be a tool for revealing students’ challenges in successfully combining the content with science and engineering practices.
These findings also provide examples of AISK that middle grade students demonstrate in response to integrated assessment items. The work presents a first attempt at an integrated science knowledge continuum to which the students’ progress can be compared. This work has potential to be used for the development of formative assessments and teaching strategies to support students’ developing integrated understandings.
References
American Association for the Advancement of Science (AAAS). (1993). Benchmarks for science literacy. New York: Oxford University Press.
Arias, A. M., Davis, E. A., Marino, J.-C., Kademian, S. M., & Palincsar, A. S. (2016). Teachers’ use of educative curriculum materials to engage students in science practices. International Journal of Science Education, 38, 1504–1526.
Bednarz, S. W., Bettis, N. C., Boehm, R. G., deSouza, A. R., Downs, R. M., Marran, J. F., et al. (1994). Geography for Life: National Geography Standards 1994. Washington, D.C.: National Geographic Research & Exploration.
College Board. (2009). Science: College Board Standards for College Success. Princeton, NJ: College Board. Davis, E. A., & Linn, M. C. (2000). Scaffolding students' knowledge integration: Prompts for reflection in KIE.
International Journal of Science Education, 22(8), 819-837.
Driver, R., Guesne, E., & Tiberghien, A. (2008). Children’s Ideas and the Learning of Science. In R. A. Driver, E. Guesne, & A. Tiberghien (Eds.), Children’s Ideas in Science (pp. 1–9). Glasgow: Bell & Bain Ltd. Duschl, R. A., Schweingruber, H. A., & Shouse, A. W. (2007). Taking science to school: Learning and teaching
science in grades K-8. Washington, DC: National Academy Press.
Ericsson, K. A., & Simon, H. A. (1993). Protocol Analysis: Verbal Reports as Data. Cambridge, MA: MIT Press.
IPCC. (2014). Climate Change 2014: Synthesis Report. Contributions of Working Groups I, II, and III to the Fifth Assessment Report of the Intergovernmental Panel on Climate Change. (Core Writing Team, R. K. Pachauri, & L. A. Meyer, Eds.). Geneva, Switzerland: IPCC.
Keeley, P., & Tucker, L. (2016). Uncovering Student Ideas in Earth and Environmental Science. Arlington, VA: NSTA Press.
Lee, H. S., & Songer, N. (2003). Making authentic science accessible to students. International Journal of Science Education, 25(8), 923–948.
Linn, M. C. (2006). The knowledge integration perspective on learning and instruction. In R. K. Sawyer (Ed.), The Cambridge Handbook of the Learning Sciences (pp. 243-64). Cambridge University Press New York.
McNeill, K. L., Lizotte, D. J., Krajcik, J., & Marx, R. W. (2006). Supporting Students' Construction of Scientific Explanations by Fading Scaffolds in Instructional Materials. Journal of the Learning Sciences, 15(2), 153-191.
McNeill, K. L., & Krajcik, J. (2007). Middle school students' use of appropriate and inappropriate evidence in writing scientific explanations. In M. C. Lovett & P. Shah (Eds.), Thinking with data. (pp. 233-65). New York, NY: Lawrence Erlbaum Associates
Miles, M. B., & Huberman, A. M. (1994). An Expanded Sourcebook: Qualitative Data Analysis (2nd ed.). Thousand Oaks, CA: Sage Publications.
Minstrell, J. (2001). Facets of students?’ thinking: Designing to cross the gap from research to standards-based practice. In K. Crowley, C. D. Schunn, & T. Okada (Eds.), Designing for science: Implications from everyday, classroom, and professional settings (pp. 415–443). Mahwah, NJ: Erlbaum.
National Curriculum Board. (2009). Shape of the Australian Curriculum: Science. Commonwealth of Australia. Retrieved from http://www.acara.edu.au/_resources/Australian_Curriculum_-_Science.pdf
National Research Council. (2012). A Framework for K-12 Science Education: Practices, Crosscutting Concepts, and Core Ideas. Washington, DC: The National Academies Press.
National Research Council. (2014). Developing Assessments for the Next Generation Science Standards. Committee on Developing Assessments of Science Proficiency in K-12. Board on Testing and Assessment and Board on Science Education, J.W. Pellegrino, M.R. Wilson, J.A. Koenig, and A.S. Beatty, Editors. Division of Behavioral and Social Sciences and Education. Washington, DC: The National Academies Press.
National Research Council. (2005). How students learn: History, mathematics, and science in the classroom. Washington, DC: National Academies Press.
National Research Council. (1996). National Science Education Standards. Washington, DC: The National Academies Press.
NGSS Lead States. (2013). Next Generation Science Standards: For States, By States. Washington, D.C.: The National Academies Press.
NGSS Lead States. (2013b). Next Generation Science Standards: For States, By States. Volume 2: Appendixes. Washington, D.C.: The National Academies Press.
Patton, M. Q. (2002). Qualitative research & evaluation methods (3 ed.). Thousand Oaks: Sage Publications. Peterman, K., Cranston, K. A., Pryor, M., & Kermish-Allen, R. (2015). Measuring Primary Students’ Graph
Interpretation Skills Via a Performance Assessment: A case study in instrument development. International Journal of Science Education, 37(17), 2787–2808.
Peters, V. L., & Songer, N. B. (2013). Evaluating the Usability of a Professional Modeling Tool Repurposed for Middle School Learning. Journal of Science Education and Technology, 22(5), 681–696.
Piaget, J., & Inhelder, B. (1969). The Psychology of the Child. (H. Weaver, Trans.). New York City: Basic Books.
Pielke, R. A., & Conant, R. T. (2003). Best practices in prediction for decision-making: lessons from the atmospheric and earth sciences. Ecology, 84(6), 1351–1358.
Ruiz-Primo, M. A., Li, M., Tsai, S.-P., & Scheider, J. (2010). Testing One Premise of Scientific Inquiry in Science Classrooms: Examining Students' Scientific Explanations and Student Learning. Journal of Research in Science Teaching, 47(5), 583-608.
Sadler, T. D. (2004). Informal reasoning regarding socioscientific issues: A critical review of research. Journal of Research in Science Teaching, 41(5), 513-536.
Sadler, T. D., Chambers, F. W., & Zeidler, D. L. (2004). Student conceptualizations of the nature of science in response to a socioscientific issue. International Journal of Science Education, 26(4), 387–409.
Songer, N. B. (2006). BioKIDS: An animated conversation on the development of curricular activity structures for inquiry science. In R. K. Sawyer (Ed.), The Cambridge Handbook of The Learning Sciences (pp. 355–371).
Songer, N. B., & Kali, Y. (2014). Science Education and the Learning Sciences as Coevolving Species. In R. K. Sawyer (Ed.), Cambridge Handbook of the Learning Sciences (2nd Edition). New York, NY: Cambridge University Press.
Songer, N. B., Kelcey, B., & Gotwals, A. W. (2009). How and when does complex reasoning occur? Empirically driven development of a learning progression focused on complex reasoning about biodiversity. Journal of Research in Science Teaching, 46(6), 610–631.
Telestream, Inc. (2011). ScreenFlow Software (Version 3.9) [Software]. Available from http://www.telestream.net/screen-flow/overview.htm
Toulmin, S. (1958). The Use of Argument. Cambridge, England: Cambridge University Press.
United Kingdom Department of Education. (2015). National Curriculum in England: Science Programmes of
Study. United Kingdom Department of Education. Retrieved from
https://www.gov.uk/government/publications/national-curriculum-in-england-science-programmes-of-study/national-curriculum-in-england-science-programmes-of-study
Vekiri, I. (2002). What is the value of graphical displays in learning? Educational Psychology Review, 14(3), 261-312
Vygotsky, L. S. (1978). Mind In Society. Cambridge, MA: Harvard University Press.
White, B. Y., & Frederiksen, J. R. (1998). Inquiry, modeling, and metacognition: Making science accessible to all students. Cognition and Instruction, 16(1), 3-118
Windschitl, M., Thompson, J., & Braaten, M. (2008). Beyond the scientific method: Model-based inquiry as a new paradigm of preference for school science investigations. Science Education, 92(5), 941–967. https://doi.org/10.1002/sce.20259
Author Information
Sarah J Fick
Wake Forest University Winston-Salem NC 27109, USA Contact e-mail: [email protected]
Nancy Butler Songer Drexel University