Available online on 15.01.2019 at http://jddtonline.info
Journal of Drug Delivery and Therapeutics
Open Access to Pharmaceutical and Medical Research© 2011-18, publisher and licensee JDDT, This is an Open Access article which permits unrestricted non-commercial use, provided the original work is properly cited
Open Access
Research Article
Quality by Design based formulation and evaluation of acyclovir
microsponges
Dev Asish *1, 2, Dwivedi Jayesh 3, Momin Munira 4
1 Research scholar, Pacific University, Udaipur, Rajasthan, India
2 Assistant Professor, Oriental College of Pharmacy, Sanpada, Navi Mumbai, Maharashtra, India 3 Associate Professor, Pacific University, Udaipur, Rajasthan, India
4 Principal and Professor, Dr. Bhanuben Nanavati College of Pharmacy, Mumbai, Maharashtra, India
ABSTRACT
Objective: The proposed study is focussed at developing acyclovir microsponges for oral drug delivery systems. QbD was applied for better understanding of the process and to generate design space, using quality target product profile, critical quality attributes, and risk assessment. The aim of the experiment is to prepare a safe, efficacious, stable and patient compliant microsponge dosage form of Acyclovir. Materials and methods: Pre-formulation studies were carried out which helped in developing a suitable dosage form. UV, FTIR, DSC, and SEM studies were done for pre-formulation and post-formulation evaluations. QbD was applied to generate design space, using QTPP, CQA, and risk assessment. Microsponges of acyclovir were developed by 23 factorial designs. Three variables Drug: Polymer ratio (X1), Concentration of surfactant (X2) and Stirring speed (RPM) (X3) at two levels low and high were selected and response surface plots were generated. The microsponges were prepared by Quassi-emulsion solvent diffusion method. Various characterizations that were carried out include entrapment efficiency, percentage yield, particle size determination, in-vitro drug release studies and kinetic modelling of drug release. Statistical analyses of batches and surface response studies were done to understand the effect of various independent variables on the dependent variables. Results and Discussions: The λmax was confirmed at 251 nm by UV spectroscopy. The melting point was determined experimentally to be 2460C which confirms the drug to be Acyclovir. FTIR and DSC studies confirmed that the drug is Acyclovir. Eight trials were taken as per the by 23 factorial designs. Conclusion: The study indicates that microsponges of Acyclovir by QbD approach were successfully developed.
Keywords: Microsponge, Acyclovir, DoE, QbD
Article Info:Received 10 Nov 2018; Review Completed 20 Dec 2018; Accepted 27 Dec 2018; Available online 15 Jan 2019 Cite this article as:
Dev A, Dwivedi J, Momin M,Quality By Design based formulation and evaluation of acyclovir microsponges, Journal of Drug Delivery and Therapeutics. 2019; 9(1):54-60 DOI: http://dx.doi.org/10.22270/jddt.v9i1.2159
*Address for Correspondence:
Asish Dev,Research scholar, Pacific University, Udaipur, Rajasthan, India
INTRODUCTION
Acyclovir is a potent, specific antiviral drug which is active against herpes simplex viruses’ types I and II and varicella zoster virus1. Literature studies indicate that the oral
bioavailability of acyclovir is relatively less, which is around 20-30%. Hence there is a need for enhancement of oral bioavailability of the acyclovir drug by employing various approaches. Acyclovir is available as various dosage forms in the market which includes capsules, creams, ointments, tablets and suspension. For all oral dosage forms the limiting factor of bioavailability which is poor. In order to overcome this limitation of oral delivery of Acyclovir, attempts have to be made to develop novel drug delivery systems of the same drug. The underlying aim of the proposed investigation is to augment the oral bioavailability of acyclovir by developing a microsponge drug delivery system of acyclovir which will attempt to increase the oral bioavailability of the drug. Microsponges are spherical small structures having large void spaces where there can be entrapment of the drug.
These voids are non-collapsible; hence it is better for drug entrapment and the entrapment efficiency of microsponges would be very high. The release of the drugs from the microsponges involves the movement of the drug from these non-collapsible void spaces to outside. The presence of such void spaces may enable the micrsoponges to deliver the drug slowly over a period for prolonged time2. As such drug
delivery systems are devoid of much irritation and are capable of prolonged activity; they can enhance the patient compliance.Quality by design (QbD) is an intelligent way to bring quality into both product and process. QbD can be achieved by constructive planning of all the previous data that is accessible. Although it is based on certain amount of risks, it provides results that minimizes the risk of end product failure and enhances the chances of regulatory acceptance3. ICH Q8, ICH Q9 and ICH Q10 do explain the
fact that there can be a great deal of unpredictability in scale up of a product from research and development, although the reason for failure is not generally understood. QbD is an approach to be applied in all stages of drug discovery, production and delivery4-6.
MATERIALS AND METHODS Materials
The drug Acyclovir was obtained as gift sample from Aurobindo Pharma, Hyderabad. All other chemicals that were used in the experiment were of the analytical grade.
Methods
Pre-formulation studies
Determination of melting point of Acyclovir:
Melting point of Acyclovir was determined by open capillary method.
Determination of wavelength maxima (λmax) of Acyclovir: Determination of wavelength maxima (λmax) was done for
Acyclovir.
Preparation of calibration curve for Acyclovir:
The calibration curve of Acyclovir was plotted by taking 0.1N HCl as the solvent.
Identification of Acyclovir by FT-IR Spectroscopy: FTIR study was carried for Acyclovir.
Identification of Acyclovir by DSC Study:
The thermograph of Acyclovir was obtained by DSC.
Method of preparation of Acyclovir microsponges:
Microsponges are prepared by quasi-emulsion solvent diffusion technique. In this method external phase and internal phases are used. The internal phase is organic phase was containing drug (acyclovir), Dichloromethane, Eudragit RS100 and triethyl citrate (TEC) which is added in order to facilitate the plasticity. The external phase consisted of distilled water and polyvinyl alcohol (PVA) which acts as surfactant. Measured amounts of drug and polymer are dissolved in measured quantity of DCM. The formed solution is poured into water containing polyvinyl alcohol. Internal phase and external phases were properly mixed. This results in the solidification of the drug and its diffusion out of the liquid phases. Finally the solidified microsponges are collected by filtration. Then they are subjected to washing and drying.
Characterization of Acyclovir microsponges:
Entrapment efficiency:
Drug Encapsulation efficiency = Percentage yield:
Percentage Yield= Drug content:
Drug content is determined by using the UV Visible spectrophotometer.
Average particle size analysis:
Malvern apparatus was used for particle size analysis. In-vitro drug release study of microsponges:
Dissolution test was carried out to determine the in-vitro drug release profile of the prepared batches of
Kinetic release study was performed to find drug release mechanism from dissolution parameter by using different various kinetic model equations like Zero order, First order, Higuchi, Hixon-Crowell and Korsemeyer-Peppas model.
Risk Assessment to identify CQAs affecting drug product quality:
Risk assessments was done to select formulation and process variable which may affect product quality for CQAs by process characterization that defines satisfactory changes in material and process parameters. As a final point, this can result in quality assurance by process design space to understand and develop control strategy. Critical quality attributes were categorized into high, medium and low risk parameters based on knowledge space. Usually high-risk parameters are considered important for Design of Experiments as they are having more effect than others and need to be in accepting multivariate ranges.
Figure 1 QbD approach
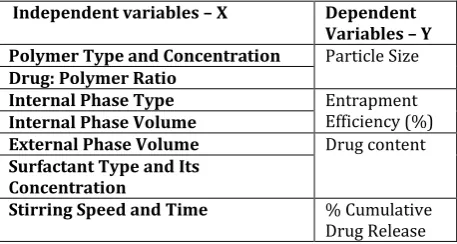
Table 1 Independent and dependent variables
Independent variables – X Dependent
Variables – Y Polymer Type and Concentration Particle Size
Drug: Polymer Ratio
Internal Phase Type Entrapment
Efficiency (%)
Internal Phase Volume
External Phase Volume Drug content
Surfactant Type and Its Concentration
Stirring Speed and Time % Cumulative
Drug Release
Design of Experimentation (DoE) of Acyclovir microsponges by using QbD approach:
A design space can signify formulation and process variables that affects attributes which are related to drug substance, materials, equipments and finished product quality. For this purpose, risk assessment was done based on understanding of process and formulation related parameters on microsponges’ quality. Preliminary studies and later Design of Experimentation (DoE) was carried out for high risk parameters. Based on effect of critical quality attributes of target product profile, design space for obtaining robust formulation was proposed.
RESULTS AND DISCUSSIONS Pre-formulation studies
Determination of melting point of Acyclovir:
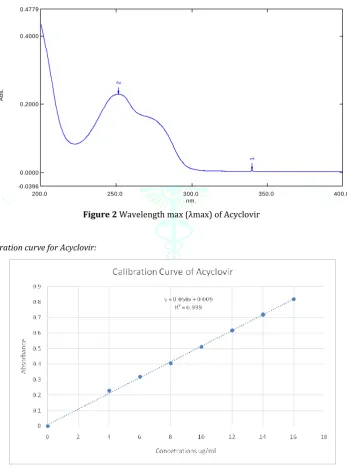
The melting point of Acyclovir was found to be 256.5 °C Determination of wavelength maxima (λmax) of Acyclovir: The wavelength maxima (λmax) of Acyclovir were found to be
251 nm.
Figure 2 Wavelength max (λmax) of Acyclovir
Preparation of calibration curve for Acyclovir:
Figure 3 Calibration curve for Acyclovir Identification of Acyclovir by FT-IR Spectroscopy:
The recorded IR spectrum of Acyclovir is shown in following figure.
nm.
200.0 250.0 300.0 350.0 400.0
A
b
s.
0.4779
0.4000
0.2000
0.0000
-0.0396
1
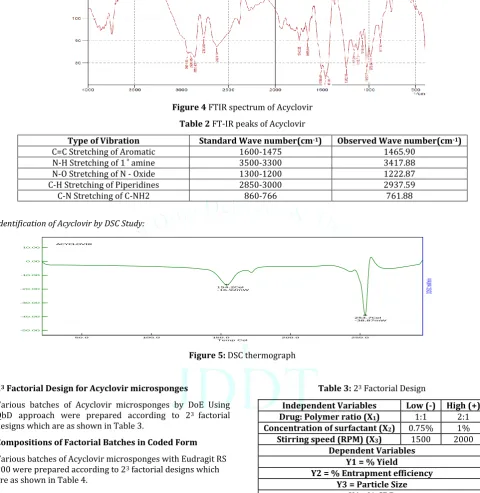
Figure 4 FTIR spectrum of Acyclovir
Table 2 FT-IR peaks of Acyclovir
Type of Vibration Standard Wave number(cm-1) Observed Wave number(cm-1)
C=C Stretching of Aromatic 1600-1475 1465.90
- tretching of amine 3500-3300 3417.88
N-O Stretching of N - Oxide 1300-1200 1222.87
C-H Stretching of Piperidines 2850-3000 2937.59
C-N Stretching of C-NH2 860-766 761.88
Identification of Acyclovir by DSC Study:
Figure 5: DSC thermograph
23 Factorial Design for Acyclovir microsponges
Various batches of Acyclovir microsponges by DoE Using QbD approach were prepared according to 23 factorial
designs which are as shown in Table 3.
Compositions of Factorial Batches in Coded Form
Various batches of Acyclovir microsponges with Eudragit RS 100 were prepared according to 23 factorial designs which
are as shown in Table 4.
Table 3: 23 Factorial Design
Independent Variables Low (-) High (+)
Drug: Polymer ratio (X1) 1:1 2:1
Concentration of surfactant (X2) 0.75% 1%
Stirring speed (RPM) (X3) 1500 2000
Dependent Variables Y1 = % Yield
Y2 = % Entrapment efficiency Y3 = Particle Size
Y4 =% CDR
Table 4: Compositions of Factorial Batches in Coded Form
23 =8 Batches
Batch No.
Variable level in coded form Drug: Polymer Ratio
(X1) Concentration of surfactant (X2) Stirring speed (RPM) (X3)
1 -1 -1 -1
2 +1 -1 -1
3 -1 +1 -1
4 +1 +1 -1
5 -1 -1 +1
Temp Cel
250.0 200.0
150.0 100.0
50.0
DSC
mW
10.00
0.00
-10.00
-20.00
-30.00
-40.00
-50.00
DD
SC
mW
/min
154.2Cel -16.92mW
Formulation Design by 23 Factorial Design
Table 5: Formulation Design by 23 Factorial Designs
Batch Drug: Polymer Ratio
(X1) Concentration of surfactant (X2) Stirring speed (RPM) (X3)
ACVMS1 1:1 0.75 1500
ACVMS2 2:1 0.75 1500
ACVMS3 1:1 1 1500
ACVMS4 2:1 1 1500
ACVMS5 1:1 0.75 2000
ACVMS6 2:1 0.75 2000
ACVMS7 1:1 1 2000
ACVMS8 2:1 1 2000
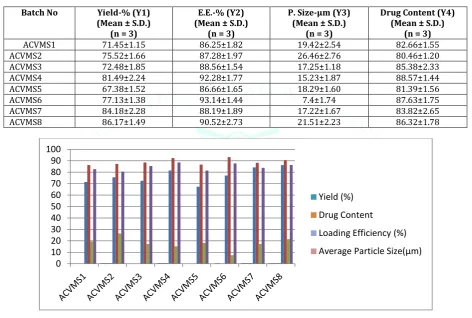
Characterization of Acyclovir microsponges:
Table 6 Characterization of Batches ACVMS1- ACVMS8
Batch No Yield-% (Y1)
(Mean ± S.D.) (n = 3)
E.E.-% (Y2) (Mean ± S.D.)
(n = 3)
P. Size-μm (Y3) (Mean ± S.D.)
(n = 3)
Drug Content (Y4) (Mean ± S.D.)
(n = 3)
ACVMS1 71.45±1.15 86.25±1.82 19.42±2.54 82.66±1.55
ACVMS2 75.52±1.66 87.28±1.97 26.46±2.76 80.46±1.20
ACVMS3 72.48±1.85 88.56±1.54 17.25±1.18 85.38±2.33
ACVMS4 81.49±2.24 92.28±1.77 15.23±1.87 88.57±1.44
ACVMS5 67.38±1.52 86.66±1.65 18.29±1.60 81.39±1.56
ACVMS6 77.13±1.38 93.14±1.44 7.4±1.74 87.63±1.75
ACVMS7 84.18±2.28 88.19±1.89 17.22±1.67 83.82±2.65
ACVMS8 86.17±1.49 90.52±2.73 21.51±2.23 86.32±1.78
Figure 6: Characterization of Batches ACVMS1 – ACVMS8
% Cumulative Drug Release profile of batches ACVMS1- ACVMS8
Table 7: % Cumulative Drug Release profile of Batches ACVMS1 – ACVMS4
Time (Mean ± SD) ACVMS1 (n=3)
ACVMS2 (Mean ± SD)
(n=3)
ACVMS3 (Mean ± SD)
(n=3)
ACVMS4 (Mean ± SD)
(n=3)
0 0 0 0 0
1 28.01±1.13 14.18±1.78 15.16±1.45 21.25±1.49
2 37.81±1.74 18.21±1.46 17.30±1.17 27.81±1.65
3 44.95±1.56 26.84±1.29 22.85±1.59 36.38±1.37
4 56.25±1.93 32.59±1.66 31.37±1.17 46.90±1.58
5 63.45±1.63 43.20±1.52 42.61±1.79 51.48±1.48
6 76.11±1.28 54.01±1.68 53.33±1.62 66.37±1.75
7 85.26±1.82 65.01±1.84 66.08±1.28 81.42±1.81
8 90.32±1.25 78.06±1.94 75.91±1.56 88.96±1.26
0 10 20 30 40 50 60 70 80 90 100
Yield (%)
Drug Content
Loading Efficiency (%)
Figure 7:% Cumulative Drug Release profile of Batches ACVMS1 – ACVMS4
Table 8: % Cumulative Drug Release profile of Batches ACVMS5 – ACVMS8
Time (Mean ± SD) ACVMS5 (n=3)
ACVMS6 (Mean ± SD)
(n=3)
ACVMS7 (Mean ± SD)
(n=3)
ACVMS8 (Mean ± SD)
(n=3)
0 0 0 0 0
1 16.33±1.17 28.01±1.87 21.73±1.54 17.88±1.93
2 21.44±1.67 37.84±1.64 30.35±1.71 26.45±1.56
3 31.76±1.65 44.95±1.92 46.31±1.95 36.97±1.76
4 40.67±1.39 56.25±1.66 56.34±1.62 38.72±1.82
5 51.18±1.36 63.45±1.25 61.80±1.48 60.95±1.19
6 61.48±1.82 76.11±1.86 71.82±1.26 73.38±1.17
7 74.94±1.28 85.26±1.48 84.87±1.82 84.87±1.42
8 85.55±1.52 90.32±1.49 93.24±1.65 91.74±1.62
Figure 8: Cumulative Drug Release profile of Batches ACVMS5 – ACVMS8
Table 9: Release Kinetic of BatchesACVMS1 – ACVMS4
Model Parameter ACVMS1 ACVMS2 ACVMS3 ACVMS4
Zero Order R2 0.9468 0.9829 0.9609 0.9733
Slope 10.299 8.4804 8.2129 10.202
Intercept 11.45 2.4204 2.0214 5.7064
First Order R2 0.9688 0.9654 0.9338 0.9673
Slope -0.0956 -0.0532 -0.0513 -0.073
Intercept 1.9886 2.0048 2.0067 1.9988
Higuchi Model R2 0.9856 0.9899 0.9859 0.9865
Slope 30.03 21.123 20.267 25.136
Intercept - 1.8141 - 4.825 - 4.7016 - 6.3716
Hixon Crowell R2 0.9757 0.9752 0.9462 0.9775
Slope 0.2699 0.1669 0.1611 0.2183
Intercept 0.0997 0.0055 - 0.0014 0.042
Korsmeyerpe
ppas equation R
2 0.8786 0.8938 0.8432 0.9089
Slope 74.833 54.858 52.188 66.878
0 20 40 60 80 100
0 2 4 6 8 10
%C
D
R
Time (hrs)
Release profiles of ACVMS1-ACVMS4
ACVMS1
ACVMS2
ACVMS3
ACVMS4
0 20 40 60 80 100
0 2 4 6 8 10
%C
D
R
Time (hrs)
Release profile of ACVMS5-ACVMS8
ACVMS5
ACVMS6
ACVMS7
Table 10: Release Kinetic of BatchesACVMS5 – ACVMS8
Model Parameter ACVMS5 ACVMS6 ACVMS7 ACVMS8
Zero
Order R
2 0.9867 0.9467 0.97 0.9679
Slope 10.049 11.451 11.735 11.413
Intercept 2.1189 10.306 6.5582 2.8125
First
Order R
2 0.964 0.9688 0.9935 0.9103
Slope -0.0687 -0.0956 -0.0915 -0.0889
Intercept 2.0155 1.9886 2.0019 2.03
Higuchi
Model R
2 0.9968 0.9856 0.9938 0.9827
Slope 24.896 30.029 30.221 28.326
Intercept - 6.2585 - 1.8083 - 5.0004 - 6.7818
Hixon
Crowell R
2 0.9767 0.9757 0.9934 0.9386
Slope 0.2089 0.2699 0.2651 0.2573
Intercept - 0.0177 0.0999 0.0439 - 0.0387
Korsmeye rpeppas equation
R2 0.899 0.8785 0.9429 0.8798
Slope 65.068 74.827 78.487 73.807
Intercept 5.7057 14.115 9.7267 6.9227
Statistical analysis of batches ACVMS1- ACVMS8
In factorial design, amount of drug (ACV): polymer (Eudragit RS100) ratio (X1), amount of PVA Concentration (X2), and Stirring Speed (X3) were taken as independent variables. % Yield (Y1), % E. E (Y2). Particle sizes (Y3), % CDR (Y4) were selected as dependent variables.
Effect on % Yield (Y1) - Surface Response Study Y1 (%Yield) = 77.73 + 5.52*X1 + 1.44 *X2 – 2.86*X3
Positive value for coefficient of X1 in equation indicates Increase in yield with Drug Concentration. Positive value of coefficient of X2 PVA concentration indicates increase in response of Y1 i.e. % yield. Negative value of coefficient X3, time indicates decrease in yield.
Effect on % Entrapment Efficiency (Y2) - Surface Response Study
Entrapment Efficiency (Y2) =
84.75 + 0.875 * X1 + 0.55 * X2 + 1.05 * X3
Positive value for coefficient of X1 in equation indicates increase in Entrapment Efficiency with Drug Concentration. Positive value of coefficient of X2 PVA concentration indicates increase in response of Y2 i.e. % E.E. Positive value of coefficient X3, time indicates increase in yield.
Effect on Particle Size (Y3) - Surface Response Study P.S. (Y3) = 18.85 – 2.51 * X1 + 2.26 * X2 – 3.31 * X3
Negative value for coefficient of X1 in equation indicates decrease in particle Size with Drug Concentration. Positive value of coefficient of X2 PVA concentration indicates increase in response of Y3 i.e. P.S. Negative value of coefficient X3, time indicates decrease in Particle size.
Effect on % CDR (Y4) - Surface Response Study
%CDR (Y4) = 87.03 + 4.54 * X1 - 2.86 * X2 – 0.84 * X3
Positive value for coefficient of X1 in equation indicates Increase in CDR with Drug Concentration. Negative value of coefficient of X2 PVA concentration indicates decrease in response of Y4 i.e. % CDR. Negative value of coefficient X3, time indicates decrease in CDR.
CONCLUSION
The focus of the current study was to develop microsponge drug delivery system of acyclovir using QbD approach. . Literature studies indicate that the oral bioavailability of
acyclovir is relatively less, which is around 20-30%. The underlying objective of the proposed investigation is to augment the oral bioavailability of acyclovir by developing a microsponge drug delivery system of acyclovir. Pre-formulation studies were carried out which helped in developing a suitable dosage form. UV, FTIR, DSC, and SEM studies were done for pre-formulation and post-formulation evaluations. QbD was applied to generate design space, using QTPP, CQA, and risk assessment. Microsponges of acyclovir were developed by 23 factorial designs. Three variables
Drug: Polymer ratio (X1), Concentration of surfactant (X2)
and Stirring speed (RPM) (X3) at two levels low and high
were selected and response surface plots were generated. The microsponges were prepared by Quassi-emulsion solvent diffusion method. Various characterizations that were carried out include entrapment efficiency, percentage yield, particle size determination, in-vitro drug release studies and kinetic modeling of drug release. Statistical analyses of batches and surface response studies were done to understand the effect of various independent variables on the dependent variables. Lastly it was concluded that microsponges of Acyclovir using QbD approach were successfully developed.
REFERENCES
1. Shishu, Rajan S, Kamalpreet, Development of Novel Microemulsion-Based Topical Formulations of Acyclovir for the Treatment of Cutaneous Herpetic Infections, AAPS PharmSciTech, 2009; (10)2:559-565.
2. Lembhe S, Dev A, Design Development And Evaluation Of Mesalamine Loaded Microsponge Compressed Into Tablet For Colon, World Journal Of Pharmacy And Pharmaceutical Sciences, 2016; 5(7):1235-1266.
3. Desai PM, Er PX, Liew CV, Heng PW. Functionality of disintegrants and their mixtures in enabling fast disintegration of tablets by a quality by design approach. AAPS PharmSciTech 2014; 15:1093-104.
4. Chodankar R, Dev A, Optimisaton techniques: a futuristic approach for formulating and processing of pharmaceuticals, Indian J. Pharm. Biol. Res. 2016; 4(2):32-40.
5. Kharat P, Pujari R. Design and statistical optimization of antacid and analgesic effervescent tablet by using factorial design. Int J Pharm Sci 2014; 6:211-214.