Automatic Extraction of the Building Rectilinear
Rooftops Based on
Region over Growing
Min Qi, Jiankui Jia
School of electronics and information, Northwestern Polytechnical University, Xi’an,P.R. China [email protected], [email protected]
Yuelei Xu
Aeronautics and Astronautics Engineering college, Air Force Engineering University, Xi’an, P.R. China [email protected]
Ke Li
School of automation, Northwestern Polytechnical University, Xi’an, P.R. China [email protected]
Abstract—Extracting the building rooftops from the satellite image has been an active research subject with a wide range of applications. However, most of previous approaches have some drawbacks: being sensitive to initial seed points which are defined by the operator according to his experiences; threshold selection is also finished by such interactive works; unexpected results for color image; needing extra data source. In order to solve those problems, this paper proposes an automatic approach that extracts building rooftops from a single satellite image, and furthermore makes the rooftops be of rectilinear contour in order to supply modeling data for 3-D building reconstruction. Firstly, an automatic method is proposed to obtain the initial seed points for the region growing method. Secondly, by over growing strategy aided with Canny edge map, the building areas can be departed from the non-building areas avoiding the difficulty of threshold selection. Thirdly, the rooftops are later refined and fitted by a block operation algorithm to get the rectilinear boundaries, and then the rectilinear contours are extracted by boundary tracking. It shows the quick and considerably precise results, and the tree occlusion problem is also solved in a degree.
Index Terms—building extraction, region growing, rectilinear fitting, satellite images
I. INTRODUCTION
Three-dimensional building reconstruction from the satellite image constitutes a key element in numerous geospatial applications including earthquake resistance, urban environmental planning, and military simulations. As a foundation of 3-D building reconstruction, the building rooftop extraction plays an essential role in supplying 3-D modeling data and determining the layout of building groups. However, most approaches have to get some necessary parameters by interactive ways according to operator’s work experiences. Such as initial seed points, threshold, etc. Only a limited number of automated systems are reported in literatures. Besides, some of those works present limited good results for their
images, and are difficult to apply to other test images. The purpose of this paper is to automatically detect the buildings with flat or flat-looking polygonal rooftops from a single satellite image of high resolution, then extract the rooftops and fit their boundaries with rectilinear contours for the 3-D building reconstruction aim.
Previous approaches for solving the problem of building extraction are various based on curve evolution, template model of buildings, and extra input resources such as LIDAR[1] or stereo vision images[2]. Kabolizade
et al.[3] improved the gradient vector flow (GVF) snake
model in an automatic building extraction, which is also based on the radiometric and geometric behaviors of buildings. The initial seed selection was implemented by looking for local maximum DSM model created from light detection and range (LiDAR) data. Li et al.[4]
developed an automatic system that combines region growing, rectangular templates and snakes. By emerging strength of energy-based method with the distinctive corner detection, Melissa Cote et al.[5] obtained the
building rooftop outline , then refine the boundary contour through the level set curve evolution method. Bailloeul et al.[6] introduced a system for building
recognition using specific geometrical information derived from prior knowledge of building models combined with active contours models. Zhang yu et al.[7]
made a progress compared with traditional semiautomatic building extraction, the buildings were detected relied on the geometric constraints after the image segmentation. Tian hao et al.[8] proposed a prior shape-constraint
variation level-set model. The method introduced multiple prior shape models to the level set approach, and utilize the prior shape energy controlling the curve evolution under the help of mark function.
relationships with each other using a graph-based search to establish a set of rooftop hypotheses. The shortage is that the time complexity of the implemented system will be huge when the number of sides increase small, what’s more, the methods only works for the satellite image whose resolution is more than 0.6 meter/pixel. Zhang Guifang et al.[10] proposed a point growing algorithm to
extract building, with the threshold needs to be set by hand. Taejung Kim et al.[11] developed a semi-automatic
building extraction system with manually choosing two corners. When there exits numerous buildings in image, the cost will become expensive and efficiency will be lower.
Most of previous approaches have some drawbacks: snake model demands the initial contour must be close to the building; Level set method and snake model were both studied for the panchromatic or grayscale image, when applied on color image, the method will get an unexpected results; DSM and LIDAR needs additional data sources increasing the computational cost. Furthermore, these methods are subject to inaccuracies caused by occlusion and illumination variation. The work in this paper aims for automatic extraction and rectilinear fitting of the buildings with flat or flat-looking roofs in a single satellite image. We presented an improved method to solve the two exist problems of region growing method: the selection of initial seed points and growing threshold value. The proposed system includes two main parts: building rooftops detection and its’ shape fitting. The first part includes the initial seed points auto selection, rectangular template comparison, and region over growing strategy. The second part uses Hough transform technology and the block processing method to do the rectilinear fitting of the building rooftops boundary, and final get the rectilinear contours. It includes six steps: Firstly, we use the K-means clustering method segment the original image, and obtain the buildings cluster, whose centroids are considered as the initial seed points. Secondly, some non-building areas are dropped a series of processing, and the initial seed points are updated at the same time. Thirdly, the region growing method is implemented in Lab color space with the initial seed points and a larger threshold equals 10, in which the judge function is Euclidean distance. Fourthly, we split the building area by subtracting the Canny edge image, and refine the building regions comparing with the rectangular template. Finally, we make a rectilinear fitting of the building rooftops boundary using a block processing algorithm and then get the rectilinear contours.
II. BUILDING ROOFTOPS DETECTION
USING REGION OVER GROWING STRATEGY
A. Automatic Selection of Initial Seed Points
Before the initial seed selection, the input image is low-pass filtered to smooth out the noise. The paper uses a Gaussian smoothing with a standard deviation of σ=0.7 and a kernel size of 9 × 9 pixels.
2
2 2
2 2 2
1 ) ,
( σ
πσ
y x
e y
x g
+ −
⋅
= (1)
Where x is the distance from the origin in the
horizontal axis, y is the distance from the origin in the
vertical axis, and σ is the standard deviation of the Gaussian distribution. As a result, the black holes or small object on the rooftops will be removed to make that the building rooftop become the homogeneity regions.
The smoothed image is then transformed into the Lab color space to make the color and brightness information independent from each other. A K-means clustering algorithm is applied on the a&b components:
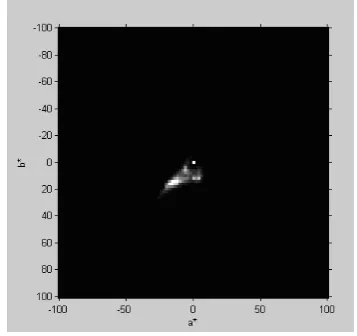
Step1: Randomly place k points into the a&b color space of image pixels, where k equals the numbers of a&b histogram peaks and these points represent initial group centroids. Fig.1 shows the histogram of the a&b components of the image.
Step2: Assign each pixel of image to the group that has the closest distance from centroid.
Step3: When all pixels have been assigned, recalculate the positions of the k centroids.
Step4: Repeat steps 2 and step3 until the centroids no longer move.
Step5: Run the above algorithm multiple times (in our paper is 5) with random starting points to solve the k-means inherent defects of being sensitive to the initial centroids.
Step6: Select the result which has the minimum total sum of distances as the final k-means segmentation.
K-means segmentation partitions the image pixels (a&b components) into k clusters through an iterative scheme, which minimizes the sum of the intra-clusters distances between pixels and cluster centroids for each cluster.
Figure 1. Histogram of the a&b components of the image
blocks with the similar color as buildings are assigned to the building clusters. Here we mark the cluster with building region as the image Iseg.
Then, the image Iseg experience a series of processing
to obtain meaningful images that represent building regions, including binarization, media filter, open/close operation and discarding small area processing.
• Binarization. Translate the image Iseg to binary image
for the next step.
• Morphological cleaning. Implement morphological opening operation with a squared structural element of 5*5 pixels on the binary image to remove very small or narrow objects and isolated pixels.
• Removing the connected region too large or too small. Calculate the area of each connected region and abandon the area smaller than s_area or larger than l_area. The
target is mainly for the car roof and the ground.
After these processing, the candidate building regions
Iseg are maintained. We label these building regions with
number, and record their centroids as the initial seed points group SPG.
B. Avoid Threshold Selection Utilizing Image Boundary
As the threshold for each candidate building region is different, we proposed a valid solution for solving the problem. The procedure is as follows:
•With the judge function equals to the Euclidean distance in Lab color space, the initial seed points and threshold large enough, the region over growing method is applied on original image. Specific steps are as follows:
Step1: Firstly we create a whole black output image Iout as the same size as original image Iorig and set a growth
threshold thresh large enough, here we set the value 8-10
pixels.
Step2: Select one initial seed point (xk, yk) from the
SPG as current seed point and set Iout(xk, yk)=1, where k is
the Building Number.
Step3: With (xk, yk) as the center, every neighbour pixel
is tested for Euclidean distance between its color and color of the current seed point in Lab color space. The judge function shows as follows:
2 2
2 ( ( , ) ) ( ( , ) )
) ) , ( ( ) ,
(xy Lxy Lseed axy aseed bxy bseed
d = − + − + − (2)
Where L(x, y), a(x, y), b(x, y) represent the L, a, b
component of test pixel (x, y), and Lseed,aseed, bseed stand for the L, a, b component of current seed point.
If the test pixel satisfies Iout(x, y)=0 and d(x, y)<thresh,
the value of Iout(x, y) will be set to 1 and test pixel (x, y)
will be pushed into a STACK.
Step4: Pop a pixel from STACK as the current seed point and continue step 3.The algorithm has grown the region until the stack become empty. After this step, a building region is generated around the initial seed point.
Step5: Go back to the step 2, locating next initial seed and repeat step3 and step4 until initial seed group SPG
become empty. During process, the threshold and neighborhoods selecting keeps the same.
The result shows a certain number of candidate building regions BRg larger than what they should be.
•Strong Canny edges detection are applied on original image, and each candidate building region is split into blobs where strong Canny edges are present , which is done by dilating the edge map by a circular structuring element (radius of 2 pixels) and then setting all the dilated edge points to 0 in the candidate building regions
BRg. After that, the candidate building regions BRg
shows a series of building regions with many small blobs. •In the paper, we supposed rectangle is the basic shape of the complex buildings and use two shape parameters to describe the rectangular buildings. They are rectangle degree d and the rate r of length to width respectively,
defined as follows.
e A
A d= ,
w h
r= (3)
Where, A is the area of the candidate building region, Ae, h, w are the area, height, width of the bounding box
respectively.
For the building region, the two shape parameters must satisfy rules “ d>0.6, r<5 ”. So every blob is subjected to
individual processing by comparing the above two shape parameters, if the blob satisfy the rules, it will be retained, otherwise it will be discarded.
Above procedures extracts the irregular building boundaries from the satellite image, and the pixels around building boundary shows many jagged shape, which makes the follow-up work three-dimensional modeling be hugely time consuming. Therefore, we should make the line fitting for the marginal pixels to reduce the amount of data in future.
III. ROOFTOPS SHAPE FITTING
The traditional line fitting usually link edge pixels together into lists of sequential edge points, and then takes the least squares line fitting with the points in the list, in which a variable tolerance is defined as the maximum deviation from straight line. If the maximum deviation exceeds the allowable tolerance, the detected line will break down to line segments. That method has two shortages:
• The result varies depends on the threshold selection. • Because different region corresponds to different threshold, the result will be bad when apply to the image exist many building with the same threshold value.
In this paper, we assume that the building has the rectilinear or square rooftop, where also include the prominent balconies and windows. So the building rooftops can be described as the compositions of straight lines that meet at 90-degree angles. Here we proposed a rectilinear fitting method using the Hough line detection and the block processing algorithm. The method can complete building boundary rectilinear fitting without the threshold selection:
Firstly, we create a two dimensional accumulator
) , (θ ρ
H and Initialize H to all zeros, where θ from 0 to
180 andρ=xcosθ+ysinθ . Then a Hough transform algorithm is implemented as follows:
finish.
Step2: Update the accumulator with a single pixel randomly selected from the input image Iout.
Step3: Remove pixel from input image Iout.
Step4: Check if the highest peak in the accumulator that was modified by the new pixel is higher than threshold l (e.g. l =80). If not, then go to step1.
Step5: Look along a corridor specified by the peak in the accumulator, and find the longest segment of pixels either continuous or exhibiting a gap not exceeding a given threshold maxgap (e.g. maxgap =10).
Step6: Remove the pixels in the segment from input image.
Step7: Unvote from the accumulator all the pixels from the line that have previously voted.
Step8: If the line segment is longer than the minimum length minlegth (e.g. minlegth=20), add it into the output
list.
Step9: Go to step1.
The domain line of the building boundary is detected using above algorithm, where the roof dominant line is defined as the longest detected line.
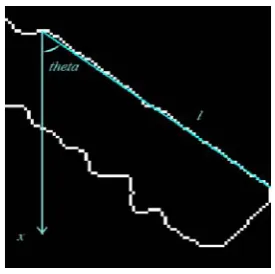
Before the roof rectilinear fitting, the building region with dominant line unparallel to x axis or y axis,
including the roof dominant line, will be rotated to the vertical or level. Fixed one point of domain line, the building region will be rotated to vertical if its domain line satisfy |cos(theta)|>=cos(45°), while the region will
be rotated to level when its domain line satisfy |cos(theta)|<=cos(45°), where theta represent the angle
between building domain line and the x axis. Here
presents the Coordinate transformation equations with formula (2) corresponds to |cos(theta)|>=cos (45° ) and
formula (3) corresponds to cos(theta)|<=cos(45°) :
h theta g i theta h j y g theta g i theta h j x + ⋅ − − − = + ⋅ − + − = ) sin( ) ( ) cos( ) ( ) cos( ) ( ) sin( ) ( (4) h theta g i theta h j y g theta g i theta h j x + ⋅ − − − = + ⋅ − + − = ) cos( ) ( ) sin( ) ( ) sin( ) ( ) cos( ) ( (5)
Where, (x, y) represents new coordinate of each pixels
in building region, (i, j) represents original coordinate of
each pixels in building region. theta is the rotation angle,
(g, h) is the old coordinates of the fixed point .
Figure 2. The angle theta between domain line l and x axis
Secondly, all lines parallel and perpendicular to the dominant line segment the building region to many
blocks with equal spacing (Fig.3), each block has 5*3 pixels, namely unit. The orthogonally crossed lines will create a series of rectangular blocks aligning with the edges of the building.
Figure 3. The building region divided by unit, bold black curve shows the irregular building boundary. Thirdly, traverse each unit in Fig.4, calculating the rate
Pertg of building area to unit area respectively, the Pertg
defined as follows:
mask building
Area Area
Pertg = (6)
Where Areabuilding is the building area in the unit and Areabuilding is the unit area, in which the area stands for the
number of pixels.
For each unit, when the Pertg larger than a specified
percentage (e.g., 45 percent), the unit will be filled with white color (stands for the building). Otherwise, the unit will be filled with background color. Finally the building region is rotated back to where it was.
After processing the entire unit, we get the building areas composed of entirely of orthogonal edge. Finally, the rectilinear contours of rooftops are obtained by boundary tracking.
IV. RESULTS AND DISCUSSION
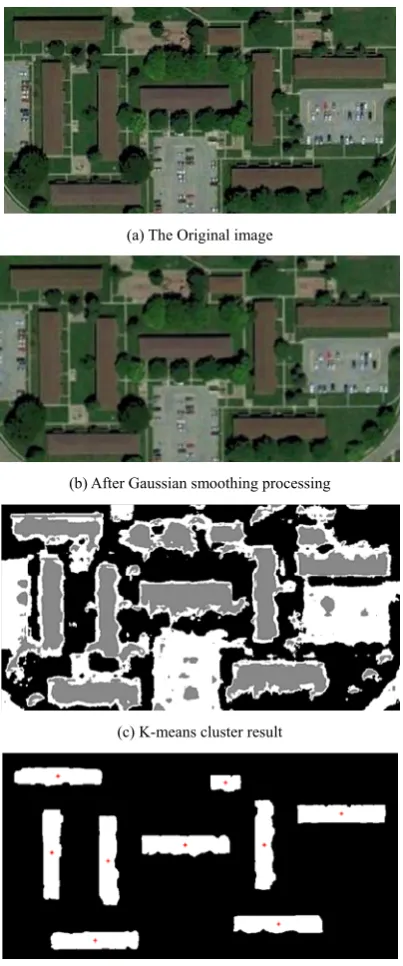
A true color satellite image of Purdue University is chosen for our experiment. Fig. 4(a) shows the original color image. Fig. 4(b) is the result after Gaussian smoothing processing, in which the building rooftops textures become more homogenized. This phase is to provide a smooth image so that the whole building regions can be extracted in the next phase. Fig. 4(c) presents K-means cluster result with three colors for different regions, where gray color region stands for the building regions. We can see that some ground blocks and cars with the similar color as buildings are also assigned to the building regions at this phase. The Fig. 4(d) shows the automatic selection result of initial seed points by cross marks. Fig. 4(e) represents the building extraction using the improved region growing method, or over growing method, in which some building regions are occluded by trees. Fig. 4(f) shows the building regions after rectilinear fitting of the building rooftops. Fig. 4(g) shows the extracted rectilinear contours of rooftops by boundary tracking. As a comparison, the least squares line fitting is done. Fig. 4(h) shows the building boundaries obtained by least squares line fitting method with tol=2 pixel, where tol represent Maximum deviation
boundaries processed by least squares line fitting method with tol=3 pixel.
Comparing Fig. 4(g) with Fig. 4(h), we can see the contours of building rooftops in Fig. 4(g) are much more precise than those in Fig. 4(h). In the Figure 4(h), the border of the buildings is not a straight line but some line segments, which cannot represents the real buildings outline and will be huge computational cost when applied to 3D modeling. While in Figure 4(i), the border is the straight line, but some buildings appear distortions around their corners, where they should be right angles. Compared with the (h), (i), the result obtained by our method shows a building contour with both right angle corners and straight lines for each border. It demonstrates that our method has a big advantage.
(a) The Original image
(b) After Gaussian smoothing processing
(c) K-means cluster result
(d) The automatic selection result of initial seed points
(e) The building regions extracted by over growth method
(f) The building regions after rectilinear fitting
(g) The rectilinear contours of building rooftops
(h) The least squares line fitting with tol=2
(i) The least squares line fitting with tol=3
Figure 4. Experimental results
V. CONCLUSION
In this paper, we present an automatic building rooftops extraction method and fit their boundaries with rectilinear contours. Firstly, we propose an automatic seed extraction technology, and separate the buildings from its Surrounding objects with the help of region over growing strategy. The buildings contours are extracted without the selection of threshold value which is necessary in traditional region growing method. Finally, a shape fitting algorithm is applied to the buildings contour. With Hough transform detecting the domain line and block processing technique fitting line, the buildings contour are refined avoiding the threshold selection needed in traditional fitting algorithm. The proposed method aims to quickly and precisely extract the building contours from a single satellite image, and the buildings, commonly exits in the real world, are composed of line structure. Our method can be widely used in the 3-D modeling and virtual simulations fields related with urban environmental.
ACKNOWLEDGMENT
The authors would like to thank for the support by Northwestern Polytechnical University project “Postgraduate Business Seed Foundation (Z2013080)”
REFERENCES
[1] W. H. Li, H. Y. Ni, H. Y. Li, Y. Wang, B. Fu, Y. F. Lin, and P. X. Liu, “An interactive segmentation method of LiDAR data.” Journal of Computers, Vol. 8, NO.3, 2013,
pp. 811-817.
[2] J. Bi, “A novel thinning algorithm of 3d image model
based on spatial wavelet interpolation” Journal of
Computers, Vol. 8, NO.11 2013, pp. 3012-3019.
[3] M. Cote and P. Saeedi, “Automatic rooftop extraction in nadir aerial imagery of suburban regions using corners and variational level set evolution”, IEEE Trans. Geosci.
Remote Sens. J., Vol. 51, NO.1, 2013, pp.313-328. DOI:
10.1109/TGRS.2012.2200689.
[4] M. Izadi and P. Saeedi, “Three-dimensional polygonal building model estimation from single satellite images”,
IEEE Trans. Geosci. Remote Sens. J., Vol.50, NO.6,2012,
2254-2272. DOI: 10.1109/TGRS.2011.2172995.
[5] K. Mostafa, H. EBadi and S. Ahmadi, “An improved snake model for automatic extraction of buildings from urban aerial images and LiDAR data”. Computers, Environment
and Urb. J., Vol.34, NO.5, 2010, pp. 435 - 441. DOI:
10.1016/j.compenvurbsys.2010.04.006.
[6] G.Li, Y.C,Wan and C.H. Chen, “Automatic building
extraction based on region growing, mutual information
match and snake model”, In: Proc. of Information
Computing and Applications, International Conference,
ICICA. Tangshan, China, October 15-18, 2010, Springer Berlin Heidelberg: 476-483.
[7] K. Taejung, T. Javzandulam and L.Tae-yoon,
“Semiautomatic reconstruction of building height and footprints from single satellite images”, In: Proc. of IEEE International Geoscience and Remote Sensing Symposium,
Barcelona, Spain, June 23,2007-June 28,2007, Institute of Electrical and Electronics Engineers Inc., United States: 4737-4740.
[8] B. Timothée, P. Veronique, S. Bruno et al., “Spatio-
temporal prior shape constraint for level set segmentation”,
In: Proc. of Energy Minimization Methods in Computer
Vision and Pattern Recognition, 5th International
Workshop, EMMCVPR 2005, St. Augustine, FL, USA, November 9-11, 2005.,Springer Berlin Heidelberg: 503-519.
[9] H. Tian, J. Yang and Y. M. Wang, “Towards automatic building extraction: variational level set model using prior
shape knowledge”, ACTA Automatica Sinica. J.,
NO.11,2010,pp:1502-1511.DOI:10.3724/SP.J.1004.2010.0 1502.
[10]G. F. Zhang, X. J. Shan and J. Y. Yin, “The method to extract urban buildings’ height and location from single high resolution aerial imagery. Seismology and geology. J.,
Vol.29, NO.1, 2007, pp. 180-187.
[11]Y. Zhang, Z. X. Zhang and J. Q. Zhang, “House
semi-automatic extraction based on integration of geometrical constraints and image segmentation”, Journal of Wuhan Technical University of Surveying and Mapping
(Wtusm). J., Vol.25, NO.3, 2000, pp. 238-242.
Min Qi got Ph.D in systems engineering, Northwestern
Polytechnical University in 2000. The research interests include image processing, pattern recognition and virtual reality.
She is the associate professor in signal and information processing, school of electronics and information, Northwestern Polytechnical University, and published the book Introduction
to Pattern Recognition (Beijing, China: Tsinghua University
Press, 2009) .
Dr. Qi is the secretary-general and executive member of the council, Shaanxi Society of Image and Graphics, P. R. China. The member of the technical committee of Virtual Reality and Visualization Technology, China Computer Federation.
Jiankui Jia was born in 1988. Since 2011, He has been working on the Master degree in school of electronics and information, Northwestern Polytechnical University, Xi’an, shaanxi province, P. R. China. His research interests include image processing and virtual reality.
Yuelei Xu is an associate professor. He gotPh.D. in June 2005. His research interests include pattern recognition and intelligent information processing.
Ke Li was born in 1993. Since 2011, she is the undergraduate
student in the school of automation, Northwestern Polytechnical University, Xi’an, P.R. China