e- ISSN: 2278-067X, p-ISSN: 2278-800X, www.ijerd.com
Volume 15, Issue 4 (April 2019), PP.52-58
Influence of Processing Parameters on the Performances of High
Pressure Die Casting Process
Jozić S
1, Bajić D
1, Dumanić I
11Department of mechanical engineering technology, Faculty of Electrical Engineering, Mechanical Engineering
and Naval Architecture, Split, CROATIA Corresponding Author:Jozić S
ABSTRACT: This paper presents an approach to determine the influence of processing parameters on the quality of aluminum alloy castings. The casting process considered is a high-pressure casting process used to produce complex shapes in light alloys. The combination of design of experiments and computer-aided casting simulation techniques allow the casting process to be evaluated and help to optimize input process parameters faster. A simulation of casting process, according to the Taguchi method based on L9 orthogonal array, was performed.The output process variables were material shrinkage and cycle time. These values were obtained at the end of the simulation process. Grey relational analysis and analysis of variance were performed. Analysis of variance results show that pressure in the 3rd phase and mould temperature have the most significant influence on the material shrinkage and cycle time.
--- --- Date of Submission: 15-12-2019 Date of Acceptance: 27-12-2019 --- ---
I.
INTRODUCTION
Casting is a process in which molten metal flows by gravity or other force into a mould where it solidifies in the shape of the mould cavity. The term casting is also applied to the part that is made by this process. The principle of casting seems to be quite simple: melting the metal, pouring it into a mould, and then cooling and solidification. There are many factors and variables in this process that must be considered in order to accomplish a successful casting operation. High pressure die casting (HPDC) is a manufacturing process in which the molten metal is forced at high pressure and relatively high speed into a steel mould or die to form products. The high pressure casting machine is a complex assembly of various parts aimed to obtaining the highest quality casting. Each part has its own task, and in order to get a good casting, everyone has to act together. The casting process is done via a single cylinder (chamber) into which the molten metal is fed. The cylinder is closed on one side by a movable pressure piston. On the other side of the cylinder there is a channel that leads the molten metal into the mould. The pressure force is transmitted by hydraulic means from high-pressure pumps to the drive piston, which with the high-pressure piston forms one unit. By moving the high-pressure piston in the chamber, the melt is pushed into the mould cavity. After cooling, the mould is opened and the casting is separated from the mould by the ejector and removed with the appropriate tool. The casting cycle is repeated by closing the mould.
Depending on the metal being used, the injection unit that fills the mould can either be hot chamber or cold chamber. In hot chamber die casting, the metal is held within the die casting machine itself, then drawn into the chamber and forced into the mould by the injection piston. These parts of the machine are in constant contact with the molten metal.
In cold chamber process, the metal is first melted in a separate furnace and transferred to a holding furnace, then poured into a shot sleeve and injected into the mould.
HPDC process has a large number of parameters that may affect the quality of the casting and optimization of the process is essential. Researchers have attempted to model the complex die casting process and studied the influence of various parameters on the quality of cast product.
when design die for high-pressure die casting aluminum. Mousavi Anijdan et al. [5] used genetic algorithm (GA) methods to determine the optimum conditions leading to minimum porosity in aluminum alloy die casting. Tsoukalas [6, 7] used the design of experiments (DOE) and genetic algorithm (GA) methods to determine the optimum conditions leading to minimum porosity in aluminum alloy die castings.
This paper presents approach for determining the optimal high-pressure die casting parameters by means of experiments performed in virtual environment using NovaFlow&Solid software. This special program designed for casting simulations is based on the control volume mesh technology and enables the very fast and reliable precise generation of the results. No need for empirical tests, less material waste and improved quality are also some of the benefits of usage of this software.
II.
DETERMINING OF THE OPTIMAL CASTING PARAMETERS
Throughout the production process, a large number of parameters affect the quality of the castings: chemical composition of casting alloy and features of high pressure die casting machine.
The determination of casting parameters is mainly based on the huge experience of the workers. Nowadays, computer simulations make it easier to determine the parameters. This greatly reduces the costs incurred in the past by seeking optimal parameters with a trial-and-error approach.
In this paper importance is given for the parameter design stage. The basic steps to investigate the role of process parameters in level of material shrinkage and cycle time, are summarized as follows:
Step 1: selection of the most significant HPDC parameters having influence on the material shrinkage and cycle time,
Step 2: selection of the appropriate design of experiments,
Step 3: performing simulation of the die casting process under the experimental conditions dictated by the chosen design of experiments,
Step 4: collection and analysis the data and
Step 5: making decisions regarding optimum setting of control parameters.
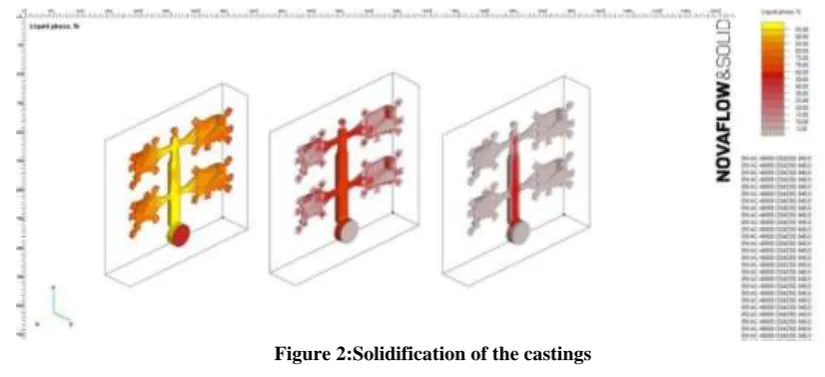
The all necessary parts for four identical parts such as casting cavity, biscuit, runners, gates and overflows were modelled and shown in figure 1.
Figure 1:3D model used for computer simulation
The literature review indicates that the Taguchi method is suitable in experimental design for designing and developing robust products or processes. The test plan uses orthogonal fields to determine the impact of design parameters on the process. The fields are selected depending on the number of parameters. It is necessary to well know the process in order to properly determine the levels at which variables change.
Input parameters
The parameters that have the greatest influence on the HPDC are selected as input parameters. In this paper, the following parameters are selected as input parameters:
- pouring temperature, - mould temperature,
Output parameters
The goal is to obtain the optimal output parameters. The observed output parameters of the HPDC process are: - shrinkage of material and
- cycle time (which includes the time of casting and solidification of the casting). The values of the input parameters together with their levels are shown in Table 1.
Table 1: Input parameters and their levels
Level
Pouring
temperature, TP
[°C] A
Mould
temperature, TM
[°C] B
Plunger velocity at
2nd phase, vII
[𝐦/𝐬]
C
Pressure at 3rd
phase,p [MPa] D
1. 640 150 1.5 10
2. 670 200 2.5 20
3. 700 250 3.5 30
In this case, orthogonal array L9, with four parameters and three levels, was selected. The design of the experiments with the experimental results are shown in Table 2.
Table 2. Design of experiments and experimental results
Runs
Input parameters Output parameters
TP
[°C]
TM
[°C]
vII [m/s]
p [MPa]
Material
shrinkage [%] Cycle time [s]
1 640 150 1.5 10 2.409 10.300
2. 640 200 2.5 20 2.697 10.800
3. 640 250 3.5 30 3.113 12.013
4. 670 150 2.5 30 2.587 10.483
5. 670 200 3.5 10 2.282 11.091
6. 670 250 1.5 20 3.088 12.969
7. 700 150 3.5 20 2.783 10.798
8. 700 200 1.5 30 2.536 12.040
9. 700 250 2.5 10 2.244 13.239
The experiments were performed in commercial software NovaFlow&Solid. The program performs simulations of the high-pressure casting process. Output parameters were recorded after each experiment performed in virtual environment. Benefits of those software are shared by customers and die casters, as the number of rejected products can be significantly reduced, leading to shortened delivery times, improved quality and indirect cost-reduction (less material waste and no need for empirical tests or trials).
In the computer simulation it is possible to identify shape and location of porosities and to predict air entrapment by tracking its flow, as shows the figure 2. It can be seen from the figure 3 that the latter solidifies the runner system, which is an indication of proper process. The color bar on the right side shows the percentage of liquid phase in the mould.In this study, further processing procedure should find optimal controllable variables for multi objective function using the GRA method. Two quality objectives of the process were chosen, including the shrinkage of the material and cycle time. Typically, the small values of shrinkage of the material and cycle time are desirable for the casting operations.
Grey relational analysis
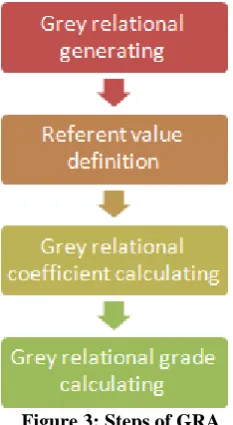
In this paper Gray relational analysis (GRA) is used for determining optimal process parameters as well as their interactions. GRA together with Taguchi method, has proven to be very successful. Figure 3 shown the sequence of steps of gray relational analysis.
Figure 3: Steps of GRA
Since the Taguchi method cannot solve the problem of optimizing multiple parameters (but just one), this disadvantage complements the gray relational analysis. Depending on the criterion of the objective function, grey relational analysis provides the optimal combination of all parameters that have been considered on the basis of calculations the influence of each parameter on the process.
At the beginning of the grey relational analysis, data normalization is needed to make the data comparable. Depending on characteristics of the data set, different methodologies of data pre-processing are available. In this study, the normalized value of original data sequence for shrinkage of material and cycle time are smaller-the-better performance characteristic which can be expressed as:
ij ij
ij ij ij
y y
y y x
min max
max
(1)
where xijis the value after the grey relation generation, min yij is the smallest value of original data yijand max yij is the largest value of yij. Subscript j stands for response and i for experiment or simulation. Table 3 shows the normalized values shrinkage of material and cycle time.
Table 3. Normalize experimental results
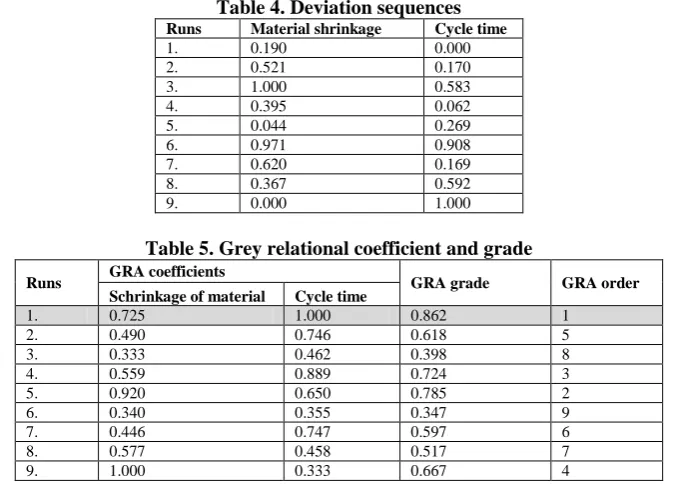
The next step is a determination of the reference sequence x0j. The performance of simulation i is considered as the referent for the response j if the value after the grey relation generation xij is equal to 1 or nearer to 1 than the value for any other simulation.Table 4 shows deviation sequences.
In the third step of the GRA, the grey relation coefficient is used for determining how close are xijand x0j. The grey relation coefficient can be determined as:
Runs Material shrinkage [%] Cycle time [s]
1. 0.810 1.000
2. 0.479 0.830
3. 0.000 0.417
4. 0.605 0.938
5. 0.965 0.731
6. 0.029 0.092
7. 0.380 0.831
8. 0.633 0.408
m ax ij m ax m in
ij (2)where
0
,
1
is the index of distinguishability called distinguishing coefficient. In this study, the value ofcoefficient
is assumed as 0.5. It can be seen from the above equation when xijand x0j are closer, the grey relation coefficient is the larger.ij j ij x x
0 (3)
min
min
{ij,i1,2,...,m;j1,2,...,n}, (4)max
max
{ij,i1,2,...,m;j1,2,...,n}. (5)The last step is the determination of the grey relation grade, GRG, which presents the measurement formula for quantification in grey relational space. It is calculated using the equation:
n j ij i n y 1 1 (6)where n is a number of process response.
The grey relational grade points to the degree of similarity between the comparability sequence and the reference sequence. Therefore, be the best choice would be the experiment or simulation with the highest grey relation grade. Table 5 shows the grey relation coefficients and grade for each experiment where the highest grey relational grade is the order of 1.
Table 4. Deviation sequences
Runs Material shrinkage Cycle time
1. 0.190 0.000
2. 0.521 0.170
3. 1.000 0.583
4. 0.395 0.062
5. 0.044 0.269
6. 0.971 0.908
7. 0.620 0.169
8. 0.367 0.592
9. 0.000 1.000
Table 5. Grey relational coefficient and grade
Runs GRA coefficients GRA grade GRA order
Schrinkage of material Cycle time
1. 0.725 1.000 0.862 1
2. 0.490 0.746 0.618 5
3. 0.333 0.462 0.398 8
4. 0.559 0.889 0.724 3
5. 0.920 0.650 0.785 2
6. 0.340 0.355 0.347 9
7. 0.446 0.747 0.597 6
8. 0.577 0.458 0.517 7
9. 1.000 0.333 0.667 4
The experiment number 1, highlighted in grey, is the nearest optimum controllable parameters combination: pouring temperature 640 °C, mould temperature 150 °C, plunger velocity at 2nd phase 1.5 m/s, and pressure in the third phase 10 MPa.
This combination of factors is the best according to the performed experiments, but it does not represent the optimum. In order to obtain the optimal combination of factors, it is necessary to calculate the mean average value of the relational ratings for each parameter level, based on Tables 2 and 5. The level of factor that has the highest relational score is optimal. The optimal combination of parameters and the relational grades for the given levels are shown in Table 6.
Table Error! No text of specified style in document.. Response table for grey relational grade
Parameters Level 1 Level 2 Level 3 Rank [max/min]
Pouring temperature, TP 0.626 0.619 0.594 0.032
Mould temperature, TK 0.728 0.640 0.451 0.277
Plunger velocity at 2nd phase, v
II 0.576 0.670 0.593 0.094
Optimum controllable parameters combination: pouring temperature 640 °C, mould temperature 150 °C, plunger velocity at 2nd phase 2.5 m/s, and pressure at 3rd phase 10 MPa.
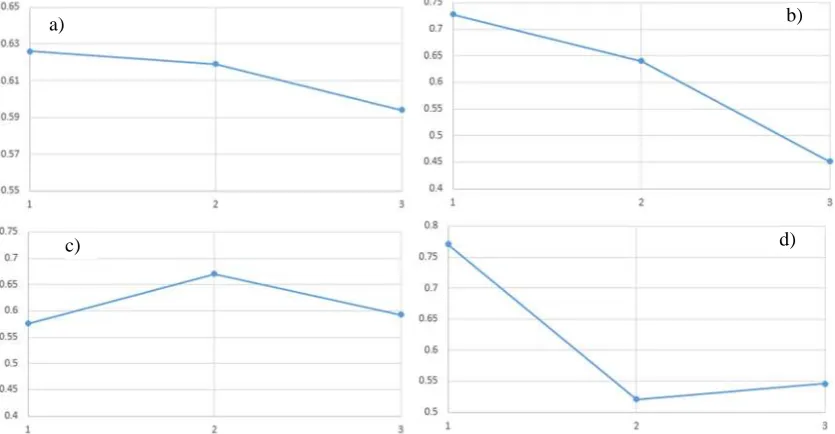
After performing a grey relational analysis, an optimal combination of parameters was obtained which satisfies both the criteria of the objective function, the less material shrinkage and the shorter the cycle time. Both output sizes are of equal importance to the process.Diagrams of relational grade for all four controllable parameters are shown in figure 5.
Figure 5. Diagrams of relational grade: a) Pouring temperature, b) Mould temperature, c) Plunger velocity at 2nd phase, d) Pressure at the 3rd phase
Once the optimal combination of factors has been determined, it is desirable to determine the extent to which particular processing parameters affect the casting process and in particular the shrinkage and cycle time. The influence of an individual parameter is found by analysis of variance (ANOVA). ANOVA is a unique procedure which is used in this study to find out which controllable parameter significantly affects the performance characteristic. The results of the variance analysis are presented in table 7. From the results, it is observed that the pressure of the third phase has the greatest influence on the material shrinkage and cycle time with 48.56%, followed by the mold temperature of 43.62%. The speed of the second phase affects the results with 6.37%, while the pouring temperature has a negligible effect.
Table 7. Results of the analysis of variance
df Seq SS Adj MS F-ratio Contribution
Pouring temperature 2 0.00174 0.00087 1.03699 0.74 %
Mould temperature 2 0.10251 0.05152 61.0692 43.62 %
Plunger velocity at 2nd
phase 2 0.01496 0.00748 8.91175 6.37 %
Pressure at the 3rd
phase 2 0.11411 0.05706 67.9836 48.56 %
Error 2 0.00168 0.00084 0.71 %
Total 10 0.235
df - Degree of freedom, SS - Sum of square, MS – Mean square
III.
DISCUSSION OF THE RESULTS
Shrinkage can cause dryness, inaccurate casting dimensions and porosity. The main role of the third stage pressure is to reduce the porosity and give a better casting surface. The action of high pressure fills the pores and defects of the volume. That is why pressure has the greatest influence on the results of experiments. The shrinkage as well as the quality of the casting are influenced by the temperature regime of the mould. When the mould has a high temperature, the melt binds to the mould and the amount of bubbles and pores increases, while in the cold mould the crystalline compounds are formed during the casting, resulting in poorer surface quality. Also melt temperatures are avoided due to heat shocks caused by contact with the colder mould surface. Therefore, the temperature is sought to be somewhere around 10 °C to 20 °C higher than the crystallization temperature of the melt. The temperature of the melt and the mould with additional cooling create crystallization conditions. Those in the die-casting process can significantly improve the mechanical properties and structure.
a) b)
Increasing the velocity results in a higher mass and density of the casting. Increasing the velocity at the gates leads to a decrease in the size of the pores as well as an increase in their dispersion, a decrease in the pore volume, and the formation of a finer crystalline structure. Velocity has a greater effect on filling time and porosity than on shrinkage and solidification time, as shrinkage is mainly caused by material shrinkage due to cooling.
IV.
CONCLUSION
This paper describes the effects of individual parameters on the entire HPDC process and on the final quality of the product. Carefully adjusting the parameters led to avoiding the casting defects. Defects such as porosity, bubbles and hot cracks adversely affect the mechanical properties of the casting, which in most cases results in higher cost to the manufacturer.
In the experimental part of the paper, the combination of Taguchi's method and gray relational analysis were used to found the optimum HPDC process parameters to obtain minimal shrinkage and minimal cycle time as output values. The optimal parameter combination for the desired characteristics is designated A1B1C2D1. The pouring temperature is 640 °C, the mould temperature is 150 °C, plunger velocity at 2nd phase is 2.5 m/s and the third phase pressure is 10 MPa. With this combination it is possible to reduce the percentage of shrinkage and the cycle time. After finding the optimal combination, it is necessary to determine the extent to which the parameters affect the process. It was found that the third phase with 48.56% and the mould temperature with 43.62% had the greatest influence on the shrinkage and cycle time. The higher the third stage pressure, the better the mechanical properties of the casting. However, very high pressures are avoided due to the high load on the mould and the risk of the mould being opened. Inappropriate mould temperature can result in cold welds, imperfections, gas porosity and casting inclusions. Because of this, the cast has poorer mechanical properties and surface quality. Too high a temperature causes the melt to bind to the mould, resulting in bubbles and pores on the cast, while cold moulding causes an earlier solidification of the molten metal. The pouring temperature and plunger velocity at 2nd phase do not have an excessively large influence on the results of the experiments. The effect of the plunger velocity at 2nd phase is 6.37%, while the effect of the mould temperature is negligible with 0.74%. Too high temperatures cause large temperature differences on the mould and early crystallization can occur at too low temperatures. The mould temperature is usually about 20 °C above the crystallization temperature.
REFERENCES
[1]. Jiang Zheng, Quodong Wang, Peng Zhao, Congbo Wu(2009), Optimization of high-pressure die casting process parameters using artificial neural network, International Journal of Advanced Manufacturing Technology, 44; p 667-674.
[2]. Mahesh N Adke, Shrikant V Karanjkar, (2014), Optimization of die-casting process parameters to identify optimized level for cycle time using Taguchi method, International journal of innovation in engineering and technology, Vol 4, Issue 4, p 365-375.
[3]. Manjunath PatelG.C., Prasad Krishna, Mahesh B. Parappagoudar. (2014), Optimization of Squeeze Cast Process Parameters Using Taguchi and Grey Relational Analysis, Procedia Technology, Volume 14, p 157-164.
[4]. Anh Tuan Do and Van-The Tran, (2018), Optimization of Precision Die Design on High-Pressure Die Casting of AlSi9Cu3, February 2018 DOI: 10.1007/978-981-10-7149-2_53 In book: Proceedings of the International Conference on Advances in Computational Mechanics 2017
[5]. Mousavi Anijdan SH, Bahrami A, MadaahHoseini HR, Shafyei A (2006) Using genetic algorithm and artificial neural network analyses to design an Al–Si casting alloy of minimum porosity. Mater Des 27, 605–609
[6]. Tsoukalas VD (2004) A study of porosity formation in pressure die casting using the Taguchi approach. J EngManuf 218, 77–86 [7]. Tsoukalas VD (2008) Optimization of porosity formation in AlSi Cu pressure die castings using genetic algorithm analysis. Mater
Des 29, 2027–2033