Analysis of MOV Surge Arrester Models by
using Alternative Transient Program
ATP/EMTP
Vishal R. Rakholiya Dr. H. R. Sudarshana Reddy
PG Scholar Professor
Department of Power System Engineering Department of Electrical & Electronics Engineering
UBDTCE, Davangere, India UBDTCE, Davangere, India
Abstract
Transient over voltages that happen in the power system are the major factor of equipment harm in the electrical system. One of defensive device which can diminish the lightning impact, protect high and medium voltages of system device under switching overvoltage or lighting is metal oxide surge arrester (MOSA). Frequency-dependent characteristic of arrester have been simulated by IEEE, Pinceti and Fernandez & Diaz models. The models parameters were calculated by using trial and error method in the ATP/EMTP software. Results suggest that the Pinceti model gives better residual voltage responses compared to other models. In addition, the Fernandez & Diaz model is the best surge arrester model particularly with respect to the quenching time.
Keywords: Transient over voltages, Metal Oxide Surge Arrester and Alternative Transient Program (ATP/EMTP) ________________________________________________________________________________________________________
I. INTRODUCTION
Metal Oxide Surge Arrester (MOSA) is a basic device which can be used to protect equipment against lightning or internal and external overvoltage condition. Overvoltage may damage and failure of electrical equipment or cause supply disturbance and other serious damages in the power system. Sometimes overvoltage occurs on system because of lightning strikes which may then give the difficulty to the functioning of equipment. So, it’s very important thing to know about overvoltage protection. Sudden changes in operating conditions of the electrical network can produce switching and temporary overvoltage. Transient which is occurs when the electrical network is changed because of switching of fault conditions cause switching overvoltage. These phenomena will usually cause high oscillation and damped sinusoidal of response in the network. The overvoltage range of frequency varies from a few hundred Hz to kHz. Disconnection of the load may cause temporary overvoltage or steady-state overvoltage power frequency in steady-state voltages of power system frequency. The detail study of overvoltage may include the study of its shape, magnitude and frequency, duration.
By Here this work is depends on main causes of over voltages in power system which are switching and lightning. The occurrence of over voltages in system may damage the insulation of lines and equipment’s. To protect insulations and equipment from the damaging effect because of overvoltage, metal oxide surge arresters have been used. Because of dynamic performance of the surge arresters, we cannot simulate by using non-linear resistors. Therefore, different models are introduced for simulate the dynamic behaviour of surge arresters. In this literature, to determine surge arrester parameters, a novel algorithm has been proposed and then a comparison of IEEE and Pinceti model done. IEEE and Pinceti models are the main models which used to simulate surge arrester’s dynamic performance [1].
Metal oxide surge arrester is fundamental element of protecting device that can protect against overvoltages. In developing models to represent the behaviour of a metal oxide surge arrester to lightning current, it is important to take into account the dynamic behaviour of metal oxide surge arrester. It is called accurate non- linear V-I curve. Even though several models have been analysed, the model with improved accuracy is still sought after. In this paper, an approach is to analyse models that can characterize the behaviour metal oxide surge arrester with series gap. To carry out simulation of metal oxide surge arrester using ATP/EMTP and to evaluate the performance of metal oxide surge arrester models.
II. METHODOLOGY
Some of previously published models which are IEEE, Pinceti and Fernandez and Diaz model will be discussed in this section.
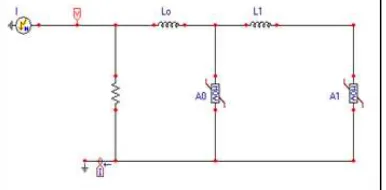
IEEE Model
(IJSTE/ Volume 3 / Issue 02 / 023)
stability can be improved by adding an inductance Lo (connected in parallel with resistance 𝑅0). For the fast rising current, the impedance of RL filter becomes more significant which means current passes through the non-linear branch 𝐴0.
So, 𝐴0 has a higher voltage than 𝐴0. The model of arrester will generate higher voltages which then match the dynamic behaviour of metal oxide surge arrester. This model is shown in figure 1.
Fig. 1: IEEE Working Group model
Equations (1-5) show the parameter and V-I characteristic of varistor given in ref. [2]. The 𝐴0 and 𝐴1 nonlinear characteristic of V-I characteristic is shown in figure 2.
L0=0.2dn μH (1)
R0= 100d
n Ω (2)
L1= 15d
n μH (3)
R1 =65dn Ω (4)
C = 100d
n pF (5) Where;
n = Total number of parallel columns in metal-oxide (MO) disks. d = Length of arrester columns in metre (m).
Fig. 2: Nonlinear V-I characteristic for A0 and A1
Pinceti Model
Here pinceti model is related to IEEE model, but a few modifications are done in model [3]. The difference is that no capacitance between the one terminal to other terminal and nonlinear resistance 𝐴0. As shown in figure 3 at input terminal; R is replaced by nearly about 1MΩ resistance. The higher value of R is used to avoid numerical oscillation. Nonlinear resistance values are based on [2]. Inductances 𝐿0 and 𝐿1 are calculated using equation (6, 7).
L0= 1
12∙
Vr1 T2⁄ −Vr8 20⁄
V8 20⁄ Vn μH (6)
L1= 1
4∙
Vr1 T2⁄ −Vr8 20⁄
V8 20⁄ Vn μH (7) Where;
𝑉𝑛= Arrester’s rated voltage
𝑉𝑟1 𝑇⁄2 = Residual voltage at 10kA fast front current surge (1 𝑇⁄ 2 𝜇𝑠)
𝑉8 20⁄ = Residual voltage value at 10kA current impulse surge with 8 20 𝜇𝑠 ⁄ shape
The advantage of this model is there is no need to consider any physical characteristic but only manufacturer datasheet required. For equations (6) and (7) are based on the fact that parameter 𝐿0 and 𝐿1 are related to the model. The importance of the inductance is to characterize the model behaviour on fast front surge.
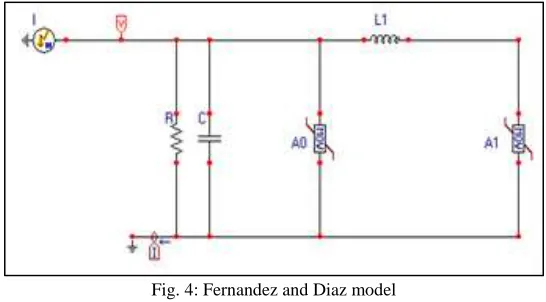
Fernandez and Diaz
Fig. 4: Fernandez and Diaz model
Fernandez and Diaz model is also based on the IEEE model. In Fernandez and Diaz model 𝐴0 and 𝐴1 are separated by 𝐿1 and 𝐿0 is neglected. This figure is shown in figure 4. Capacitance is included in this model and it represents terminal to terminal capacitance of arrester [4].
The advantage of this model is that it does not need the iterative procedure. V-I (curve) characteristic for 𝐴0 and 𝐴1 are calculated using manufacturer’s datasheet. For the resistance, it is assume as 1MΩ to avoid numerical oscillation or to limit the current in circuit. Computation of parameter for procedure is given in ref. [5]. Inductance 𝐿1 and capacitor is given as:
L1= 1 5∙
Vr8 20⁄ −V30 60⁄
V8 20⁄ Vn μH (8)
C = 1 55∙
Vr8 20⁄ −V30 60⁄
V8 20⁄ Vn pF (9) Where;
𝑉𝑛 = Arrester rated voltage.
𝑉𝑟8 20⁄ = Residual voltage at 10kA current surge. 𝑉30 60⁄ = Residual voltage at 1kA.
III. DETERMINING V-I CHARACTERISTIC DATA FOR ALL MODELS
The data on surge arrester V-I characteristic was provided by IEEE working group 3.4.11 [2]. This dissertation is to calculate V-I characteristic from the sample of the IEEE working group. The manufacturer datasheet with Pexlim-P96 was chosen to simulate the nonlinear V-I characteristic. Table 1 shows the manufacturer datasheet of Pexlim-P96 with various lightning surge currents.
Table - 1
Residual voltage for surge arrester in manufacturer datasheet
Type of surge arrester
Rated voltage (kV)
Residual Voltage With Different Waveforms for Discharge Current Values in kV
1/5μs 8/20μs 30/60μs
10 kA 5 kA 10 kA 20 kA 1 kA 2 kA
Pexlim P96 96 232 208 219 240 188 194
Selected current was chosen from non-linear resistor V-I characteristics point with reading of IR in per-unit (pu). Then, this value was multiplied with (𝑉10⁄1.6) to calculate the discharge voltage of the arrester. Conversion from pu to actual voltage can be done by following formula (10, 11) is shown in table 2.
(IJSTE/ Volume 3 / Issue 02 / 023)
Table - 2
Voltage Current (V-I) values for nonlinear resistor A0 and A1 in IEEE, Pinceti and Fernandez & Diaz model
Curve 𝐴0 Curve 𝐴1
I (kA) V (PU) V (kV) I (kA) V (PU) V (kV)
0.01 1.40 191.62500 0.1 1.23 168.35625
0.1 1.54 210.78750 1 1.36 186.15000
1 1.68 229.95000 2 1.43 195.73125
2 1.74 238.16250 4 1.48 202.57500
4 1.80 246.37500 6 1.50 205.31250
6 1.82 249.11250 8 1.53 209.41875
8 1.87 255.95625 10 1.55 212.15625
10 1.90 260.06250 12 1.56 213.52500
12 1.93 264.16875 14 1.58 216.26250
14 1.97 269.64375 16 1.59 217.63125
16 2.00 273.75000 18 1.60 219.00000
18 2.05 280.59375 20 1.61 220.36875
20 2.10 287.43750
Final Parameters of Each Model
The modelling and selecting parameter of metal oxide surge arrester model for one column arrester and 96 kV rated voltage with an overall length of arrester of 1 meter. The discharge voltage, 𝑉10, for this arrester is 219 kV and switching discharge voltage, 𝑉𝑆𝑆 for 1kA, 30 60⁄ 𝜇𝑠𝑒𝑐 is 188kV. The final parameter of the surge arrester model is shown in table 3.
Table – 3
Final parameter of each model
Model 𝐿0 (𝜇𝐻) 𝐿1 (𝜇𝐻) 𝑅0 (𝛺) 𝑅1 (𝛺) C (pF)
IEEE 0.2 15 100 65 100
Pinceti 0.475 1.425 100000 - -
Fernandez and Diaz - 2.178 100000 - 0.247
IV. RESULTS
Simulation results for IEEE, Pinceti and Fernandez & Diaz model were analysed. Two important things are the peak of residual voltage and the quenching time for each model. The absolute error for each model is based on peak residual voltage simulation result and manufacturer datasheet. Simulations of the behaviour of lightning arrester by various magnitude current surges were done. Results are compared with manufacturer datasheet.
The simulation results calculated for each model are compared with the data provided by manufacturer. The relative error is calculated (Table 4) by using equation (12):
Error(e) =Vr simulation−Vr manufacturer
Vr manufacturer × 100 % (12)
Where; 𝑉𝑟 𝑠𝑖𝑚𝑢𝑙𝑎𝑡𝑖𝑜𝑛is the residual voltage value from the simulation and 𝑉𝑟 𝑚𝑎𝑛𝑢𝑓𝑎𝑐𝑡𝑢𝑟𝑒𝑟 is the residual voltage value provided in the manufacturer’s datasheet.
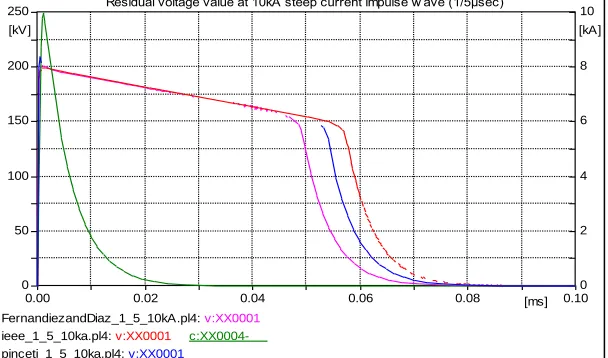
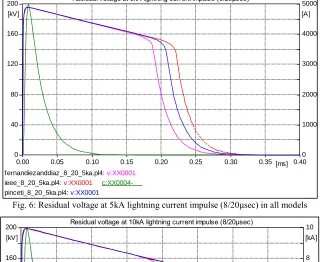
Figure 5 shows residual voltage for 10kA steep current impulse (1/5𝜇𝑠) and figure 6, 7, 8 shows residual voltage for lightning current impulse (8/20𝜇𝑠) at different magnitude current surge that 5 kA, 10 kA and 20 kA. Table 4 shows residual voltage with absolute error for each model. All simulated models seem to be efficient and produce almost same residual voltage.
Fig. 5: Residual voltage value at 10kA steep current impulse wave (1/5μsec)
FernandiezandDiaz_1_5_10kA.pl4: v:XX0001 ieee_1_5_10ka.pl4: v:XX0001 c:XX0004- pinceti_1_5_10ka.pl4: v:XX0001
0.00 0.02 0.04 0.06 0.08 [ms] 0.10
0 50 100 150 200 250
[kV]
0 2 4 6 8 10
Fig. 6: Residual voltage at 5kA lightning current impulse (8/20μsec) in all models
Fig. 7: Residual voltage at 10kA lightning current impulse (8/20μsec) in all models
Fig. 8: Residual voltage at 20kA lightning current impulse (8/20μsec) in all models
fernandiezanddiaz_8_20_5ka.pl4: v:XX0001
ieee_8_20_5ka.pl4: v:XX0001 c:XX0004-
pinceti_8_20_5ka.pl4: v:XX0001
0.00 0.05 0.10 0.15 0.20 0.25 0.30 0.35 [ms] 0.40 0
40 80 120 160 200 [kV]
0 1000 2000 3000 4000 5000 [A] Residual voltage at 5kA lightning current impulse (8/20µsec)
FernandiezandDiaz_8_20_10kA.pl4: v:XX0001
ieee_8_20_10ka.pl4: v:XX0001 c:XX0004-
pinceti_8_20_10ka.pl4: v:XX0001
0.00 0.05 0.10 0.15 0.20 0.25 0.30 0.35 [ms] 0.40 0
40 80 120 160 200 [kV]
0 2 4 6 8 10 [kA] Residual voltage at 10kA lightning current impulse (8/20µsec)
FernandiezandDiaz_8_20_20kA.pl4: v:XX0001 ieee_8_20_20ka.pl4: v:XX0001 c:XX0004- pinceti_8_20_20ka.pl4: v:XX0001
0.00 0.05 0.10 0.15 0.20 0.25 0.30 0.35 [ms] 0.40
0 50 100 150 200 250
[kV]
0 4 8 12 16 20
(IJSTE/ Volume 3 / Issue 02 / 023)
Table – 4
Residual voltage with absolute errors for each model
Model
Residual Voltage With Different Waveforms for Discharge Current Value and Absolute Errors
1/5μs 8/20μs
10 kA 5 kA 10 kA 20 kA
Voltage (kV)
Error (%)
Voltage (kV)
Error (%)
Voltage (kV)
Error (%)
Voltage (kV)
Error (%)
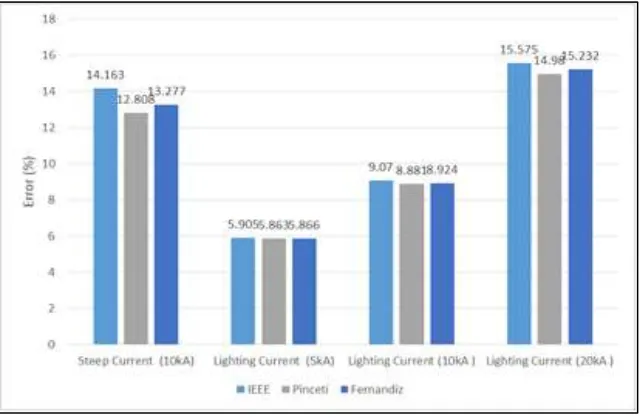
IEEE 199.141 14.163 195.718 5.905 199.136 9.070 202.619 15.575
Pinceti 202.285 12.808 195.803 5.863 199.549 8.881 204.047 14.980
Fernandez and Diaz 201.197 13.277 195.798 5.866 199.456 8.924 203.441 15.232
Figure 5 shows residual voltage for 10kA steep current impulse (1/5𝜇𝑠) and figure 6, 7, 8 shows residual voltage for lightning current impulse (8/20𝜇𝑠) at different magnitude current surge that 5 kA, 10 kA and 20 kA. Table 4 or figure 9 shows residual voltage with absolute error for each model. All simulated models seem to be efficient and produce almost same residual voltage. From table 4 or figure 9, error in each model is nearly same for different lightning surge current. From figure 9, it is notable that the error between the residual voltage of simulation and manufacturer datasheet with different lightning current were reduced mainly during lightning current impulse 5 kA and 10 kA. For a lightning current of 5 kA, it shows the IEEE, Pinceti and Fernandez & Diaz model give an error of 5.905, 5.863 and 5.866 percent.
Furthermore, in steep front, all models have the higher error compare with other current impulse. In steep front, time step in software ATP-EMTP should be chosen properly for minimizing the error.
Fig. 9: Error of each model with various lightning surge current.
From figures 5, 6, 7, 8, we can show that the quenching times at the end of lightning arrester are different for each model. The Fernandez & Diaz model provides the shortest quenching time compared with other models. To give lightning arrester more reliability, the quenching time requires being as small as possible. When the voltage is directly eliminated, less energy absorption and thermal stress occur. Based on Modrusan and R. Diaz [7], the optimal real value of quenching time of lightning current is almost the same with the quenching time of the residual voltage of the measurement through experiment. Besides, the residual voltage is dependent on the rise time. The voltage will increase when the rise time decreases and the residual voltage reaches its peak before the current reaches its peak.
V. CONCLUSION
In this work, by using different impulse test a simulation of the dynamic behaviour of zinc oxide surge arrester model was done. The simulation was performed by using ATP/EMTP software. A procedure of selecting the parameter and the correlation of simulation and manufacturer datasheet to assess the models are displayed. Metal oxide surge arresters have their notable dynamic properties:
When the front time decreases; the voltage across surge arrester increases. The residual voltage reaches its peak before the current reaches its crest.
At higher amplitude current, the surge arrester exhibit shorter time to peak than at higher amplitude.
REFERENCES
[1] NAFAR, MEHDI, MASOUD JABBARI, and GHAHRAMAN solookinejad. "Comparison of IEEE and Pinceti Models of Surge Arresters” Technical Journal of Engineering and Applied Sciences (2013).
[2] IEEE Working Group 3.4.11 “Modelling of metal oxide surge arrester”, IEEE Trans. On Power Delivery, vol.7, No 1, pp. 302-309,1992.
[3] PINCETI, P., & GIANNETTONI, M. (1999). “A simplified model for zinc oxide surge arresters”. Power Delivery, IEEE Transactions on, 14(2), 393-398. [4] FERNANDEZ, F., & DIAZ, R. (2001, June). “Metal oxide surge arrester model for fast transient simulations”. In The Int. Conf. on Power System
Transients.
[5] HSIAO, S. J. (2013). “Simulation and analysis of metal-oxide surge arrester dynamic characteristics”. Journal of the Chinese Institute of Engineers, 36(5), 598 607.
[6] Høidalen, H. K. (January 25, 1996). ATPDRAW Version 3.0 User Manual, Norwegian Electric Power Research Institute, Trondheim, Norway.
[7] MODRUSAN, M. (1983, September). “Tests on high-voltage metal oxide surge arresters with impulse currents”. In Fourth International Symposium on High Voltage Engineering.