Power Spectral Density Computation using
Modified Welch Method
Betsy Elina Thomas Shajimon K. John
PG Student Professor
Department of Electronics & Communication Engineering Department of Electronics & Communication Engineering Saintgits College of Engineering Saintgits College of Engineering
Susan Abe
Professor
Department of Electronics & Communication Engineering Saintgits College of Engineering
Abstract
Spectral analysis is an important area in signal processing with wide range of application. A low complexity algorithm to compute the power spectral density (PSD) using the Welch method is presented in this paper. The Welch algorithm computes spectral power at the cost of high computational complexity. In order to reduce the complexity and hardware utilization pipelining FFT approach is used. Instead of calculating an N-point FFT directly, an point FFT is calculated and two N/2-point FFTs are merged to obtain an N-N/2-point FFT.
Keywords: PSD, Periodogram, FFT, Welch Method
________________________________________________________________________________________________________
I.
INTRODUCTION
Spectral analysis is widely used in signal processing for extraction information from relevant data for eg.in biomedical signal analysis (Y.Park, et al., 2011), spectrum sensing (T.H. Yu, et al., 2011 , T.Yucek, et al., 2009), for distinguishing and tracking signals of interest for eg.in analysis of radar and sonar signals ( F.El.Hawary , et al., 1989). Perhaps power spectral estimation is one of the most important application areas of digital signal processing. Speech recognition problems use spectrum analysis as a preliminary measurement to perform speech bandwidth reduction and further acoustic processing. The vast variety of measurements spectral analysis is capable of is limitless.
Power spectral density (PSD) basically represents the power of an input signal over a range of frequencies. Understanding the strength of a signal is important in the design of any filter. Theoretically, power spectral density of a signal is the Fourier transform of the auto-correlation of the signal. However in actual practice there are different methods to compute PSD of a signal.
The different estimation methods developed to compute PSD can be generally divided into two groups: parametric and non- parametric methods. Parametric methods are computationally complex compared to non-parametric methods. Periodogram based method is an example of non-parametric method. Periodogram based approach involve computation of Fourier transform of signals. Due to the availability of efficient FFT algorithms, this periodogram approach is preferred over other parametric approaches.
The Welch PSD method is a popular non-parametric method which takes advantage of fast Fourier transform in spectral analysis. The principal advantage of this method is reduction in number of computations and the required core storage. This method involves sectioning of a signal, taking modified periodograms of each section and averaging these modified periodograms.
In many applications of PSD constraints like area, performance and power consumption must be taken into consideration. Biomedical signal analysis requires a dedicated hardware which can be used in low- cost and low-power systems. Since FFT is a core component of Welch method, reducing the complexity of FFT results in low complexity architecture suitable for low-power embedded systems.
In this paper, computation of PSD based on welch method with some modifications in FFT computation is proposed. FFT is the core part of welch method. Many modules have been designed to reduce the computational complexity of FFT algorithm. A special class of FFT architecture which can compute FFT in a sequential manner is the pipeline FFT.
Section 2 provides a detailed description of the various spectral computation techniques, FFT architectures and the related works in that field.Section 3 gives the new proposed system and the methodology used in this project. Simulation results are discussed in Section 4. Finally, Section 5 gives the conclusion.
II.
LITERATURE REVIEW
PSD Computation: A.
The different PSD estimation methods developed can be divided into two groups: parametric and non- parametric methods. Some of the parametric methods include autoregressive- moving average (ARMA) model, minimum-variance distortion less response (MVDR) method, Eigen decomposition method and maximum entropy method (“Adaptive Filter Theory”, by S. Haykin). Non-parametric methods include the periodogram method, Welch method, and Capon method.
Parametric methods assume a particular model where a signal fits. If the assumed model is wrong, then the estimated PSDs may contain invalid frequency peaks. . Parametric methods do not use data windowing.
The advantage of non-parametric method is that there is no need to obtain the parameters of time series before using these methods. The main advantage of nonparametric methods is its robustness, which is the estimated PSDs do not contain any invalid frequency peaks. Parametric methods do not use data windowing. The main disadvantage of nonparametric methods is that the computation uses data windowing, this leads to distortion of the resulting PSDs due to window effects. In general, parametric methods are computationally complex compared to non- parametric approach.
Welch method is a non-parametric method based on periodogram, which is used to determine the power spectral density. It involves diving the signal into multiple overlapping segments, taking the modified periodograms of these segments, and averaging these periodograms to obtain the spectral estimate (P.D.Welch, et al., 1967). If the input signal is divided into L segments of length N, then L N-point FFTs need to be computed. So in order to reduce the computations, a new modified welch algorithm which can combine two N/2 - point FFT to one N-point FFT is proposed (K.K. Parhi et al., 2014).
Low-Complexity PSD Computation: B.
The main idea behind modified Welch algorithm is to compute FFT of half of the original segments and then combining the FFTs of two segments to obtain the FFT of the complete segment. Figure 2.1 shows the flow chart of modified welch algorithm. In the modified algorithm the input signal vector is divided into (L+1) non-overlapping segments of length N/2. To each segment we apply an N/2 - point FFT. We obtain an N-point FFT by merging two N/2 - point FFTs and the specified window is applied to it. Modified periodograms of each windowed segment is then calculated and is averaged to form the spectral estimate. Figure 2.2 shows the filter circuit used for windowing in frequency domain.
Fig. 2: Filter Circuit for Windowing (K.K. Parhi et al., 2014)
Fast Fourier Transform Architectures: C.
Fast Fourier Transform (FFT) algorithm is widely used in many signal processing and communication systems. Due to its intensive computational requirements, it occupies large area and consumes high power if implemented in hardware. Efficient algorithms are developed to improve its architecture.
Depending on the way the full DFT is mapped into sub problems, the FFT algorithms are classified into two families: Cooley-Tukey and Prime Factor Algorithms (PFA). Cooley-Cooley-Tukey mapping is the simplest mapping suitable for any number N if mixed radix method is employed, but the PFA is not suitable for any number because of the restriction that all the factors of N should be co-prime. So, PFA is used as the special FFT algorithm for numbers with coprime factors. Each type of algorithm is further classified based on other characteristics as it operates in-place or uses extra scratch memory, whether it uses decimation-in-time or decimation- infrequency, etc. There are four basic types of FFT architectures, namely: memory based architecture, cache memory based architecture, array architecture, pipelined architectures (“Discrete Time Signal Processing”, by A. Oppenheim). Pipelined FFT architectures are fast and high throughput architectures with parallelism and pipelining. Even though the hardware complexity is high and less flexible compared to other architectures, they offer high throughput and energy efficient implementations. Some commonly used pipelined architecture is Multi-path Delay Commutator (MDC) and Single-path Delay Feedback (SDF) (T.Sansaloni, et al., 2005)
In MDC architectures, input sequence is first divided into multiple parallel data streams by commutator and then, butterfly operation followed by twiddle factor multiplication is performed with proper delays to each data stream. In single path delay feedback architectures, a single data stream goes through multiplier in every stage. The delay units are more efficiently utilized by sharing the same storage between the inputs and outputs of the butterfly. SDF architectures have the minimum memory requirements due to efficient use of delay buffers (“Thoery and Application of Digital Signal Processing”, by L.R.Rabiner).
III.
ANALYTICAL PROCEDURES
In the previous section various FFT architectures are described. Pipelined fft is a special class of fft architecture which can compute the fft in a sequential manner. Pipelined architectures are characterized by real-time, non-stopping processing and present small latency with low power consumption, makes them suitable for most DSP application. Out of the two common pipelined architectures described, radix-2 single path delay feedback (R2SDF) DIT FFT architecture is proposed in this thesis to improve the power spectral estimation.
Theoretically, input given to FFT is normally in floating point format. For implementing FFT implementation block called floating point arithmetic is not feasible. Creating block of floating point arithmetic is itself being complex. We will omit this and for the number representation a fixed point scheme is used. Floating point arithmetic is not required because order of magnitude of the input and the output of the FFT are similar. By using fixed point we are rounding off the numbers.
The algorithm is divided into time based (DIT) and frequency based (DIF) Fast Fourier algorithms. DIT-FFT orders the data from bit reversal order to normal order, whereas DIF-FFT is converse. In DIT-FFT the N-point sequence is broken into two sequence, the DFT’s of which can be obtained to give the DFT of the original N-point sequence. DIF-FFT is easier to design than DIT FFT. Both DIT-FFT and DIF-FFT have identical computational complexity. In our design we choose DIT-FFT algorithm over DIF-FFT.
Selecting an FFT radix is the first step on the algorithmic level. It is mainly a trade-off between the speed, power and area for the number of transistors. High-radix FFT algorithms, such as radix-8, often increase the control complexity and are not easy to implement. And to radix-2 FFT, there is the increase in the number of butterfly elements compared with radix-4, but the butterfly structure is much simpler. Hence we go for radix-2 FFT in our design.
Radix 2 SDF Butterfly Structure: A.
The proposed architecture as shown in fig. 3.1 consist of butterfly I, butterfly II, and complex multipliers with twiddle factors. Butterfly I calculate the input data flow, Butterfly II calculate the output data flow from Butterly I, then multiply the output of butterfly II with twiddle factors, to get the results.
Fig. 3: 16-Point R2SDF DIT FFT Structure
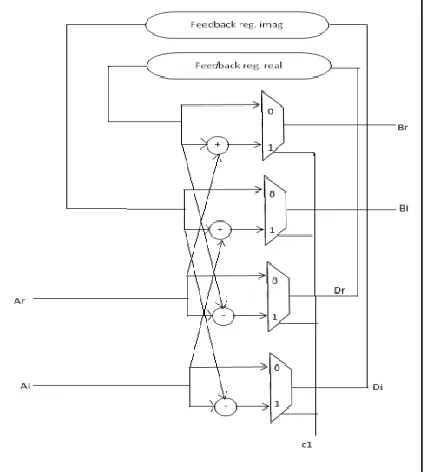
Butterfly I Structure: B.
The Butterfly I structure is shown in figure 3.2. It consists of four multiplexers, two adders, two substractors and feedback registers. The input Ar and Ai for this butterfly structure comes from the previous component, twiddle factor multiplier, except in first stage where it directly comes from the FFT input data. The output data Br, Bi goes to the next stage. The butterfly structure consists of feedback registers. The number of feedback registers is determined according to the delay needed in each stage. In the first stage a delay of one register is required, the third and fourth stages requires a delay of four and eight respectively. The butterfly operation is controlled by control signal C1, which is either 0 or 1. C1=0 direct the input data to feedback registers until they are filled. C1=1, selects the output of adders and substractors.
The Butterfly I store the first half of input series in feedback registers, and then butterfly calculation is done when the posterior half of the data is coming. The output of the adders directly goes to output of the butterfly Br, Bi. The other result Dr, Di goes to the feedback registers and is given to output after appropriate delay.
Fig. 4: Butterfly I Structure (E.H.Wold, Et Al., 1984)
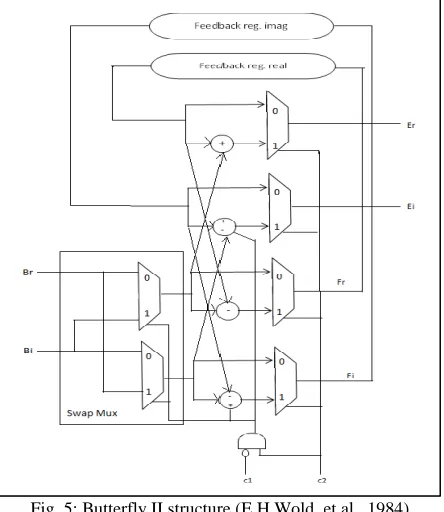
Butterfly II Structure: C.
to the next component which is the twiddle factor multiplier. The other outputs Fr and Fi goes to the feedback registers. The feedback registers is used to produce a delay of two.
Fig. 5: Butterfly II structure (E.H.Wold, et al., 1984)
In the second stage we have twiddle factor multiplication. The required twiddle factor is –j. From observation it is observed that multiplication by –j involves swapping between real and imaginary part and a sign inversion. The swapping is performed by swap mux and the sign inversion is done by switching between add and subtract operations using the swap mux. The control signals C1 and C2 are switched appropriately for this. The control signals C1 and C2 are signed to one when multiplication by –j is needed, thereby the real and imaginary data will be swapped, and the add and subtract operations are switched.
In order to store the anterior half of input data the control signal C1 and C2 is assigned to zero, which is kept for two clo cks in order to store the first two data. The control signal are set to C1=0 and C2=1 to select the output of adders and substractors.
IV.
RESULTS AND DISCUSSION
The proposed PSD estimation using welch method is subjected to behavioral simulation, synthesis, implementation and post-layout simulation using the Xilinx ISE Design Suite 14.7. The design entry is done using VHDL. iSim, which provides a complete, full-featured HDL simulator integrated within ISE, is used for both behavioral simulation and post-layout simulation. Xilinx Synthesis Technology (XST) is used for the synthesis of HDL designs to create Xilinx specific netlist files.
Graphs for FFT Computation Using Pipelined Approach: A.
The output waveform of the Fourier transform computation obtained is as shown in the figure 4.1
The output for the first stage is available immediately after the corresponding inputs are obtained unlike in the normal N-point FFT. In our computation 16-point R2SDF DIT FFT structure is used. We choose 16-bit input signal. In the first stage the input signal is real in nature. But the twiddle factor multiplication makes the input to the successive stages complex.
Graphs for Windowing: B.
The results of the windowing function of real outputs of FFT is shown in figure 4.2.
Fig. 7: Output Waveforms of Window Function Of Real Outputs
The window function is obtained in frequency domain. Windowing is done in order to reduce the number of non-zero coefficients. Window function is applied separately for real and complex outputs of FFT.
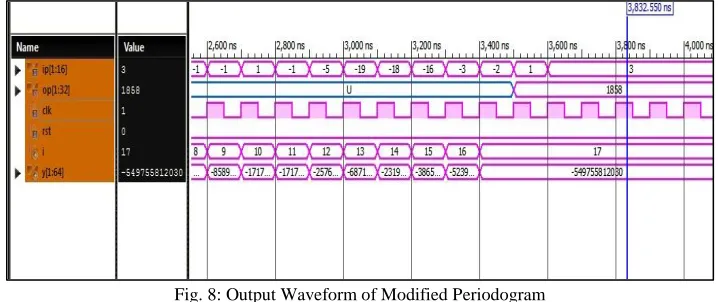
Graphs for Periodogram Operation: C.
The modified periodogram of each windowed segment is computed. To each of the real and complex window output periodogram is applied. Periodogram is simply the square of the windowed data output. The results of the periodogram operation is shown in figure 4.3.
Fig. 8: Output Waveform of Modified Periodogram
Fig. 9: PSD Computed Using the Proposed Method
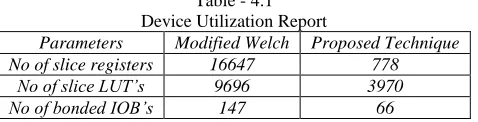
The results can be tabulated as in table 4.1.
Table - 4.1 Device Utilization Report
Parameters Modified Welch Proposed Technique No of slice registers 16647 778
No of slice LUT’s 9696 3970 No of bonded IOB’s 147 66
So, the hardware complexity of power spectral estimation is reduced considerably using the proposed approach. However, there is a slight degradation in the performance of the system.
V.
CONCLUSION
This paper proposed a low-complexity approach to estimate the power spectral density using Modified Welch method. The computational complexity is reduced using the novel method. The pipelined butterfly structure makes the PSD computation suitable for low-power application. The proposed method can be used for processing signals like speech, electroencephalogram (EEG), electrocardiogram (ECG) etc. Further improvements can be made in the FFT which again leads further reduction in the computation complexity and therby reduces the chip-area.
REFERENCES
[1] A. Oppenheim and R. Schafer, “Discrete Time Signal Processing”, 2nded. Englewood Cliffs, NJ, USA: Prentice-Hall.
[2] B. G. Jo, M. H. Sunwoo,“New continuous-flow mixed-radix (CFMR) FFT processor using novel in-place strategy”, IEEE Trans. Circuits Syst. I, Vol. 52, No. 5, May 2005, pp. 911–919.
[3] B. M. Baas,“A low-power, high-performance, 1024-pointFFT processor”, IEEE J. Solid-State Circuits, Vol. 34, No.3, Mar. 1999, pp. 380–387. [4] Carsten Siggaard, Dan Anov, “A Welch Power Spectrum Implementation Using Simulink and Xilinx”, Danish Technological Institute,2008.
[5] E. H. Wold and A. M. Despain, "Pipeline and parallel-pipeline FFT processors for VLSI implementation " IEEE Transactions on Computers, vol. 33, pp. 414–426, 1984.
[6] F. El-Hawary and T. Richards, “A systolic computer architecture for spectrum analysis,” Proc. OCEANS, vol. 4, pp. 1061–1065, Sep. 1989.
[7] G. Bi and E. V. Jones, "A pipelined FFT processor for word-sequential data," IEEE Transactions on Acoustics, Speech and Signal Processing, vol. 37, pp. 1982 - 1985, 1989.
[8] Hang Liu, Hanho Lee,“A high performance 128 point Radix- 24 FFT processor for MIMO”, IEEE Conference on Circuits and Systems, 2008, pp. 834-837. [9] I.G. Prokopenko and A.J.Churina “Spectral Estimation by the model of autoregressive moving average and its resolution”, MRRS-2008 symposium
Proceedings, Keiv, Ukraine, September 22-24,2008.
[10] J. O’Brien, J. Mather, B. Holland,“A 200 MIPS single-chip 1K FFT processor”, In Proc. of IEEE International Solid-State Circuits Conference, Vol. 36, 1989, pp. 166–167.
[11] J.W.Cooley, J.Tukey, “ An algorithm for machine calculation of complex fourier series”, Math. Comput., vol.19,pp. 297-301,Apr. 1965. [12] K. K. Parhi, “VLSI Digital Signal Processing Systems: Design and Implementation”. Hoboken, NJ, USA: Wiley, 1999.
[13] LabVIEW 2010 Advanced Signal Processing Toolkit Help, National Instruments.
[14] L. R. Rabiner and B. Gold, “Theory and application of digital signal processing”. Englewood Cliffs, N.J.: Prentice-Hall, 1975.
[15] M. Ayinala, M. Brown, and K. K. Parhi, “Pipelined parallel FFT architectures via folding transformation,” IEEE Trans. VLSI Syst., vol. 20, no. 6, pp. 1068–1081, June 2012.
[16] M. Ayinala and K. K. Parhi, “FFT architectures for real-valued signals based on radix-23 and radix-24 algorithms,” IEEE Trans. Circuits Syst.I, Reg. Papers, vol. 60, 2013.
[17] M. Ayinala, and K. K. Parhi, “Low-complexity Welch Power Spectral Density Computation,” IEEE Trans. Circuits & Syst., vol. 61, no. 6, pp. 1068–1081, January 2014.
[19] Mao-Hsu Yen, Pao-Ann Hsiung, Chu Yu,“A low power 64-point FFT processor for OFDM”, IEEE Transactions on Consumer Electronics, Vol. 57, 2011, pp. 40-43.
[20] Mario Garrido, J. Grajal, M. A. Sánchez, Oscar Gustafsson,“Pipelined Radix-2k Feed forward FFT Architectures”, IEEETrans on VLSI systems, Vol. 21, No. 1, Jan 2013, pp. 23–32.
[21] National Semiconductor, Application Note 255, Nov 1980.
[22] P. D. Welch, “The use of fast fourier transform for the estimation of power spectra: A method based on time averaging over short, modified periodograms,” IEEE Trans. Audio Electroacoustics, vol. AU-15, pp.70–73, Jun. 1967.
[23] P. Stoica and R. L. Moses, “Introduction to Spectral Analysis”. EnglewoodCliffs NJ, USA: Prentice-Hall, 1997. [24] S. Haykin, Adaptive Filter Theory, 4th ed. Englewood Cliffs, NJ,USA: Prentice-Hall.
[25] T. Yucek and H. Arslan, “A survey of spectrum sensing algorithms for cognitive radio applications,” IEEE Commun. Surveys Tutorials, vol.11, no. 1, pp. 116–130, 2009
[26] T. Sansaloni, A. P´erez-Pascual, V. Torres, and J. Valls, "Efficient pipeline FFT processors for WLAN MIMO-OFDM systems," Electronics Letters, vol. 41, pp. 1043–1044, 2005.
[27] Xilinx manual “ FPGA Design Flow Overview”, 1995
[28] Y.-T. Lin, P.-Y. Tsai, T.-D. Chiueh,“Low-power variable lengthFast Fourier Transform processor”, IEEE Proc.- Comput. Digit. Tech., Vol. 152, No. 4, July 2005.
[29] Yang K.J, Chuang G.C.H,“A MDC FFT Processor with Variable Length for MIMO-OFDM”, IEEE Transactions on VLSI systems, Vol. 21, 2013, pp.720-731.