ISSN (e): 2250-3021, ISSN (p): 2278-8719 Vol. 06, Issue 07 (July 2016), ||V2|| PP 41-47
Multichannel Signal Processing Using Tas5508 and Tas5121
Dr.Kadam Vipulsangram K
, Sirsat Amole A
Electronics Engineering DepartmentP.E.S College of Engineering, NagsenvanDr. Babasaheb Ambedker Marathwada UniversityAurangabad-431002 ( M S ), IndiaP.E.S College of Engineering
ABSTRACT :-Today’s requirement of multichannel audio system can be full filled by using the TAS5508 eight channel digital pulse width modulator which provides both advanced performance & a high level of system integration. Multichannel audio system using PWM based open-loop digital class-d audio power amplifier pusses a fundamental problem of inherent nonlinearity of PWM process. This can be overcome by using a high performance digital power amplifier TAS5121 from Texas instruments incorporate in. The dynamic range control (DRC) techniques described to get the both compression & expansion capabilities over the three separate & definable regions of audio signal levels. Loudness compatioation is explained & the performance of demodulation filter is given to attenuate the high frequency components of the output signals that are out of the audio band. Lastly the performance analysis is given.
I.
INTRODUCTION
Changing sound recording and production from stereo to multichannel creates some new demands on the signal processing tools. Alone from a handling point of view there are advantages by integrating processing of multiple channels into one unit instead of using several in parallel. But many processing tasks simply need multichannel integration in order to function appropriately.
Modern high-fidelity stereo systems commonly consist of digital signal sources, such as compact disc (CD) players, digital audio tape (DAT) recorders, and digital audio broadcast (DAB) receivers. The digitized music signals are pulse-code modulated (PCM) and usually have 12-bit or 16-bit resolution and sampling frequencies of 32 kHz (DAB), 44.1 kHz (CD), or 48 kHz (DAT). Furthermore, a digital preamplifier often serves as a switching center, incorporating volume and sound control, and sometimes even room or loudspeaker equalization. A single stereo digital-to analog converter (DAC) can be used to feed the selected source signal after digital-to-analog conversion to an analog power amplifier, which drives the speakers of the system. Digital systems outperform analog ones with respect to fidelity, reliability, and cost efficiency. Hence, it seems to be reasonable to try to replace even the last two elements in the signal chain – the power amplifier and the loudspeaker – by digital systems. There is no practical concept for digital speakers to date, but quite a few contributions have been made that make the implementation of a digital power amplifier seem possible [1], [2], [3], [4], [5], [6]. The key to digital power amplification can be found in the PWM process.
Commercial audio amplifiers utilizing PWM have been successfully designed and – even if only for special applications – marketed [7], [8]. Those amplifiers are called Class-D amplifiers. However, the Class-D concept leaves it as an option whether to choose an analog or a digital modulator design, resulting in an analog or digital Class-D amplifier, respectively. Two important advantages of the Class-D concept over the conventional Class-A/AB/B techniques should be mentioned here. First, the efficiency of a Class-D amplifier can theoretically reach 100%, as no other element in the power section of the system as the (resistive) load dissipates power. Ideally no heat sinks are required for the transistors that form the switch, because in the on- or off-state either the voltage across the device or current through it is zero, forcing the product of both – which equals the dissipated power – to zero. Hence, the Class-D technology offers small-size, low-cost high power audio amplification. Second, Class-D amplifiers are free of crossover distortion, which can be observed particularly in Class-B designs
.
II.
SYSTEM MODELING & DEVELOPMENT
2.1 System Diagram
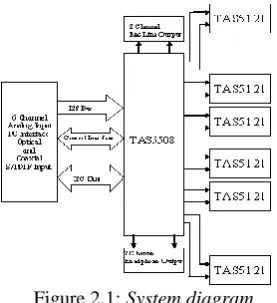
Figures 2.1 shows the system diagram which consist of input section, Processor & output section. Input section includes digital input (S/PDIF), analog inputs, interface to PC and Digital Audio Processor(DAP) features like digital volume control, input and output mixers, auto mute, equalization, tone controls, loudness, dynamic range compression, and Power Supply Volume Control (PSVC) output. The Processor section
consists of TAS5508PAG is a high performance 32-bit (24-bit input) multi-channel PurePath Digital™ pulse width modulator (PWM) based on Equibit™ technology with new fully symmetrical AD modulation scheme. It accepts input sample rates from 32 kHz to 192 kHz. The device also has digital audio processing (DAP) that provides 48-bit signal processing, advanced performance and a high level of system integration. The device has interfaces for headphone output and power supply volume control (PSVC). The output section consists of TAS5121DKD is a compact, high power, digital amplifier power stage designed to drive a 4-Ω loudspeaker up to 100 W (10% THD+N). The TAS5121DKD contains integrated gate drivers; four matched and electrically isolated enhancement-mode N-channel power DMOS transistors, and protection / fault-reporting circuitry. There are configuration options for stereo line level output, stereo headphone output, and power stage failure protection. [9],[10]
Figure 2.1: System diagram
2.1.1 Dynamic Range Control
The DRC provides both compression and expansion capabilities over three separate and definable regions of audio signal levels. Programmable threshold levels set the boundaries of the three regions. Within each of the three regions a distinct compression or expansion transfer function can be established and the slope of each transfer function is determined by programmable parameters. The offset (boost or cut) at the two boundaries defining the three regions can also be set by programmable offset coefficients. The DRC implements the composite transfer function by computing a 5.23 format gain coefficient from each sample output from the rms estimator. This gain coefficient is then applied to a mixer element, whose other input is the audio data stream. The mixer output is the DRC-adjusted audio data.There are two distinct DRC blocks in the TAS5508. DRC1 services channels 1-7 in the 8-channel mode and channels 1-4, and 7 in the 6-channel mode. This DRC computes rms estimates of the audio data streams on all channels that it controls. The estimates are then compared on a sample-by-sample basis and the larger of the estimates is used to compute the compression/expansion gain coefficient. The gain coefficient is then applied to appropriate channels audio stream. This DRC also computes an rms estimate of the signal level on channel 8 and this estimate is used to compute the compression/expansion gain coefficient applied to the channel 8 audio stream.
All of the TAS5508 default values for DRC can be used except for the DRC1 decay and DRC2 decay.
Figure 2-2. DRC Positioning in TAS5508 Processing Flow
Implemented Transfer Function
Figure 2-3. Dynamic Range Compression (DRC) Transfer Function Structure
The three regions shown in Figure 2.3 are defined by three sets of programmable coefficients, Thresholds T1 and T2 define region boundaries, Offsets O1 and O2 define the DRC gain coefficient settings at thresholds T1 and T2 respectively, & Slopes k0, k1, and k2 define whether compression or expansion is to be performed within a given region. The magnitudes of the slopes define the degree of compression or expansion to be performed. The three sets of parameters are all defined in logarithmic space and adhere to the following rules. • The maximum input sample into the DRC is referenced at 0 dB. All values below this maximum value then have negative values in logarithmic (dB) space.• The samples input into the DRC are 32-bit words and consist of the upper 32 bits of the 48-bit word format used by the digital audio processor (DAP). The 48-bit DAP word is derived from the 32-bit serial data received at the serial audio receive port by adding 8 bits of headroom above the 32-bit word and 8 bits of computational precision below the 32-bit word. If the audio processing steps between the SAP input and the DRC input result in no accumulative boost or cut, the DRC would operate on the 8 bits of headroom and the 24 MSBs of the audio sample. Under these conditions, a 0-dB (maximum value) audio sample (0x7FFFFFFF) is seen at the DRC input as a –48-dB sample (8 bits x - 6.02 dB/bit = -48 dB).• Thresholds T1 and T2 define, in dB, the boundaries of the three regions of the DRC, as referenced to the rms value of the data into the DRC. Zero valued threshold settings reference the maximum valued rms input into the DRC and negative valued thresholds reference all other rms input levels. Positive valued thresholds have no physical meaning and are not allowed. In addition, zero valued threshold settings are not allowed. Although the DRC input is limited to 32-bit words, the DRC itself operates using the 48-bit word format of the DAP. The 32-bit samples input into the DRC are placed in the upper 32 bits of this 48-bit word space. This means that the threshold settings must be programmed as 48-bit (25.23 format) numbers.
CAUTION: Zero valued and positive valued threshold settings are not allowed and cause unpredictable behavior if used.• Offsets O1 and O2 define, in dB, the attenuation (cut) or gain (boost) applied by the DRC-derived gain coefficient at the threshold points T1 and T2 respectively. Positive offsets are defined as cuts, and thus boost or gain selections are negative numbers. Offsets must be programmed as 48-bit (25.23 format) numbers.
• Slopes k0, k1, and k2 define whether compression or expansion is to be performed within a given region, and the degree of compression or expansion to be applied. Slopes are programmed as 28-bit (5.23 format) numbers.
2.1.2 DRC Implementation
The three elements comprising the DRC: (1) an rms estimator, (2) a compression/expansion coefficient computation engine, and (3) an attack/decay controller.
• RMS estimator—This DRC element derives an estimate of the rms value of the audio data stream into the DRC. For the DRC block shared by CH1 and CH2, two estimates are computed—an estimate of the CH1 audio data stream into the DRC, and an estimate of the CH2 audio data stream into the DRC. The outputs of the two estimators are then compared, sample-by-sample, and the larger valued sample is forwarded to the compression/expansion coefficient computation engine. Two programmable parameters, ae and (1 – ae), set the effective time window over which the rms estimate is made. For the DRC block shared by CH1 and CH2, the programmable parameters apply to both rms estimators. The time window over which the rms estimation is computed can be determined by:
• Compression/expansion coefficient computation—This DRC element converts the output of the rms estimator to a logarithmic number, determines the region that the input resides, and then computes and outputs the appropriate coefficient to the attack/decay element. Seven programmable parameters—T1,
T2, O1, O2, k0, k1, and k2—define the three compression/expansion regions implemented by this element. • Attack/decay control—This DRC element controls the transition time of changes in the coefficient computed in the compression/expansion coefficient computation element. Four programmable parameters define the operation of this element. Parameters ad and 1 - ad set the decay or release time constant to be used for volume boost (expansion). Parameters aa and 1 - aa set the attack time constant to be used for volume cuts. The transition time constants can be determined by:
There are seven programmable parameters assigned to each DRC block: two threshold parameters - T1 and T2, two offset parameters - O1 and O2, and three slope parameters - k0, k1, and k2. The threshold parameters establish the three regions of the DRC transfer curve, the offsets anchor the transfer curve by establishing known gain settings at the threshold levels, and the slope parameters define whether a given region is a compression or an expansion region.
The audio input stream into the DRC must pass through DRC-dedicated programmable input mixers. These mixers are provided to scale the 32-bit input into the DRC to account for the positioning of the audio data in the 48-bit DAP word and the net gain or attenuation in signal level between the SAP input and the DRC. The selection of threshold values must take the gain (attenuation) of these mixers into account. The DRC implementation examples that follow illustrate the effect these mixers have on establishing the threshold settings.T2 establishes the boundary between the high-volume region and the mid-volume region. T1 establishes the boundary between the mid-volume region and the low-volume region. Both thresholds are set in logarithmic space and which region is active for any given rms estimator output sample is determined by the logarithmic value of the sample.
Threshold T2 serves as the fulcrum or pivot point in the DRC transfer function. O2 defines the boost (> 0 dB) or cut (< 0 dB) implemented by the DRC-derived gain coefficient for an rms input level of T2. If O2 = 0 dB, the value of the derived gain coefficient is 1.0 (0x00, 80, 00, 00 in 5.23 format). k2 is the slope of the DRC transfer function for rms input levels above T2 and k1 is the slope of the DRC transfer function for rms input levels below T2 (and above T1). The labeling of T2 as the fulcrum stems from the fact that there cannot be a discontinuity in the transfer function at T2. The user can, however, set the DRC parameters to realize a discontinuity in the transfer function at the boundary defined by T1. If no discontinuity is desired at T1, the value for the offset term O1 must obey the following equation.
T1 and T2 are the threshold settings in dB, k1 is the slope for region 1, and O2 is the offset in dB at T2. If the user chooses to select a value of O1 that does not obey the above equation, a discontinuity at T1 is realized.Going down in volume from T2, the slope k1 remains in effect until the input level T1 is reached. If, at this input level, the offset of the transfer function curve from the 1:1 transfer curve does not equal O1, there is a discontinuity at this input level as the transfer function is snapped to the offset called for by O1. If no discontinuity is wanted, O1 and/or k1 must be adjusted so that the value of the transfer curve at the input level T1 is offset from the 1:1 transfer curve by the value O1. The examples that follow illustrate both continuous and discontinuous transfer curves at T1.
Going down in volume from T1, starting at the offset level O1, the slope k0 defines the compression/expansion activity in the lower region of the DRC transfer curve.
2.1.2.2 Threshold Parameter Computation For thresholds,
If, for example, it is desired to set T1 = -64 dB, then the subaddressaddress entry required to set T1 to -64 dB is:
T1 is entered as a 48-bit number in 25.23 format. Therefore:
2.1.2.3 Offset Parameter Computation
The offsets set the boost or cut applied by the DRC-derived gain coefficient at the threshold point. An equivalent statement is that offsets represent the departure of the actual transfer function from a 1:1 transfer at the threshold point. Offsets are 25.23 formatted 48-bit logarithmic numbers. They are computed by the following equation.
2.1.2.4 Slope Parameter Computation
In developing the equations used to determine the sub address of the input value required to realize a given compression or expansion within a given region of the DRC, the following convention is adopted. DRC Transfer = Input Increase : Output Increase
If the DRC realizes an output increase of n dB for every dB increase in the rms value of the audio into the DRC, a 1:n expansion is being performed. If the DRC realizes a 1 dB increase in output level for every n dB increase in the rms value of the audio into the DRC, a n:1 compression is being performed.
For 1:n expansion, the slope k can be found by:
For n:1 compression, the slope k can be found by:
In both expansion (1:n) and compression (n:1), n is implied to be greater than 1. Thus, for expansion:
k = n -1 means k > 0 for n > 1. Likewise, for compression, k = (1/n)-1 means -1 < k < 0 for n > 1. Thus, it appears that k must always lie in the range k > -1.
The DRC imposes no such restriction and k can be programmed to values as negative as -15.999. To determine what results when such values of k are entered, it is first helpful to note that the compression and expansion equations for k are actually the same equation. For example, a 1:2 expansion is also a 0.5:1 compression.
As can be seen, the same value for k is obtained either way. The ability to choose values of k less than -1 allows the DRC to implement negative slope transfer curves within a given region. Negative slope transfer curves are usually not associated with compression and expansion operations, but the definition of these operations can be expanded to include negative slope transfer functions. For example, if k = -4
With k = -4, the output decreases 3 dB for every 1 dB increase in the rms value of the audio into the DRC. As the input increases in volume, the output decreases in volume.
2.3 Loudness Compensation
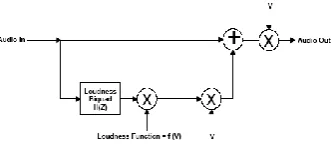
The loudness compensation function compensates for the Fletcher-Munson loudness curves. The TAS5508 loudness implementation tracks the volume control setting to provide spectral compensation for weak low or high frequency response at low volume levels. For the volume tracking function both linear and log control laws can be implemented. Any biquad filter response can be used to provide the desired loudness curve. The control parameters for the loudness control are programmable via the I2C interface. The TAS5508 has a single set of loudness controls for the eight channels. In 6-channel mode loudness is available to the six speaker outputs and also the line outputs. The loudness control input uses the Maximum individual master volume (V) to control the loudness that is applied to all channels. In 192-kHz and 176.4-kHz modes, the loudness function is active only for channels 1, 2, and 8.[9],[10]
Figure 1-17. Loudness Compensation Functional Block Diagram
} (10)
The TAS5121 amplifier outputs are driven by high-current DMOS transistors in an H-bridge configuration. These transistors are either off or fully on. The result is a square-wave output signal with a duty cycle that is proportional to the amplitude of the audio signal. It is recommended that a second-order LC filter be used to recover the audio signal. The main purpose of the demodulation filter is to attenuate the high-frequency components of the output signals that are out of the audio band. Design of the demodulation filter affects the audio performance of the power amplifier significantly. As a result, to ensure proper operation of the overcurrent (OC) protection circuit and meet the device THD+N specifications, the selection of the inductors used in the output filter must be considered according to the following.
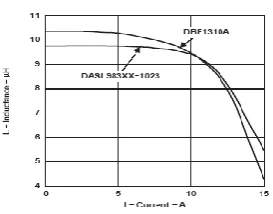
The rule is that the inductance should remain stable within the range of peak current seen at maximum output power and deliver approximately 5 µH of inductance at 15 A.
If this rule is observed, the TAS5121 should not have distortion issues due to the output inductors. This prevents device damage due to overcurrent conditions because of inductor saturation in the output filter. Another parameter to be considered is the idle current loss in the inductor. This can be measured or specified as inductor dissipation (D). The target specification for dissipation is less than 0.05. If this specification is not met idle current increases. In general, 10-µH inductors suffice for most applications. The frequency response of the amplifier is slightly altered by the change in output load resistance; however, unless tight control of frequency response is necessary (better than 0.5 dB), it is not necessary to deviate from 10 µH.
The graphs in Figure 11 display the inductance vs current characteristics of two inductors that are suggested for use with the TAS5121. The selection of the capacitors that are placed from the output of each inductor to ground is simple. To complete the output filter, use a 1-µF capacitor with a voltage rating at least twice the voltage applied to the output stage (PVDD_x). This capacitor should be a good quality polyester dielectric.
Figure 10. Demodulation Filter
Figure 11. Inductance Saturation
III. SYSTEM PERFORMANCE
3.1 THD+N vs Frequency Front Left Channel
Figure 2. THD+N vs Frequency
Comments: Power supply = 30.5 Vdc, Load = 4 Ω, Filter: AES17, Input signal = 1 kHz, Sample frequency = 48 kHz, Blue = 1 W Green = 10 W Red = 80 W
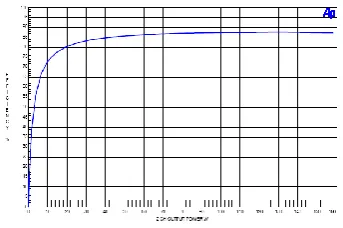
Figure 10. Amplifier Efficiency vs Total (2 ch) Output Power
Comments: Power supply = 30.5 Vdc, Load = 4 Ω, Input signal = 1 kHz, Sample frequency = 48 kHz.
[9],[10]
IV.
CONCLUSIONS
This paper describes the system for six channel audio reproduction. The DRC & Loudness compensation technique simulated using the MATLAB & SIMULINK simulation. Practical implementation is carried out using TEXAS Digital amplifier TAS5121 & Digital Pulse WIDTH Modulator TAS5508.For better performance the deign of Demodulation Filter is given.
As a new approach we can add the two wireless surround speakers as a proposed future scope of this paper
V.
REFERENCES
[1] http://www.ieee.org/portal/cms_docs/pubs/confstandards/pdfs/Author-PDF-Guide-V32-WIN.pdf.
[2] http://www.ams.org/tex/type1-fonts.html.
[3] http://mpa.itc.it/markus/highres_pdf.html.
[4] E.G. Williams. Fourier Acoustics – Sound Radiation and Nearfield Acoustic Holography, Academic Press, 1999.
[5] J.B. Allen and D.A. Berkley, Image method for efficiently simulating small-room acoustics, J. Acoust. Soc. Am, vol. 65, No. 4, pp. 943-948, Apr. 1979.
[6] T. Painter and A. Spanias, Perceptual coding of digital audio, Proc. IEEE, vol. 80, No. 4, pp. 451-513, Apr. 2000.
[7] Craven, P. Toward the 24-bit DAC: Novel Noise-Shaping Topologies Incorporating Correction for the Nonlinearity in a PWM Output Stage, Journal of the Audio Engineering Society Vol. 41, No. 5 , pp.291-313, 1993.
[8] Goldberg J. M., and M. B. Sandler, New high accuracy pulse width modulation based digital-to analogue converter/power amplifier, IEE Proceedings Circuits Devices Systems Vol. 141, No. 4, pp.315-324, 1994.
[9] http://www.ti.com/sc/docs/products/msp/class_d/tutorial.htm#audio,05