Research of Flame Detection on Visual Saliency
Method
Junling Liu
College of Computer Science and Technology,Jilin University, Changchun,130012 ,China .
Department of Information Engineering ,Jilin Teacher’s Institute of Engineering and Technology, Changchun, 130052, China . [email protected]
Hongwei Zhao
College of Computer Science and Technology,Jilin University, Changchun,130012 ,China
Tianjiao Zhao
College of Computer Science and Technology,Jilin University, Changchun,130012 ,China
Abstract—In order to improve the fire detection efficiency of large-scale and complex environment, the paper built a model of flame detection on visual selective attention method. In this model, saliency regions are obtained by Fourier spatial and temporal spectral residual, saliency objects are generated by using a object detection method based on the weight of the color space clustering, and saliency points are found by difference block inverse probability .According to the rules of flame’s color we can judge the risk of fire. The experimental results show that the flame detecting method can find different flames in wild scenes ,and it is very accurate, effective and robust.
Index Terms—Flame Detection, Selective Attention, Fft, Spectral Residual, Saliency, Kmeans Segment, Dbip.
I. INTRODUCTION
Image processing and computer vision technology is utilized to simulate human vision system to recognize flame and the hardware and software are combined to constitute one independent monitoring alarm for warning fire[1]. When adopting this method, it is necessary to make reactions timely when abnormal conditions occurs, therefore, the fire detection technology based on visual processing has aroused extensive research.
The key of visual fire monitoring is to have real-time detection on target region of fire danger in complicated scene, while there is a huge difference between the flames as foreground object and background feature, which belongs to visual salient region. At present, the fire monitoring research foreground object and background feature, which belongs to visual salient region. And the fire monitoring research method of video mainly extracts visual features and monitors image pixel by pixel, seldom adopting visual selective attention method. Yuan et al.[2]
have researched the extraction method for visual features of color, texture and contour. In the fire monitoring method invented by Xu et al.[3], it mainly made the unified filtering of color-time domain-spatial domain on each pixel point in motion region of current video frame, marked pixel, and activated the alarm system when finding the fire region with continuous multi-frames.The fire monitoring research team in Bilkent University [4]has completed the real-time field fire smoke monitoring and night fire monitoring, which monitored the flame region with the spatial wavelet alternation for the cues of color and motion. Yang and Wang [5] have introduced a kind of new video monitoring model based on hierarchy attention and salient integration framework of multi-source perceptive information, and tried to improve the efficiency and initiative of fire monitoring system with salient feature description and low redundant calculation. However, it has only explained the structure of hierarchy attention without study on the realization technology. Visual saliency mechanism is a concept in psychology and cognitive neuroscience, and it is an important psychological adjustment mechanism that when confronted with complex scene, human visual system will quickly focus on a few salient visual objects , and process with priority. Koch and Ullman[6] has proposed the attention selective model and visual focus transfer working mechanism. Itti and Koch[7] has simulated human visual search process to extract different salient feature regions of image; This kind of visual salient allows the visual system to centralized allocate limited computing resources and process the local objects worth concerning with priority. With the visual selective attention mechanism in fire monitoring, it can greatly improve the monitoring initiative and efficiency.
Most target detection with visual selective attention adopt the visual attribute difference between foreground object and background image to allocate the attention resources. However, it concerns attribute feature extraction with large amount of difference detection calculation and slow detection speed.
Manuscript received January 6, 2013; revised April 27, 2013; accepted May 12, 2013.
This paper has adopted the Fourier spectrum space-time difference detection method among adjacent frames in the video without feature extraction, image classification or region segmentation. The algorithm has firstly obtained salient regional profile with Fourier redundancy spectrum among adjacent frames, determined the salient object with CIELab color space clustering method, found out the visual salient point of object, and locked the flame target according to salient point RGB and CIELab color feature value.
Ⅱ.VISUAL SALIENT REGION
In 2001, Oiva in MIT brain and cognitive research group proposed Spatial Envelope theory[8], which can rapidly complete scene identification and classification with the whole energy spectrum and local roughness changes without detection and separating the objects in scene image. Hou and Zhang[9] constructed visual salient map with whole spectral redundancy method of image without the influence of scene category and object attribute, which was a simple, rapid and accurate method. Achanta et al.[10] adopted FM salient region detection to better solve the blurring problem of object edge. The above research and application have provided the reference for the research of flame visual attention method. Based on the extend analysis on features of flame color, texture and motion in the above researches, this paper has put forward the Fourier spectrum space-time difference detection method among adjacent frames in the video to rapidly find out visual salient region, and provide the security for further fire recognition.
A. Image Fourier Transform
The frequency components can show value(color and brightness) changes among adjacent pixels, which means that the quicker the image change in space, the bigger the value corresponding to frequency domain. Image Fourier transform[11] is a method to observe image features from gray distribution to frequency distribution. Image frequency is not only the indicator of grayscale variation in representation image, but also the gray gradient in plane space. Based on the feature of high frequency reflecting details and low frequency reflecting general scenery, the visual attribute transformation violent in the spectrogram is an area with violent transformation, and the corresponding frequency value is higher. The areas with higher visual saliency exist the difference between foreground object and background image with the manifestation of greater gray gradient changes, therefore, the image mutation part in spectrum with Fourier transform is high frequency component,including image contour features, noise and interference. In addition, the internal image change in salient areas sometimes is gentle, which can be obtained with spectrum low frequency component determining the object’s contour information contained in the whole image.
1) Discrete two-dimensional Fourier Transform
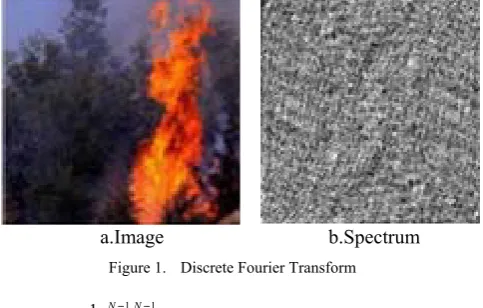
a.Image b.Spectrum Figure 1. Discrete Fourier Transform
1 1
0 0 1
( , ) N N ( , ) exp( 2 ( )) m n
mu nv
F u v f m n j
N π N N
− −
= =
=
∑ ∑
− + (1)1 1
0 0
1
( , ) ( , ) exp( 2 ( ))
N N
m n
mu nv
f m n F u v j
N π N N
− −
= =
=
∑∑
+ (2), , , 0,1, , 1
u v m n= " N− ,f(m,n)is gray value of
image,F(u,v)is frequency of transformation. 2) Center point transfer and visualization for low frequency component
) 2 / , 2 / ( )
1 )( ,
(mn F u N v N
f − m+n ⇔ − − (3)
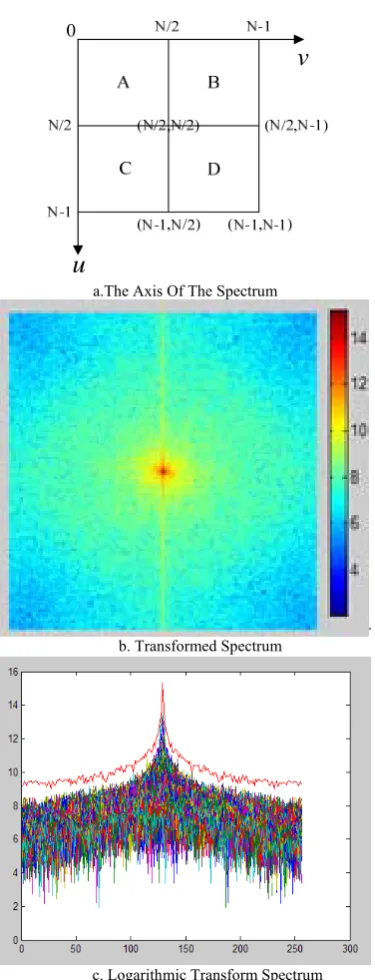
For most energy in image focuses on low frequency component, the amplitude values in four corners of spectrum are larger. However, the low frequency component areas are smaller dispersed in four corners in actual image spectrum analysis process, it is not favorable to be analyzed. At this time, the spectrum coordinates can be displaced according to periodicity and conjugate symmetry of image spectrum. All low frequency components are concentrated in spectrum center with Formula 3, while high frequency components are dispersed around. As shown in Figure2(b) the center was the most bright, larger brightness can show bigger low frequency energy. Formula 4 has shown the amplitude spectrum calculation in frequency domain image. In order to highlight the distribution effect between low frequency and high frequency components, Fourier spectrum logarithmic transform method has been adopted, and the realization effect has shown in Figure2(c). The advantage of logarithmic transformation is the consistence with logarithmic sensing features of human visual system[11]. It can not highlight the image fluctuations in the spectrum, and adding the logarithm can amplify the fluctuation.
(4) (5)
(
)
(
)
2 2
( ) , ( , ) ( , )
( ) lo g [ , ]
A f F u v R u v I u v
P f F u v
= = +
u
v
a.The Axis Of The Spectrum
b. Transformed Spectrum
c. Logarithmic Transform Spectrum Figure 2. Fourier Spectrum Coordinates Transfer
B. Visual Difference Salient Region Generation
[9] referred that the logarithmic spectrum of each kind of image with Fourier transformation owes most similar information, as shown in Figure3. The Fourier spectrum in each image in the same classification has similar shape and frequency range. In the visual selective attention, similar redundant information is allocated with fewer computing resources, while it is allocated with more attention resources for each image with special information. To find out the unique information in each image is the key to find the visual salient region.
From Formula 1 to 2, Fn(u,v) represents the Fourier spectrum of n frame image In(x,y), An(f) represents
frame amplitude spectrum, the process to solve spectrum redundancy can be shown:
1)Fourier transform, Figure1 Fn(u,v)=fft(In(x,y))
2)Center point transfer for low frequency component, Figure2
imn=fftshift(Fn(u,v))
3)Calculate the frequency,Figure3 An(f)=abs(imn)
Figure 3. Frequency Amplitude Spectrum
Figure 4. Rotation Mean Operator
4)Rotation mean operator,Figure4: Rn(f)=rotavg(An(f))
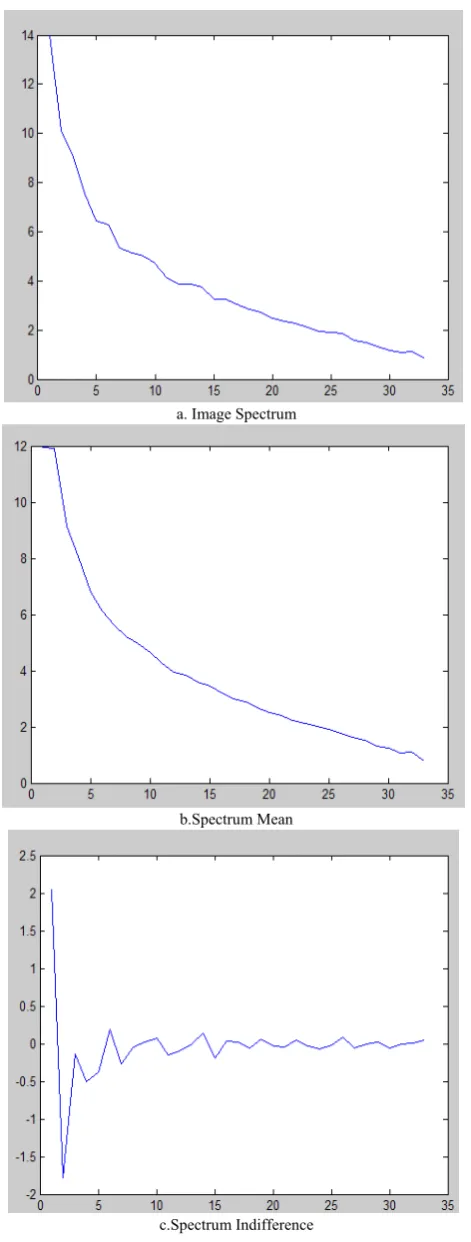
5)Logarithmic spectrum curve generated,Figure5(a) Pn(f)=log(Rn(f))
6) m*m block ‘s Spectral mean filtration,Figure5(b) Avg(Pn (f))= imfilter(Pn(f),fspecial('average',m)) 7) Difference spectrum curve of multiple frame, Figure5(c)
a. Image Spectrum
b.Spectrum Mean
c.Spectrum Indifference
Figure 5. Logarithmic Spectrum Curve
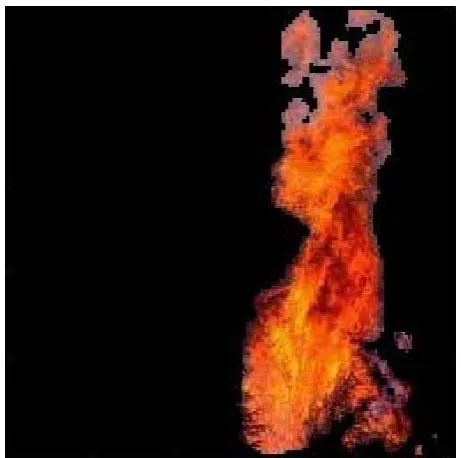
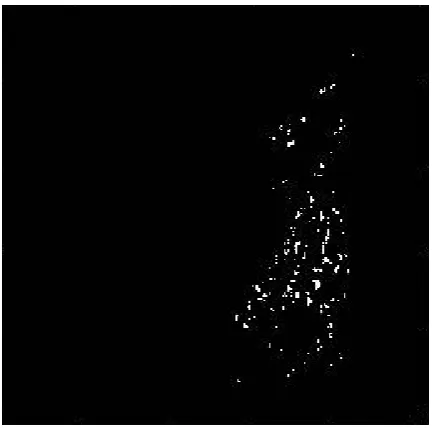
8)Pop-out salient region,Figure6: saliencyMap=ifft(Dn(f))
Figure 6. The Image Of The Visual Salience Regions
As shown in Figure 5, in the image spectrum curve, the abscissa represents frequency, amplitude represents the amplitude logarithm. Seen from Figure 5:C image spectrum difference curve, we can know that the image information contains a large number of redundant part and small change parts, and people’s vision is more sensitive to the change part. A basic principle of visual system is to suppress the response to frequent features, and keep sensitive to unconventional features.
III. SALIENT OBJECT EXTRACTION
Salient region generation can reduce the target monitored region, and it should be judged whether it is the smoke and fire according to the generated salient region low-level visual features.
Figure 8. Salient Object
CIELab color space is the color opposite space, L represents brightness dimension, a and b represent color opposite dimensions, which is a color model for visual conception. CIELab color space can describe human’s conception on color, which means observed two kinds of color difference degree can be measured with two Euclidean distance in CIELab color space[12]. XYZ space is needed for the transformation from RGB color space to CIELab color space, which can be shown from Formula 5 to 7.
1)Transformation from RGB to XYZ space:
⎥ ⎥ ⎥ ⎦ ⎤ ⎢ ⎢ ⎢ ⎣ ⎡ ⎥ ⎥ ⎥ ⎦ ⎤ ⎢ ⎢ ⎢ ⎣ ⎡ = ⎥ ⎥ ⎥ ⎦ ⎤ ⎢ ⎢ ⎢ ⎣ ⎡ B G R Z Y X 99 . 0 01 . 0 0 . 0 011 . 0 812 . 0 177 . 0 2 . 0 31 . 0 49 .
0
(6)
2)Transformation from XYZ space to CIELab space:
[
]
[
1/3 1/3]
3 / 1 3 / 1 3 / 1 ) / ( ) / ( 200 ) / ( ) / ( 500 008856 . 0 / ) / ( 3 . 903 008856 . 0 / 16 ) / ( 116 n n n n n n n n Z Z Y Y b Y Y X X a Y Y if Y Y L Y Y if Y Y L − = − = ≤ = > − = (7) 3)Use Euclidean distance between two points’ colors in CIELab space
2 1 2 2 1 2 2 1
2 ) ( ) ( )
(L L a a b b
ELab = − + − + −
Δ (8)
With k-means clustering algorithm, it can realize the object segmentation. With visual attention method, it can extract salient object. K-means[13]is a kind of indirect clustering method based on similarity measurement among samples, which belongs to unsupervised learning method. In the algorithm, k is the parameter, it has divided image(img)m*n pixels into k clusters to have higher similarity within the clusters and lower similarity among the clusters. Similarity calculation can be measured according to Euclidean distance of pixel CIELab value, as shown in Formula 8.
Which K-clusters belonging to salient target region after color space clustering is determined by saliency
worked as weight to measure. In the salient region with several segment clusters, when the t (t<k) cluster is larger than certain threshold in the statistical results, the salient object compose by clusters can be obtained, the specific steps can be shown as follows:
1)With K-means color clustering, nColors clusters can be generated, and marked the corresponding Idx for each image pixel. The image can be divided into multiple clusters, and each cluster can be represented as seg_object{1,nColors}:
Idx=kmeans(img,nColors);
2)Extract pixel class label in salient region: [r,c]=find(saliencyMap~=0);
p_labels=reshape(idx,m,n);
color_N(sub2ind(size(ncolor_N),r,c))=p_labels(sub2in d(size(p_labels),r,c));
3) Statistically the type of containing the elements in every label, as well as the number of occurrences of each element:
A=tabulate(ncolor_N(:));
4)Salient region’s label generated according with the rule of gray value greater salient value higher:
sum(i)=sum(i)+ncolor_N(x,y)*region(x,y); (x,y) is the Coordinates of the pixel,i<=nColors; 5)Set threshold:
sum(i)>=mean(sum(1:nColors)); 6) Generate salient object:
Saliency_object=sum(seg_object{1,i});
Ⅳ.FLAME DETECTION BASED ON SALIENT FEATURE POINT
It usually produces smoke and flame when fire occurs. The smoke color feature is not obvious, while that of flame is obvious ranging from red to yellow. According to [15]literatures, the flame pixel value should be complied with the following rules:
) , ( max
) , ( )
, (
) , (
) , ( 2
j i I
j i I M
j i bdip
B j i
B j i
∈ ∈
∑
−= (10)
bdip j i bdip
SaliencyPoint: (, )≥ (11)
Figure 9. Bdip Method Generated Salient Point
Figure 10. Salient Points Consistent With Color Features
With color RGB rules and Formula 4.1, it can find out those pixel points meeting the conditions among the salient pixel point in Figure9. With the experiment verification, when pixel region size(n) covered by n pixel points meting flame color feature and region size Sm covered by BDIP size(m) salient points meet the conditions in Formula 10, it can be judged that the salient target is flame, whereinλis the setted threshold. Formula 11 has shown the pixel region calculation method, wherein (i,j) is pixel coordinate. For the convenience of calculation, the ratio of monitored flame pixel point on
BDIP salient feature point has been adopted to measure detection efficiency.
)) min( ) (max( )) min( )
(max( i i j j
size = − × − (12) 5
. 0 1
0 ) ( )
(n ≥λsize m < λ < ,use λ =
size (13)
V. EXPERIMENTS
Figure 11. Flames Detection Of Four Kinds Of Video Frames
In order to illustrate the application generality of visual selective attention method in flame detection, the selected two data sets provided by Internet on forest and field flame images adopted in the experiments were respectively 935 image in FOTOSEARCH[17] and 4487 image in WILDFIRE[18]. Four kinds of images on hidden flame, smoke flame, occluded flame and multi-reactor flame were selected. Each class selected 100 images with the size of 256*256. When calculating time-space redundancy calculation, the single image window region used 3*3, and salient target cluster adopted 5 classes. When detection BDIP salient point, the filtering window used 4*4, and the experimental flame detection was shown in Figure 11.
In order to illustrate that adopting visual attention flame detection method can greatly reduce the detection range, the experiment has counted the number of video frame image pixels processed in each step. The smaller the pixel value, the fewer the detection range. Table 1 has listed the detection data statistical information, each class has selected the images listed in Figure 11 to have the calculation. We have found that some salient object pixels were far higher than the pixel numbers described in salient images, due to multiple segmentation clusters appeared in salient regions with similar color value obtained color space cluster. Therefore, the number of salient object pixels was more than that of salient image pixels.
TABLE I.
TEST DATA STATISTICAL INFORMATION
Type Imagepixels Salient region pixels
Salient object pixels
Salient point pixels
Flame point pixels
Detection P
sunshine 4096 1406 2856 1020 423 41.5%
smoke 4096 1052 2698 844 254 30.1%
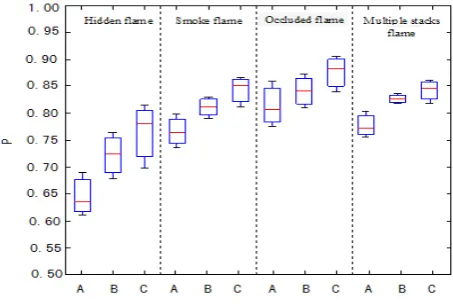
Figure 12. Four Kinds Of Flame Recognition Statistics
When the number of monitored flame point pixels reached half of salient point pixel number, it can be judged that the salient object was flame. In order to illustrate the effectiveness of the method in this paper, Figure12 has described four kinds of flame detection effectiveness, wherein A detection window was 5*5, B was 4*4, and C was 3*3. Flame detection rate of each class in C was the highest, which mainly because the salient generation process has adopted spectrum mean value filtering method. The bigger the filtering window, the unobvious the salient details.The detection salient feature points were influenced greatly.
Seen from Figure12, we can know that the detection rates of flames in different kinds were different, wherein that of occluded flame was the highest, and that of hidden flame was lowest. It was mainly because the occluded flame selected tree and grass flames. The color difference was great with weak defilade property and easy salient recognition. However, the hidden flame belonged to blind fire which was not easy to be find at the early stage of fire. The flame color feature value was not obvious, therefore, there were few monitored flame points.
In order to measure the detection accuracy, the experiment has adopted four kinds of images to test: smoke, sunrise, flame. The data set was constructed with the searched Internet pictures. Each class had 100 images with the size of 64*64. The mean value experimental results in each class were shown in Table 2. Among different object detection process in each class, the method in this paper can realize higher detection rate on flame object. It could better distinguish the sunlight with similar visual features with flame.
TABLE II.
STATISTICAL TEST DATA
VI. SUMMARY
At present, the fire monitoring under large scale complex environment adopts visual detection methods, while there is a large amount of data needs to be collected for video fire detection. How to real-timely find the abnormal fire information within visual domain range in huge video images is the key of researches. This paper has put forward visual selective attention method to monitor the fire under large scale complex environment, which can reduce detection objects and rapidly find the flame point. With visual time-space redundant spectrum method, the detection of rapid salient regions in field scene can be achieved. With the salient object extraction method based on the weight of color space cluster, the salient object can be generated. According to the salient feature points with BDIP extraction of flame color space distribution and color feature rules, the fire danger and fire behavior can be clear. The experiments have shown that adopting the research method in this paper in visual fire detection can improve the accuracy, and reduce the false alarm rate. Besides, it has better robustness on different kinds of flame object detection in field environment.
ACKNOWLEDGMENT
This work was supported in part by the Natutal Science Foundation under Grant 61101155, and Jilin Natutal Science Foundation under Grant 20101504.
REFERENCES
[1] Che-Bin Liu,Narendra Ahuja.“Vision Based Fire Detection”. 17th International Conference on Pattern Recognition (ICPR'04),vol. 4,pp.34-137, 2004
[2] Yuan Feiniu, Liao Guangxuan, Zhang Yongming. “Feature extraction on computer visual fire detection,” University journal of Science and Technology of China, vol.36,pp.39-43, 2006.(Chinese)
[3] Xu Yi, Yang Xiaokang, Song Li,Yu Zhou. “Fire detection methods: China. 201010109211[P],”Sep. 2010.
[4] Günay Osman, Taşdemir Kasım.Uğur Töreyin B. Çetin A, “Fire Detection in Video Using LMS Based Active Learning , ”Fire Technology, vol.46,pp.551-577,2010. [5] Yang Jun,Wang Runsheng. “Video flame detection
technology based on computer vision,” China Journal of image and graphics,vol.13,pp.1221-1234,2008 (Chinese) [6] Koch C,Ullman S. “Shift’s in selectio n in visual
attention:toward the underlying neural circuitry”. HumanNeurobiology ,vol.42,pp.19- 227,1985.
[7] Itti L,Koch C. “Feature combination strategies for saliency-based visual atten tion systems.Journal of Electronic Imaging, ”vol.10,pp:161-169, 2001.
[8] Aude Oliva, “Modeling the Shape of the Scene: A Holistic Representation of the Spatial Envelope,” International Journal of Computer Vision, vol.42,pp:145-175, 2001 [9] Xiaodi Hou,Liqing Zhang. “Saliency Detection: A Spectral
Residual Approach,” CVPR 2007
[10]R Achanta, S Hemami, F Estrada,S Susstrunk. “Frequency-tuned Salient Region Detection,” IEEE International Conference on Computer Vision and Pattern Recognition (CVPR), 2009.
[11]Alexander, Charles,Sadiku,Matthew. “The frequency
Type Image pixels
Salient region pixels
Salient object Pixels
Salient point Pixels
Flame point Pixels Hidden
flame 65536 12976 12002 4176 3486
Smoke
flame 65536 6326 16126 5008 3599
Occluded
flame 65536 6730 11719 3668 2303
and phases of the harmonics versus frequency”. McGraw-Hill,vol.3,pp.761, 2004.
[12]Smolka B,Plataniotis K N. “Venetsanopoulos A N.Nonlinear signal and image processing: theory,methods,and applications[M], ” Phoenix Lieb press 2004.
[13]Mantao Xu, Pasi Franti. “Delta-MSE Dissimilarity in Suboptimal K-Means Clustering,”17th International Conference on (ICPR'04).vol.4,pp.577-580,2004.
[14]Xiaodi Hou, Jonathan Harel. Christof Koch: Image Signature: Highlighting Sparse Salient Regions. IEEE Trans. Pattern Anal. Mach. Intell.vol.34,pp.94-201, 2012 [15]Horng W B,Peng J W,Chen C Y. “A new image-based
real-time flame detection method using color analysis, Networking,” Sensing and Contral Conference,pp.100-105. 2005.
[16]H. Yamagishi J, Yamaguchi A. “Contour fluctuation data processing method for fire flame detection using a color camera,” 26th Annual Conference of the IEEE Industrial Electronics Society,vol.12,pp. 824-829,2000
[17]http://www.fotosearch.com/photos-images/forest-fire.html [18]http://www.wildlandfire.com/Default.htm
Jun-ling Liu Ph. D. candidate at the College of Computer Science and Technology,Jilin University.Her research interest covers scenes recognition and vision attention.
Hong-Wei Zhao, a professor at the College of Computer Science and Technology, Jilin University. His research interest covers Embedded systems and cognitive computing. Corresponding author of this paper
Tian-Jiao Zhao Graduate of the College of Computer Science