VLSI Implementation of the DWT based
Arrhythmia Detection Architecture using
Co-Simulation
Vipin Sharma Manish Kumar Arya
M. Tech Scholar Assistant Professor
Department of VLSI Department of Electronics & Communication Engineering Hindustan College of Science and Technology, Mathura Hindustan College of Science and Technology, Mathura
Abstract
The main objective of this work is to get the exact ECG signal using different methodologies. The main focus of this work is to remove the interferences present in the ECG signal. Filters are used to remove the interferences present in the cardiac signal. Co-simulation is used to check the response of the signal in real time system. Filters are designed to remove the interferences such as power line with 60 Hz and baseline wander with 0.5 Hz. Co-simulation is the important task in this work because of the filter designing. High pass filter and low pass filters are used to remove the noises using Biorthogonal DWT technique. Biorthogonal DWT is one of the accurate methods to remove the interferences because of zero side lobes. The basic objective is to calculate the R-R wave interval in QRS complexes with heart rate measurement and also finds the R peak location.
Keywords: ECG, VLSI, DWT
________________________________________________________________________________________________________ I. INTRODUCTION
Heart is an important part of the human body. Heart diseases are the important factor which cause of death in the world. Heart diseases are not a disorder but these are the group of diseases which occur in the heart and in which the heart supplying to blood are blemish and not able to do work properly in a normal manner. For many years, it was believed that heart diseases only occur as age increases or simply to say that the tendency of diseases is more in older people. But now days, heart diseases are common in young people also, because of their lifestyle and devour habits. Heart diseases usually take many years to be cured [1].
There are different types of heart defects present in teenagers, which are called congenital heart diseases. Other types of heart disease consist of coronary heart disease, hypertension, stroke, arrhythmia and cardiac disease. The most common cause of heart diseases is atherosclerosis and hypertension means high blood pressure. Atherosclerosis is a condition in which there is deposition of cholesterol and fatty substances on the walls of arteries, while hypertension is the elevation of blood pressure in the arteries due to various reasons. There are different parameters that raise the risk of heart diseases and related conditions. These consist of age, gender, high blood pressure, high cholesterol levels and mental stress. Parameters like weight, blood pressure and cholesterol levels can be restrained by making proper diet and lifestyle changes to significantly improve cardiovascular health[1]. The use of the heart is to contract systematically and pump blood to the lungs for oxygenation and then pump this blood into the whole body. This electrical activity is transmitted throughout the body and can be monitored at the skin and can help predict many heart disorders. This is the principle behind ECG (Electrocardiogram) [2].
The potential difference between two points on the outer portion of the body is traced to get the ECG chart. There are two different measuring points between the left arm and the right arm. The two points and setting up the conventional positive direction for measuring the voltage called a Lead. There are 12 electrodes are used to measure the potential difference which are placed to outer surface of the body [3].
Compared to other biological signals, the acquisition of ECG signal is a challenging task. ECG voltage signal magnitude is very low the (in few mill volts) and has low frequency contents. The conventional bandwidth of the signal begins from 0.01 Hz and extends to no more than 250 Hz [2].
Another challenge in acquisition of ECG signal is the noises or interferences present in the body which are often order of magnitudes greater than the original ECG signal. These noises or interferences increase or change the magnitude of the ECG signals. Different filters are used to remove these noises or interference from the ECG signal. In this work, an ECG DSP system, which includes the preprocessing, event detection and monitoring of the signals, is designed [3].
II. SYSTEM OVERVIEW
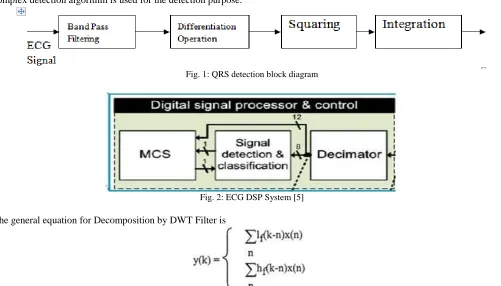
and only after that processing is done. Signals are taken from the heart then these signals pass from the filters and after that QRS complex detection algorithm is used for the detection purpose.
Fig. 1: QRS detection block diagram
Fig. 2: ECG DSP System [5]
The general equation for Decomposition by DWT Filter is
Where x(n) is the input signal, y(k) is the output signal and If and Hf are the decomposition wavelet filter pairs for high pass and low pass respectively.
Biorthogonal DWT filtering is done using MATLAB function after which the output is generated. Coefficients of the filter are calculated using FDA tool in MATLAB and then these coefficients are transferred to the equation or in the designed HDL filter. Filter used in this work is of order 3.
III. VERIFICATION
Pre-Processing Result:
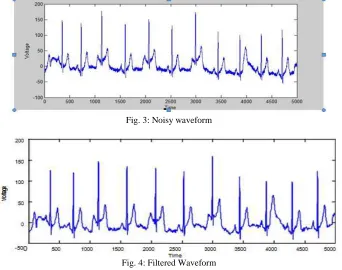
The person1’s filtered and noisy ECG database is taken from the ECG databank and then used to detect the Noise or to check the bit error rate. The filtered and noisy data is first loaded into MATLAB by converting into the .mat file. Fig 3 and 4 show the noisy and filtered waveform of the person1’s database in time-domain respectively.
Fig. 3: Noisy waveform
Fig. 4: Filtered Waveform
Bit Error Rate calculation of Noisy and Filtered Data:
Bit error rate is a method to calculate the number of error bits in the total number of bits. Two different signals of person1 are used to check the bit error rate or the number of error bits.
In this work, BER = 0.961, it means error rate is maximum, because error rate always lies between 0 and 1. Fig 5 shows the filtered output after passing through the HPF and LPF
0
Fig. 5: Filtered Signal
Results After using Biorthogonal DWT HPF and LPF:
Fig. 6: Noisy waveform of 114.dat signal
Fig 7 shows the filtered output after passing through Low Pass Filter with voltage levels with respect to time.
Fig. 7: Filtered signal after BPF
Fig 8 shows the final output of the ECG signal, when output of LPF is given to the HPF.
Fig. 8: Filtered output
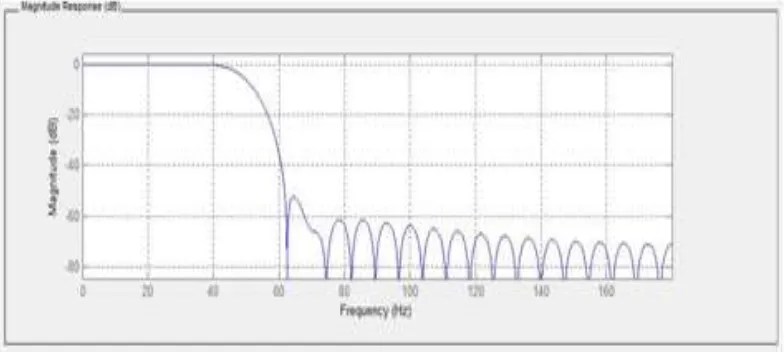
Response of the BSF and LPF:
BSP and LPF are the filtered used to filter the ECG data with hamming window technique. The response of the filter is drawn between Magnitude and frequency. This result shows the behavior of filter and the response of the filter generated by the FDA tool with cut off frequency 40 Hz for High Pass filter and cut off frequency 50 Hz for Low Pass filter.
Fig. 10: Response of LPF Direct Form
Result of different stages of DWT filtering:
Stage II:
Stage III
Stage IV
Simulation Results:
The simulation waveform in Fig shows the output waveform of high pass filter in decimal which is similar to the voltage levels of the 114.dat signal.
The simulation waveform in Fig shows the output waveform of the low pass filter in decimal where the input to the low pass filter is equal to the output of the high pass filter.
Output waveform of the HPF (in decimal value)
Output waveform of the LPF
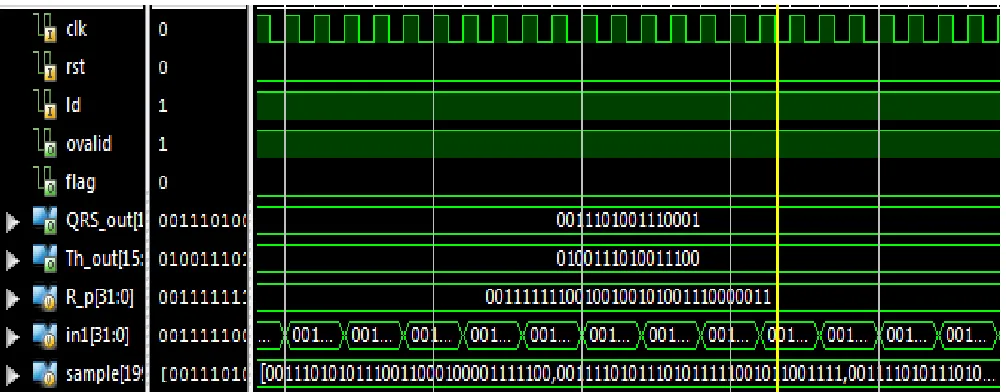
Final Result of Simulation:
Output waveform of the Co-simulation
Performance Evaluation:
Table – 1
Logic Utilization Biorthogonal DWT 1 D DWT Architecture DWT with DF Filter
Slice Registers 536 1224 196
LUTs 928 2657 192
IOBs 272 118 182
DSP48Es 8 32 64
It can be observed that the DWT design architecture using pipelined DF requires minimum number of slice registers and LUTs. The proposed design using Biorthogonal Wavelet requires 39.5% less LUTs, 69.5% less IOBs and 59% less DSPs than the 1D Architecture, whereas 45% less IOBs and 30% less DSPs as compared to pipelined DF Filters. This is a significant reduction since there are limited numbers of DSP48 slices on an FPGA and should be prudently used. The proposed design reduces the critical path to 90% on an average but requires more number of slice registers and LUTs. If we require high speed then we have to compromise to slightly more area.
IV. CONCLUSION
ECG is a biomedical process used in medical treatment for heart diseases. Heart diseases usually take many years to be cured. Heart diseases consist of coronary heart disease, hypertension, stroke, arrhythmia and cardiac disease etc. In general, ECG signals are used to check the electrical activity of heart or graphical representation of cardiac activity and it used to measure the various cardiac diseases and abnormalities present in heart.
Noises are the important factor which affects the ECG signal. Power line noise, baseline wander noise and Muscle contractions are the basic noises which interfere with the ECG signal. According to the literature survey, various filtering techniques are used to remove the noises. Out of these techniques, DWT filtering techniques are considered to be the most efficient way to remove the noises. Noise removal is the basic building block of the QRS complex detection. QRS complex detection is done in three steps Noise detection, Noise removal and QRS complex detection. MIT / BIH arrhythmias database has been used for the performance analysis.
The Noise detection is done by bit error rate measurement. In bit error rate measurement, two signals of the same type are used, out of which one is containing noisy signal and other is a filtered signal. Bit error rate is lie between 0 to 1, if the values of bit error rate are close to 1, then the presence of noise is maximum. Noise filtering is used to remove the noises which are present in ECG signal. There are various approaches like FIR, IIR and DWT filtering used to remove the interferences. Out of these approaches, DWT is used due to the less complexity, less memory and linear phase. Therefore, Biorthogonal DWT filtering technique is used to remove the noises with zero side lobes and less complexity. The 60 Hz power line interference and 0.5 Hz baseline wander noise is completely removed by this filter.
REFERENCES
[1] B. U. Kohler, C. Henning, R. Orglmeister, “The Principals of Software QRS Detection-Reviewing and comparing Algorithms for Detecting this important ECG waveform”, IEEE Engineering in Medicine and Biology, pp. no. 43-57, Jan-Feb 2002.
[2] Benmalek M, Charef A.’ “Digital fractional order operators for R-wave detection in electrocardiogram signal”, IET Signal Processing, vol. 3 pp.381-91, 2009.
[3] Berntson G, Bigger Jr J, Eckberg D, Grossman P, Kaufmann P, Malik M, Nagaraja H, Porges S, Saul J, Stone P, et al. Heart rate variability: origins, methods, and interpretive caveats. Psychophysiology, vol. 34, pp. 623–648, 1977.
[4] Berntson G, Bigger Jr J, Eckberg D, Grossman P, Kaufmann P, Malik M, Nagaraja H, Porges S, Saul J, Stone P, et al.” Heart rate variability origins, methods, and interpretive caveats. Psychophysiology”, Cambridge University Press, vol. 34, pp. 623–648, 1997.
[5] Bhogeshwar, S.S. Soni, M.K. Bansal, “Design of Simulink Model to denoise ECG signal using various IIR & FIR filters” Optimization, Reliabilty, and Information Technology (ICROIT), pp. 477-483, 6-8 Feb. 2014.
[6] C. Li, C. Zheng, and C. Tai, “Detection of ECG characteristic points using wavelet transforms,” IEEE Trans. Biomed. Eng., vol. 42, no. 1, pp. 21–28, Jan. 1995.
[7] Correia, S Miranda, J., Silva, L and Barreto, A. (2009): LabVIEW and MATLAB for ECG acquisition, filtering and processing, 3rd International Conference on Integrity, Reliability and Failure, Porto/Portugal, vol. , pp.1-4, 24 July 2009.
[8] G. M. Friesen, T. C. Jannett, M. A. Jadallah, S. L. Yates, S. R. Quint, and H. T. Nagle, “A comparison of the noise sensitivity of nine QRS detection algorithms,” IEEE Trans. Biomed. Eng., vol. 37, no. 1, pp. 85–98, Jan. 1990.
[9] G.B. Moody and R.G. Mark, “The MIT-BIH Arrhythmia Database on CD-ROM and software for use with it,” IEEE Computer Soc. Press, vol. 20, pp. 185-188, 1991.