Abstract— Image processing is at its high level today in which segmentation is major section. Segmentation is sometimes a difficult situation persisting with different conditions like shadow and illumination over a digital image. It leads to over segmentation in some cases where it is required to classify exactly succumbing with these conditions. The situation is same while trying to classify skin lesions in a digital image, so as to overcome this situation the existing algorithms are collectively implemented with set of features obtained by DCT/DWT. In this proposed algorithm Curvelet/wavelet features are obtained for a digital image and basing on the texture distinctiveness the lesion is classified into either malignant or normal. With this classification of skin effected area by percentage of area effected is obtained. While looking into the performance standards of this combined algorithm the accuracy of DCT is found to be more promising over DWT. The existing methods when compared yielded low accuracy with presented algorithm.
.
Index Terms— Melanoma, skin lesion, DCT, DWT, feature extraction
I. INTRODUCTION
Melanoma is a malignant tumor that starts in cells of skin. Malignant means that it can spread or metastasize to other parts of the body. The skin is the body’s largest organ. It protects from injury and ultraviolet (UV) light from the sun. The skin has 2 main layers namely the top layer, called as epidermis. The dermis is below the epidermis. The epidermis is made up of 3 types of cells: Squamous cells which are thin flat cells on skin surface, basal cells are round cells that lie under squamous cells. Melanocytes are found in between the basal cells. They make melanin, which is responsible for skin and eye color. Changes to cells in the skin can cause cancer. Different types of skin cells cause different cancers. When skin cancer starts in squamous cells or basal cells, it is called non-melanoma skin cancer. When cancer starts in melanocytes, it is called melanoma.
On the counterpart of conventional methods, a computer aided diagnosis of melanoma generally includes four major sections; image acquisition, border detection, feature extraction and classification either into normal or effected skin on set of features obtained by DCT and DWT. The latter two are major focus of the proposed algorithm
.
Fig1.skin cancer image segmentation the blue border in the second image is expert segmentation and red illustrates over segmentation
II. EXISTING METHOD
:TDLS:
Segmentation of skin lesion becomes difficult in the presence of shadows and bright areas caused by illumination variation. Without the correction of illumination this algorithm tends to identify areas with shadows as part of the skin lesion. The TD metric for skin texture distributions is small overall. Lesion texture distributions are dissimilar from other skin and lesion texture distributions, so the textural distinctiveness metric is small. The lesion is predominately white, meaning that the lesion texture distributions have lower TD metrics and darker pixels correspond to normal skin. Of course this algorithm is proved to be more efficient than its predecessors on the basis of performance metrics. Owning to shadows and bright areas over segmentation limited the algorithm. Thereby looking into issue a need to develop new algorithm has risen.
Fig2. Sequence of steps in TDLS algorithm
Efficient Skin lesion Classification Using
Texture Distinctiveness with DWT/DCT
RAVI SHANKAR AMIREDDI, P.G.Scholar, Department Of Electronics and Communication, University College of engineering, JNTU Kakinada, Andhra Pradesh,India.Smt.U.V.RATNA KUMARI, Assistant Professor, Electronics and Communication, University College of engineering, JNTU Kakinada, Andhra Pradesh, India.
III. PROPOSED METHOD:
Multi-Level Discrete Wavelet Transform
Discrete Wavelet transform (DWT) is a mathematical tool for hierarchically decomposing an image. The DWT decomposes an input image into four components labeled as LL, HL, LH and HH [9]. The first letter corresponds to applying either a low pass frequency operation or high pass frequency operation to the rows, and the second letter refers to the filter applied to the columns. The lowest resolution level LL consists of the approximation part of the original image. The remaining three resolution levels consist of the detail parts and give the vertical high (LH), horizontal high (HL) and high (HH) frequencies. Figure 3 shows three-level wavelet decomposition of an image.
Fig3.1 wavelet decomposition of image
A. Wavelet-based texture analysis of Skin Images:
In clinical diagnostic approaches (e.g. ABCD rule of dermoscopy and pattern analysis) dermatologists look into the visual differences within the lesion and also changes in the appearance of the lesion over the time.
Fig 3.2 wavelet based texture analysis
These visual characteristics can be captured through texture analysis. Wavelet-based texture analysis provides a multi resolution analytical platform which enable us to characterize a signal (an image) in multiple spatial/frequency spaces. The multi-scale characteristics of wavelet can be very useful since dermoscopy images are taken under different circumstances such as various image acquisition set up (lighting, optical zooming, etc) and versatile skin colors on disease effected analysis.
The 2D wavelet transform has been widely applied in image processing applications. There exists two wavelet structure; (1) Pyramid-structured wavelet transform which decomposes a signal into a set of frequency channels with narrower bandwidths in lower frequency channels, useful for signals which their important information lies in low frequency
Fig3.3 wavelet feature decomposition
components [8], (2) Tree-structured wavelet analysis which provides low, middle and high frequency decomposition which is done by decomposing both approximate and detail coefficients as shown in Figure. In dermoscopy
image analysis, the lower frequency components
reveal information about the general properties (shape) of the lesion, which is clinically important, and the higher frequency decomposition provide information about the textural detail and internal patterns of the lesion which is also significant in the diagnosis. Thus the decomposition of all frequency channels is useful in this application. Therefore, the tree-structured wavelet analysis can be more informative for classification of skin lesions.
B. Discrete Curve let Transform:-
The curve let transform is a very young signal analyzing method with good potential. It is recognized as a milestone
on image processing and other applications.
Fig4.1: Curvelet analysis of an image
The ridgelet transform is optimal at representing straight-line singularities. Unfortunately, global straight-line singularities are rarely observed in ral applications. To analyze local line or curve singularities, a natural idea is to consider a partition of the image, and then to apply the ridgelet transform to the obtained sub-images. This block ridgelet-based transform, which is named Curvelet transform.
Curvelet-based texture analysis in Skin Images
Actually the ridgelet transform is the core spirit of the Curvelet transform. An anisotropic geometric wavelet transform, named ridgelet transform, was proposed by Candes and Donoho.
Fig4.2 Block ridgelet –based transform
Fig4.3 Curvelet based skin classification
The ridgelet transform is optimal at representing straight-line singularities. Unfortunately, global straight-line singularities are rarely observed in applications. To analyze local line or curve singularities, a natural idea is to consider a partition of the image, and then to apply the ridgelet transform to the obtained sub-images.
The effort on edge enhancement has been focused mostly on improving the visual perception of images that are not clarity because of so many sub bands. Noise removal and preservation of useful information are important aspects of image enhancement. A wide variety of methods have been proposed to solve the edge preserving and noise removal problem for more improvement. Curve Lets are also playing a most role in many image-processing applications. The Curve Let decomposition of an image is performed by applying their performance was very slow; hence, researchers developed a new version which is easier to use and understand. In this new method, the use of the ridge let transform as a pre-processing step of curve let was discarded, thus reducing the amount of redundancy in the transform and increasing the speed considerably The first part of the tutorial reviews the motivation of “ Why Curve let Proposed ” and briefly reminds the history of tiling in time frequency space. Followed, the curve let transform structure is shown. The curve let transform can be decomposed with four steps: (1) Sub band Decomposition (2) Smooth Partitioning (3) Renormalization (4) Ridge let Analysis. By inversing the step sequence with mathematic revising, it is able to reconstruct the original signal which is called inverse curve let transform. There are some simulation experiments be shown for those three application respectively with comparison of wavelet transform and Curvelet transform.
A Co-occurrence matrix (CCM) by calculating how often a pixel with the intensity (gray-level) value i occurs in a specific spatial relationship to a pixel with the value j. By default, the spatial relationship is defined as the pixel of interest and the pixel to its immediate right (horizontally adjacent), but you can specify other spatial relationships between the two pixels. Each element (i,j) in the resultant CCM is simply the sum of the number of times that the pixel with value i occurred in the specified spatial relationship to a pixel with value j in the input image. The number of gray levels in the image determines the size of the CCM. At first the co-occurrence matrix is constructed, based on the orientation and distance between image pixels. For example; with an 8 grey-level image representation and a vector t that considers only one neighbor, we would find;
Energy: It is a gray-scale image texture measure of
homogeneity changing, reflecting the distribution of image gray-scale uniformity of weight and texture..
E=∑∑p(x, y) ^2 P(x, y) is the GLC M
Entropy:-Hence, for each texture feature, we obtain a
co-occurrence matrix. These co-occurrence matrices represent the spatial distribution and the dependence of the grey levels within a local area. Each (i,j) th entry in the matrices, represents the probability of going from one pixel with a grey level of 'i' to another with a grey level of 'j' under a predefined distance and angle. From these matrices, sets of statistical measures are computed, called feature vectors.
Contrast: Contrast is the main diagonal near the moment
of inertia, which measure the value of the matrix is distributed and images of local changes in number, reflecting the image clarity and texture of shadow depth.
Contrast
I=∑∑(x-y)^2 p(x,y)
Homogeneity: Measures the closeness of the distribution
of elements in the GLCM to the GLCM diagonal.
H = ∑∑ (p(x , y)/(1 + [x-y])))
Entropy: It measures image texture randomness, when
the space co-occurrence matrix for all values is equal, it achieved the minimum value.
S=∑∑p(x, y) log p (x, y)
Correlation Coefficient: Measures the joint probability occurrence of the specified pixel pairs.
C=∑∑((x- μx)(y-μy)p(x , y)/σxσy))
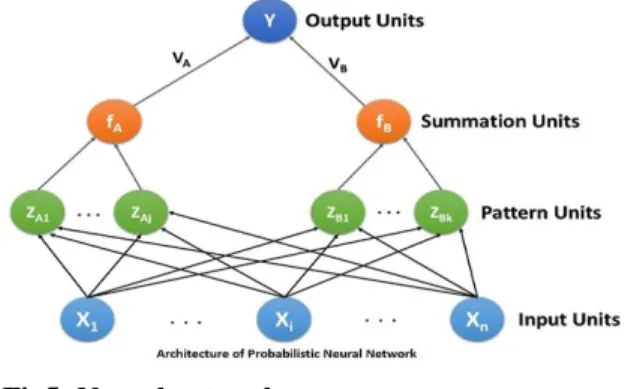
Neural Networks :
The network classifies input vector into a specific class because that class has the maximum probability to be correct. In this paper, the PNN has three layers: the Input Layer, Radial Basis Layer and the Competitive layer. Radial Basis Layer evaluates vector distances between input vector and row weight vectors in weight matrix. These distances are scaled by Radial Basis Function nonlinearly. Competitive Layer finds the shortest distance among them, and thus finds the training pattern closest to the input pattern based on their distance.
Fig5: Neural network [1] Input layer
[2] Each neuron in the input layer represents a predictor variable. In categorical variables, N-1 neurons are used when there are N numbers of categories. It standardizes the range of the values by subtracting the median and dividing by the interquartile range. Then the input neurons feed the values to each of the neurons in the hidden layer.
[3] The pattern neurons add the values for the class they represent.
I. Output layer
[4] The output layer compares the weighted votes for each target category accumulated in the pattern layer and uses the largest vote to predict the target category.
V.RESULT Analysis:-
Accuracy:-Accuracy is also used as a statistical measure of
how well a binary classification test correctly identifies or excludes a condition. That is, the accuracy is the proportion of true results (both true positives and true negatives) among the total number of cases examined. To make the context clear by the semantics, it is often referred to as the "rand accuracy. It is a parameter of the test.
Accuracy= (Tp+Tn)/(Tp+Tn+Fp+Fn) where Tp is true positive value and Tn is true negative value Fp is false positive and Fn is false negative value
Table I: COMPARISON BETWEEN DWT AND DCT
ON ACCURACY ANALYSIS
Specificity:-In medical diagnosis, test sensitivity is the
ability of a test to correctly identify those with the disease (true positive rate), whereas test specificity is the ability of the test to correctly identify those without the disease (true negative rate).
Specificity =Tn/(Tn+Fp), Sensitivity=Tp/(Tp+Fn)
TABLE II. COMPARISON OF DWT AND DCT ON SPECIFICITY ANALYSIS
VI. Comparisons between DWT and DCT on Performance Metric Analysis.
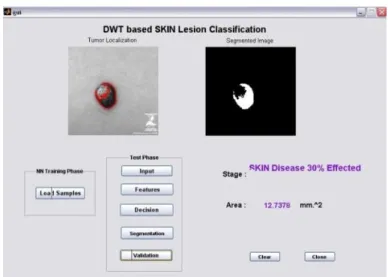
Fig6.1 skin classification without DCT/DWT The segmented image boundary area is calculated so as to
know the effectiveness of segmentation. Without DCT/DWT the boundary area calculated is not that much accurate
Fig6.2 Curvelet based skin classification
The segmented image boundary area calculated is accurate
when a Curvelet transform is employed thereby preventing over segmentation.
Fig6.3 wavelet based skin classification
Table III: The table illustrates performance metric comparison for without DCT/DWT, DWT and DCT for a 30 percent skin effected image
Performance metric Without DCT/DWT DCT DWT Specificity 50 99.61 99.6 Accuracy 50 98.44 90.4 Sensitivity 50 98.40 89.9 VII. CONCLUSION
On the counterpart of conventional methods which are
time taking, a computer aided diagnosis always serves the purpose of identifying the disease quick. In the case of skin cancers where the existing methods may not classify accurately owning to illumination variation and shadows in an image network classifier Hence a probabilistic neural network was used for classification based on unsupervised learning using wavelet and Curvelet statistical features and target vectors. The clustering was estimated from smoothing details of images accurately for effected skin disease segmentation. In addition with, the statistical features are extracted from co-occurrence matrix of detailed coefficients of segmented images. These features are useful to train a neural network for an automatic classification process. When the performance metrics are taken into consideration classification of skin basing on texture distinctiveness without any DWT/DCT yielded lowest results compared to DCT and DWT. Thereby a new proposed algorithm provided improved accuracy of segmentation and classification.
REFERENCES
[1].D.F. Sect, “Probabilistic Neural Networks for Classification, mapping, or associative memory”, Proceedings of IEEE International Conference on Neural Networks, Vol.1, IEEE Press, New York, pp. 525-532, June 1988.
[2].D.F. Sect, “Probabilistic Neural Networks” Neural Networks, vol. 3, No.1, pp. 109-118, 1990.
[3] Orr M.J.L., Hall am J., Murray A., and Leonard .T, “Assessing ruff networks using delve," International Journal of Neural Systems, vol. 10, issue 5, pp. 397-415, 2000
[4] L. A. Menial, A. H. Stolen, K. S. Erbium, L. L. Figaro, and J. M. Reinhardt, “Breast MRI lesion classification: Improved performance of human readers with a back propagation neural network computer-aided diagnosis (CAD) system.,” J. Man. Reason. Image. vol. 25, no. 1, pp. 89–95, 2007.
[5] M. L. Geiger, H. Al-Hallam, Z. Hue, C. Moran, D. E. Wolver ton, C. W. Chan, and W. Hong, “Computerized analysis of lesions in US images of the breast.,” Acad. Radial., vol. 6, no. 11, pp. 665–674, 1999.
[6]J. Platt. Fast training of support vector machines using sequential minimal optimization. pages 185–208, 1999.
[7] H. Zhang, L. Jiang, and J. Su. Hidden naive bayes. In Twentieth National Conference on Artificial Intelligence, pages 919–924, 2005.
[8] M. Dash and H. Liu. Feature selection for classification. Intelligent Data Analysis, 1:679–693, 1997.
[9] S. Patwardhan, A. Dhawan, and P. Relue. Classification of melanoma using tree structured wavelet transforms. Computer Methods and Programs in Biomedicine, 72:223–239, 2003.
[10].E. D. Bayle and I. Gluer, “Feature Extraction from Doppler Ultrasound Signals for Automated Diagnostic Systems”, Computers in Biology and Medicine, 35(9), 735–764, 2005.
[11] M. Samulski, R. Hopes, C. Bêtes, R. Muss, G. den Herten, and N. Karssemeijer, “Using computer aided detection in mammography as a decision support,” Eur. Radial., vol. 20, no. 10, pp. 2323–2330, 2010.
[12] Kernel, P., Bella, M., Rainer, S., Alan, D., Szold, T. and Janos, F.,“Application of neural network in medicine”, Diag. Med. Tech.,vol. 4,issue 3,pp: 538-54 ,1998.