The AERONET Version 3 aerosol retrieval algorithm, associated
uncertainties and comparisons to Version 2
Alexander Sinyuk
1,2, Brent N. Holben
2, Thomas F. Eck
3,2, David M. Giles
1,2, Ilya Slutsker
1,2, Sergey
Korkin
3,2, Joel S. Schafer
1,2, Alexander Smirnov
1,2, Mikhail Sorokin
1,2, and Alexei Lyapustin
25
1Science Systems and Applications, Inc. (SSAI), Lanham, MD 20706, USA 2NASA Goddard Space Flight Center (GSFC), Greenbelt, MD 20771, USA 3Universities Space Research Association (USRA), Columbia, MD 21046, USA Correspondence to: Alexander Sinyuk ([email protected])
10
Abstract. The Aerosol Robotic Network (AERONET) version 3 (V3) aerosol retrieval algorithm is described, which is based on the version 2 (V2) algorithm with numerous updates. Comparisons of V3 aerosol retrievals to those of V2 are presented, along with a new approach to estimate uncertainties in many of the retrieved aerosol parameters. Changes in V3 aerosol retrieval algorithm include: 1) a new polarized radiative transfer code (RTC) , which replaced the scalar RTC of V2, 2) detailed 15
characterization of gas absorption by adding NO2 and H2O to specify total gas absorption in the atmospheric column, specification of vertical profiles of all the atmospheric species, 3) new Bidirectional Reflectance Distribution Function (BRDF) parameters for land sites adopted from the MODIS BRDF/Albedo product, 4) a new version of the extraterrestrial solar flux spectrum, and 5) new temperature correction procedure of both direct sun and sky radiance measurements. The potential effect of each change in V3 on single scattering albedo (SSA) retrievals was analyzed. The operational almucantar retrievals of V2 20
versus V3 were compared for four AERONET sites: GSFC, Mezaira, Mongu, and Kanpur. Analysis showed very good agreement in retrieved parameters of the size distributions. Comparisons of SSA retrievals for dust aerosols (Mezaira) showed a good agreement in 440 nm SSA while for longer wavelengths V3 SSAs are systematically higher than those of V2 with the largest mean difference at 675 nm due to cumulative effects of both extraterrestrial solar flux and BRDF changes. For non-dust aerosols, the largest SSA deviation is at 675 nm due to differences in extraterrestrial solar flux spectrums used in each 25
version. Further, the SSA 675 nm mean differences are very different for weakly (GSFC) and strongly (Mongu) absorbing aerosols which is explained by the lower sensitivity to a bias in aerosol scattering optical depth by less absorbing aerosols. A new hybrid (HYB) sky radiance measurements scan is introduced and discussed. The HYB combines features of scans in two different planes to maximize the range of scattering angles and achieve scan symmetry, thereby allowing for cloud screening and spatial averaging which is an advantage over the principal plane scan that lacks robust symmetry. We show that due to 30
extended range of scattering angles HYB SSA retrievals for dust aerosols exhibit smaller variability with SZA than those of almucantar (ALM) which allows extending HYB SSA retrievals to solar zenith angles (SZA) less than 50° to as small as 25°. The comparison of SSA retrievals from closely time matched HYB and ALM scans in the 50° to 75° SZA range showed good agreement with the differences below ~0.005. We also present an approach to estimate retrieval uncertainties which utilizes the variability in retrieved parameters generated by perturbing both measurements and auxiliary input parameters as a proxy 35
for retrievals uncertainty. The perturbations in measurements and auxiliary inputs are assumed as estimated biases in aerosol optical depth (AOD), radiometric calibration of sky radiances combined with solar spectral irradiance, and surface reflectance. For each set of Level 2 Sun/sky radiometer observations, 27 inputs corresponding to 27 combinations of biases were produced and separately inverted and to generate the following statistics of the inversion results: average, standard deviation, minimum and maximum values. From these statistics, standard deviation (labeled as U27) is used as a proxy for estimated uncertainty 40
and a lookup table (LUT) approach was implemented to reduce the computational time. The U27 climatological LUT was generated from the entire AERONET almucantar (1993-2018) and hybrid (2014-2018) scan database by binning U27s in AOD (440 nm), Angstrom Exponent (AE, 440-870nm), and SSA (440, 675, 870, 1020 nm). Using this LUT approach, the uncertainty estimates U27 for each individual V3 Level 2 retrieval can be obtained by interpolation using the corresponding measured and inverted combination of AOD, AE, and SSA.
45
1. Introduction
The optical properties of particles in the earth’s atmosphere are measured or retrieved from numerous platforms including space-based, airborne (or suborbital) and surface-based monitoring instruments. Remote sensing of aerosol optical 50
properties is performed from all three of these instrument deployment platform types while in situ measurements are made from both airborne and surface-based platforms. Measurements from all three of these major categories of platforms of both remotely sensed plus in situ data, in conjunction with atmospheric modeling, will be required to more accurately and completely understand the global extent of variability in aerosol optical properties (Kahn et al., 2004). While satellite (both polar orbiting and geostationary) observations and retrievals are required for a full spatial understanding of aerosol properties, 55
the uncertainty of these retrievals is at times greater than required for some applications. Additionally, algorithm development for satellite retrieval of aerosol optical properties typically requires a highly accurate set of measurements from which to gauge the retrievals and include some a priori assumptions of particular properties of major aerosol types. The Aerosol Robotic Network (AERONET) (Holben et al, 1998) of globally distributed ground-based instruments has provided the basis for total column aerosol optical properties that are required for satellite validation purposes and for some algorithms the specification 60
of particular aerosol optical properties that must be assumed in the retrieval algorithms. Satellite validation has been mainly focused on aerosol optical depth (AOD) and accurate AERONET measurements of this parameter have been utilized for numerous satellite instruments and algorithms (Sayer et al., 2019; Sayer et al., 2018; Levy et al., 2013; Levy et al., 2015; Holzer-Popp et al., 2013; Lyapustin et al., 2018; Kahn et al., 2010; Limbacher et al., 2019; Ahn et al., 2014; Choi et al., 2018). Some satellite algorithms require that aerosol absorption be specified a priori, and some utilize AERONET retrievals of 65
imaginary refractive index and/or single scattering albedo (SSA) as the source of these regional values (Remer et al., 2005; Lyapustin et al., 2018). Additionally, some initial aerosol size distributions of basic types are required for some satellite retrievals of AOD and for some algorithms these have been developed or informed by analysis of AERONET retrievals (Remer et al., 2005; Holzer-Popp et al., 2013; Lyapustin et al., 2018). Furthermore, assessment of satellite retrievals of aerosol
absorption by Jethva et al. (2014), as parameterized by SSA, has been performed by comparison to AERONET retrievals of 70
SSA.
In order to assess the impact of aerosol on the earth climate system and compute aerosol radiative forcing, effective total column parameters are often required. AERONET measurements of AOD and retrievals of the size distributions and SSA are representative of the radiatively effective total column extinction weighted values. Kinne (2019a) has utilized the AERONET database of AOD and retrieved parameters in conjunction with models and satellite data to construct a monthly 75
global aerosol climatology. This aerosol climatology was then applied to compute global aerosol radiative forcing in Kinne (2019b). Additionally, analysis of aerosol black carbon in the global atmosphere and its effects on radiative forcing by Bond et al. (2013) utilized AERONET retrievals of SSA and imaginary refractive index as one of many individual data sets of the spatial distribution of aerosol absorption. A particular strength of the AERONET database in analysis of regional or global aerosol variability is that the instrumentation is consistent throughout the network with the same calibration standards applied 80
to all data, plus all of the data are processed with the same algorithms for the computation of AOD and the retrievals of all other aerosol parameters.
At each AERONET site the key instrumentation is comprised of an automatic sun and sky scanning ground-based radiometer that performs measurements of direct solar intensity and directional sky radiance distributions. AERONET sites are located at numerous locations worldwide on all continents and some oceanic islands (~500 sites in 2020). The automatic 85
tracking Sun and sky scanning radiometers (CIMEL Electronique CE-318) take direct Sun measurements with a 1.2° full field of view every ~5 to 15 minutes at 340, 380, 440, 500, 675, 870, 940, 1020 nm and 1640 nm (1640 nm excluded in older instruments). These solar extinction measurements are used to compute total column AOD at each wavelength except for the 940 nm channel, which is used to retrieve total column water vapor (or perceptible water) in centimetres (Schmid et al., 2001; Smirnov et al., 2004; Giles et al., 2019). The estimated uncertainty in computed AOD, due primarily to calibration uncertainty, 90
is ~0.010-0.021 for field instruments (which is spectrally dependent with the higher errors in the UV; Eck et al., (1999a)). In addition to AOD from direct sun measurements, the CIMEL collects sky radiance measurements in the almucantar geometry (fixed elevation angle equal to solar elevation, and ±180° azimuthal sweeps) at 440, 675, 870, and 1020 nm (nominal wavelengths with 380, 500 and 1640 nm added in newer instruments). Almucantar sky radiance measurements are made at optical air masses of 4, 3, 2, and 1.7 (75°, 70°, 60°, 54° solar zenith angle respectively) in the morning and afternoon, and once 95
per hour in between. The newest instruments also perform Hybrid scan measurements of directional sky radiances allowing additional retrievals below 50° to 25° SZA, which will be discussed more detail later in Section 4.
The spectral AOD combined with the spectral sky radiances measurements constitute the input datasets to AERONET aerosol retrieval algorithm. The algorithm was developed in Dubovik and King (2000b) and Dubovik et al. (2006) and retrieves column integrated aerosol size distribution and complex index of refraction. Other aerosol characteristics such as single 100
scattering albedo (SSA), absorption AOD, asymmetry factor, lidar and depolarization ratios are calculated from the retrieved aerosol parameters. The stable performance of the inversion algorithm was illustrated in sensitivity studies performed by (Dubovik et al., 2000a) where the perturbations of the inversion resulting from random errors, possible instrument offsets and
known uncertainties in the atmospheric radiation model were analyzed. Dubovik et al. (2000a) employed retrieval tests using known size distributions to demonstrate successful retrievals of mode radii and the relative magnitude of modes for various 105
types of bimodal size distributions such as those dominated by a sub-micron accumulation mode or distributions dominated by super-micron coarse mode aerosols. Based on this retrieval approach and an eight-year record of AERONET aerosol measurements, a climatology of the microphysical and optical properties of key aerosol types was developed (Dubovik et al., 2002). Over the years, AERONET aerosol retrievals have been widely used by the aerosol remote sensing community (e. g. Schuster G. et al., 2005, 2016; Xu F. et al., 2018; Chen Q. et al., 2019; Wang J. et al., 2018; Benkhalifa J. et al., 2017; Lee J. 110
et al., 2017; Qu Y. et al., 2017; Zhang Y. et al., 2017; Si Y et al., 2017).
Although very few direct comparisons of size distribution between in situ and AERONET retrievals have been published, several aerosol microphysical and optical parameters have been compared in specific regions: size of the fine mode aerosols (e. g. Schafer et al., 2019; Reid et al., 2005 (South America, southern Africa, and North America); Clarke et al., 2002 (pollution in the Arabian Sea)), size of larger sub-micron aerosols (e. g. Eck et al., 2010 (stratospheric aerosols); Reid et al., 115
2006 (sea salt), 2008a (desert dust); Smirnov et al., 2003 (maritime aerosol); Johnson and Osborne, 2011(Sahel region of West Africa)). These comparisons showed a reasonably good agreement between AERONET retrievals of size distribution and in situ measurements. For example, (Reid et al., 2005) showed that volume median diameters of the in situ versus the AERONET retrievals are often within ~0.01 m of each other. For aerosol absorption, Schafer et al. (2014) compared SSA derived from AERONET and in situ aerosol profiles measured by the NASA Langley Aerosol Group Experiment (LARGE) team in the
120
summer of 2011 during the coincident DRAGON-MD (Distributed Regional Aerosol Gridded Observational Network-Maryland) and DISCOVER-AQ (Deriving Information on Surface conditions from Column and Vertically Resolved Observations Relevant to Air Quality) experiments. Schafer et al. (2014) determined that the average SSA difference between LARGE in situ measurements and AERONET retrieval was ~0.01 with a maximum difference in SSA of 0.023, while all of the observed differences were within the combined stated uncertainty for the AERONET SSA retrieval and measurement
125
accuracies (0.03 for AERONET; 0.02 for LARGE).
The AERONET aerosol retrieval algorithm gradually evolved from its original version 1 (V1) to V2 though improving the modeling capabilities of aerosol and land/atmosphere system while keeping the inversion module of the algorithm intact. The first major advancement in V2 as compared to V1 was the refinement of surface reflectance model. In V1 the reflectance was assumed to be isotropic and invariant geographically, with reflectance values of 0.03, 0.06, 0.20, and 0.20 for the 440-, 130
675-, 870-, and 1020-nm wavelengths, respectively. Bright soil and sand surfaces have much higher spectral reflectance than the values assumed in V1 retrievals which resulted in large errors in prescribed surface reflectance affecting the accuracy of retrieved aerosol parameters including single scattering albedo (Sinyuk et al., 2007). In V2, bidirectional reflectance distribution function (BRDF) models were utilized that allow for dynamic reflectance as a function of solar zenith angle over land and water (e. g. Eck et al., 2008). Over the ocean, the Cox and Munk (Cox and Munk, 1954; Nakajima and Tanaka, 1983) 135
model approximates the water BRDF as a function of wind speed and over the land the Li-Ross model (e. g. Lucht and Roujean, 2000) was applied. The land BRDF parameters were adopted from MODIS generic ecosystem type models and mixed by the
ecosystem map of Moody et al. (2005). The second major improvement in V2 was related to the modeling of aerosol microphysics. V1 provided two types of aerosol retrievals for each set of input data: one obtained by modeling aerosol particles as homogeneous spheres and another using a model of randomly oriented spheroids, with either of them to be selected using 140
external information such as Angstrom Exponent (AE). In V2 the aerosol is modeled as a mixture of spherical and non-spherical particles with the percentage of non-spherical aerosols in the mixture as a new retrieval parameter (Dubovik et al., 2006). The comparison of V1 and V2 aerosol retrievals (Eck et al., 2008) showed improved accuracy of size distribution and SSA retrievals for both fine and coarse mode dominated aerosols. For example, the V1 artificial bimodality in the coarse mode size distribution retrieved for dust aerosols was largely eliminated in V2. Also, in V2 the quality assurance criteria of V1 were 145
revised and extended to help improve the accuracy and quality of the retrieved aerosol parameters (Holben et al., 2006). The principal reasons for updating the V2 aerosol retrieval algorithm to a newer version were to further improve the modeling capabilities and extend them to a larger number of applications. For example, both V1 and V2 employed a scalar radiative transfer code (RTC) which restricts applicability of the retrieval algorithm to intensity measurements in the visible and infrared parts of spectrum. For accurate modeling of atmospheric radiation in the UV or application of the retrieval 150
algorithm to polarization measurements, the scalar RTC needed to be replaced by a vector code. Additional improvements involved more accurate characterization of gaseous absorption. In V1 only the absorption by ozone (O3) was accounted for at 675 nm due to its considerable contribution to the total absorption with optical depth of ~ 0.012. Another atmospheric gas which can potentially affect the SSA retrievals at 440 nm is nitrogen dioxide (NO2). NO2 is primarily emitted from the burning
of fossil fuel. NO2 in the lower atmosphere forms principally from emissions from cars, trucks and buses, power plants, and
155
off-road equipment, and in lower concentrations from biomass burning. For some AERONET sites, the NO2 absorption AOD
at 440 nm is comparable or even exceeds 675 nm absorption AOD of O3. For example, at the Beijing site (China) the maximum
NO2 absorption AOD in December/January exceeds that of O3 absorption in April (in parentheses): ~0.016 (~0.014).
Accurately accounting for water vapor (H2O) absorption at 1020 nm is important due to the fact that optical depth of water vapor can be as high as ~ 0.01 at sites where the column water vapor is very high, even for moderate and small values of water 160
vapor, its contribution to the total absorption can be substantial due to the small 1020 nm AOD for fine mode dominated aerosols and low 1020 nm absorption by dust. In addition, specifying the vertical extinction/absorption profiles for all the atmospheric species can be beneficial especially at short visible wavelengths and UV.
The assessment of the accuracy of aerosol parameters retrieved by the AERONET algorithm was presented in Dubovik et al. (2000a). The investigation was a series of sensitivity studies for sets of predefined aerosol models for three main aerosol 165
types: water soluble, biomass burning, and dust with input uncertainties due to random errors, instrumental offsets, and known uncertainties in atmospheric radiation modelling. The accuracy of wavelength dependent aerosol parameters (real and imaginary parts of refractive index and SSA) was analyzed by Dubovik et al. (2000a) for only one wavelength (440nm) and a fixed value of SZA (600), while applicability of the results to the 500-700 range of SZA was further assumed. Also, the AOD dependence of uncertainties were analyzed for only two AOD ranges for water-soluble aerosols (smaller and greater than 0.2) 170
Dubovik et al. (2000a) by including all the inversion wavelengths and also analyzing the results to a much wider range of both AOD and SZA.
This paper describes the changes and additions to the V3 aerosol retrieval algorithm as compared to that of V2, along with a new approach for estimating the uncertainties of retrieved aerosol parameters. The paper is organized as follows: Section 175
2 describes changes and additions to V3 aerosol retrieval algorithm. In Section 3, we present analysis of the potential effects of each change and addition on the retrieved aerosol parameters, plus comparison of almucantar scan retrievals of aerosol properties from V2 to those of V3. A new measurement protocol (called the Hybrid scan) which increases the SZA range over that of almucantar for small SZAs and allows a robust spectral radiance symmetry check to be performed is discussed in Section 4. Section 5 presents a new method to estimate the uncertainties of the retrieved aerosol parameters. The final section 180
presents summary and conclusions.
2.
Version 3 retrieval algorithm description.Scalar radiative transfer theory can be used to calculate radiances for an aerosol laden atmosphere in the visible part of the electromagnetic spectrum (e. g. Kattawar et al. 1976). However, at shorter wavelengths due to an increasing contribution 185
of molecular scattering, neglecting the effects of polarization results in errors that may be too large for some practical applications (Mishchenko et al. 1994). In Version 3 (V3) of the AERONET aerosol retrieval algorithm a new polarized radiative transfer code (RTC) SORD (Korkin et al., 2017) replaced the scalar discrete ordinate RTC of Nakajima and Tanaka (1986) utilized in Version 2 (V2). SORD allows accurate simulations of atmospheric radiation in a wide spectral range using the method of successive orders of scattering. The code was extensively tested using 52 benchmark scenarios providing 190
accuracy of ~0.1% for both intensity and polarization calculations. Unlike V2 RTC whose speed was boosted by employing the truncation approximation of Nakajima and Tanaka (1988), no such approximation is used by SORD due to the potential problems it can cause in the forward scattering direction (e. g. Korkin et al., 2012).The NASA Center for Climate Simulation (NCCS) at the NASA Goddard Space Flight Center (GSFC) Discover cluster is utilized to overcome the significant increase
in computational resources required for the application of SORD in AERONET retrievals
195
(https://www.nccs.nasa.gov/systems/discover).
With SORD enabling accurate modeling of atmospheric radiation at short wavelengths the retrieval of aerosol absorption in UV is possible by adding the 380 nm channel to the standard AERONET spectral range (440 – 1020 nm). The aerosol absorption in the UV became the subject of substantial interest in recent years due to the strong absorption of UV radiation by fine mode aerosol (e. g. Corr et. al, 2009). For example, a strong increase of smoke aerosol absorption in the UV 200
wavelengths was observed by Mok et al. (2016) and explained by the presence of brown carbon in aerosol composition. Also, dust aerosols exhibit significant absorption with decreasing wavelength in the visible and UV (e. g. Sokolik and Toon, 1999; Sinyuk, et al., 2003). AERONET can contribute to better understanding of aerosol absorption in UV by providing absorption estimates at numerous locations with varying aerosol types.
Employing the SORD polarized RTC provides the potential of adding polarization measurements (e.g., CIMEL 205
CE318-DP sun-photometer) as input to the inversion. Recent publications show that combining intensity and polarization measurements in one dataset improves the accuracy of retrievals of the real part of refractive index of fine mode aerosols and the shape of aerosol particles but has a little effect on aerosol absorption and size (Li, et al., 2009; Fedarenka, et al., 2016). As of now (2019) AERONET does not widely acquire polarization measurements primarily due to the long time interval of measurement acquisition (thereby creating large temporal gaps in the AOD time series) and the lack of clear understanding 210
regarding the optimal set of spectral channel polarization measurements to be used. Additional research is required to determine the optimal number of the observational angles and spectral channels needed to reduce the acquisition time of these measurements.
The AERONET V3 aerosol inversion algorithm is the same as the one employed in V2 and is described in Dubovik and King (2000b) and Dubovik et al. (2006). However, V3 incorporates a detailed characterization of gas absorption, which 215
was neglected in V2 and previous versions. In addition to ozone (O3) absorption, V3 also accounts for that of nitrogen dioxide (NO2), and water vapor (H2O) to specify total gas absorption in the atmospheric column. Ozone optical depth is determined utilizing the total column Total Ozone Mapping Spectrometer (TOMS) monthly average climatology (1978–2004) of O3 concentration at 1.0° by 1.25° spatial resolution, the O3 optical air mass using O3 scale height adjustment by latitude (Komhyr et al., 1989), and the O3 absorption coefficient of Burrows et al. (1999). Similarly, the nitrogen dioxide optical depth utilized 220
as input to the V3 retrieval is from the total column Ozone Monitoring Instrument (OMI) monthly average climatology (2004– 2013) of NO2 concentration at 0.25° by 0.25° spatial resolution and the NO2 absorption coefficient of Burrows et al. (1998). Total column water vapor amount is determined from the AERONET CIMEL instrument 940 nm channel retrievals (Schmid et al., 1998).
In V2 the atmosphere was modelled as a plane parallel homogeneous layer. While for the almucantar (ALM) 225
observation geometry this is a reasonable assumption (e.g. Dubovik and King, 2000b; Torres et al., 2014), for other geometries the sensitivity to vertical structure of aerosol and gases in atmosphere can be important, especially at shorter wavelengths with relatively large Rayleigh scattering. For example, the effect of aerosol vertical distribution on aerosol parameters retrieved from ALM and principle plane (PP) observations was analyzed in (Torres et al., 2014). It was shown that PP retrievals are
stronger affected by assumptions on aerosol vertical distribution than those of ALM. In V3 vertical profiles of all input
230
atmospheric species are specified. Daily spectral aerosol extinction profiles are obtained from MERRA-2 (Gelaro et al., 2017) global assimilation model simulations, which utilize CALIOP (e. g. Winker et al., 2007) aerosol vertical profile measurements. The vertical absorption profiles for O3 and H2O are specified using data of MERRA-2, and NCEP/NCAR Reanalysis data respectively, which are acquired from the NOAA National Weather Service NOMADS NCEP server (e. g. Saha et al., 2010). The data to characterize typical tropospheric and stratospheric NO2 profiles were obtained from Vlemmix et al. (2015) and 235
Kerzenmacher et al. (2008) respectively. The aerosol extinction, O3, NO2, and water vapor profiles are reported at 73, 73, 20, and 9 atmospheric altitudes respectively. In SORD, they are rescaled to the same grid used for optical depth integration (Korkin et al., 2016).
The surface reflection in SORD is modeled by two Bidirectional Reflection Functions (BRDF): the Cox-Munk model over water by Nakajima and Tanaka (1983) and the Ross-Li model (e. g. Lucht and Roujean, 2000) over land. BRDF models 240
are important for computing the solar zenith angle dependent spectral reflectance throughout the day. For mixed water/land surfaces the two BRDF models are mixed using the percentage of land and water within a 5 km radius circle centered at each AERONET site. The land/water percentage is determined using MODIS/Terra Land Water Mask. Cox-Munk calculations use near surface wind speed from NCEP/NCAR Reanalysis data. The procedure of assigning parameters to the Ross-Li model in V3 is rather different than before. In V2, the land BRDF parameters for each site were determined using the maps of ecosystems 245
types combined with generic BRDF parameters (courtesy of Feng Gao) assigned to each ecosystem type, and gap filled MODIS black sky albedo product (Moody et al., 2005). For each AERONET site the BRDF parameters were averaged over all the ecosystem types within a 5 km radius circle and the resulting BRDF was normalized by the MODIS black sky albedo. Since new BRDF products recently became available, V3 BRDF parameters for land sites are adopted from the MODIS BRDF/Albedo CMG Gap-Filled Snow-Free Product MCD43GF V005 (see link at the end of publications list). Both V2 and 250
V3 BRDF land parameters were aggregated into a climatology to apply to all years prior to and after the BRDF data availability interval of 2002-2004 for V2 and 2003-2013 for V3. Near-real-time Ice and Snow Extend (NISE) from the National Snow and Ice Data Center by Nolin et al. (1998) and MODIS snow cover map by Hall et al. (2002) are used to account for the BRDF of snow and/or ice.
In order to improve the overall quality of observations V3 employs a temperature correction of both AOD and sky 255
measurements applied to account for the The correction procedure and examples of its application are presented in detail in Giles et al. (2019). Note that in V2 only the solar (not sky) 1020 nm channel was corrected for temperature (using a constant nominal value), while in V3 all non-UV channels are corrected for temperature variation, typically using characterization of the temperature sensitivity of each individual instrument. Also, in V3 a newer version of the extraterrestrial solar flux spectrum (Coddington et al.,2016) replaced the older version (ASTM, International, 2007). The inversion procedure, aerosol 260
parametrization, and the set of retrieved aerosol parameters are the same as those of V2 and described in detail in Dubovik and King (2000b) and Dubovik et al. (2004, 2006).
3.
Comparison of AERONET V3 to V2 aerosol retrievals.The described changes and additions to the V3 aerosol retrieval algorithm, RTC code and data inputs influence the 265
aerosol retrieval results. This section analyzes the effect these changes have on the V3 inversions by first examining the potential effect of each particular change and then comparing aerosol retrievals from V2 and V3.
3.1The effect of changes in input BRDF.
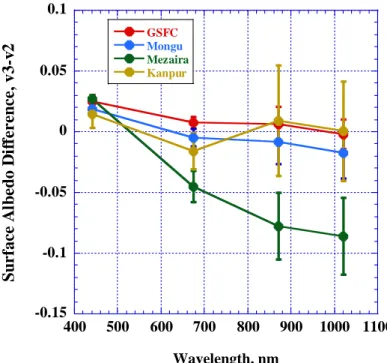
Figure 1 shows the difference in the black sky surface albedo calculated with Ross-Li BRDF function using 270
- urban/forest, Mezaira (United Arab Emirates) - desert, Mongu (Zambia) – treed savanna, and Kanpur (India) – semiarid/urban with strong seasonality. Figure 1 shows reasonably good agreement among average values of surface albedo for non-desert sites with maximum difference of ~0.025. For desert, the agreement is good at 440 nm but decreases with increasing wavelength reaching maximum of ~0.085 at 1020 nm. This discrepancy can be explained by the difference in the 275
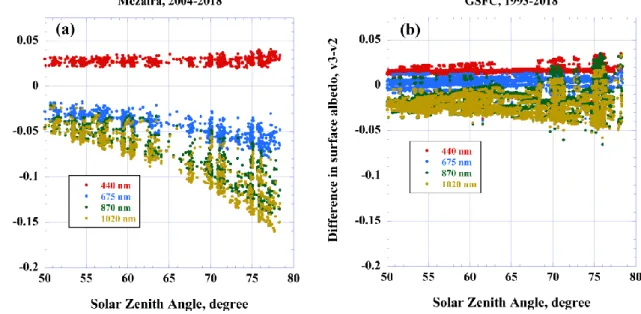
angular shape of the BRDF functions in V2 and V3 as illustrated in Fig.2a, which presents the difference in surface albedo as a function of solar zenith angle (SZA) for Mezaira. Figure 2a shows that the surface albedo difference at 440 nm does not exhibit any substantial SZA dependence and therefore can be explained by the difference in the reflectance magnitude. For longer wavelengths, the SZA dependence of the surface albedo difference is much stronger resulting in maximum variability from -0.05 to -0.16 at 1020 nm and can be explained by the BRDF of V2 being more anisotropic than that of V3. For non-280
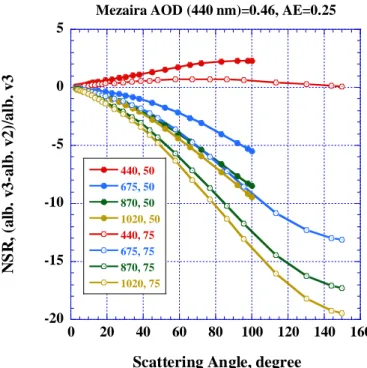
desert sites the difference in BRDF angular shape is less significant as illustrated by Fig. 2b for the GSFC site, showing albedo differences within ±0.05 which is the reported uncertainty of the MODIS BRDF product (Wang et al., 2018). The large difference in surface albedo for desert sites has the potential for influencing retrievals of single scattering albedo (SSA) at longer wavelengths. Figure 3 illustrates the sensitivity of normalized sky radiances (NSR) to the changes in BRDF parameters. The NSR constitute the input to the inversion code and defined as the measurements divided by extraterrestrial 285
solar flux and multiplied by π. The calculations are made for two values of the SZA (50° and 75°) using dust aerosol
parameters retrieved at the Mezaira site when the AOD at 440nm is 0.65 and the Angstrom Exponent (440-870nm) is 0.25. As is seen from Fig.3, the BRDF effect on NSR at 440 nm is moderate and decreasing with increasing SZA (~2.0% to ~ 0.9%). For longer wavelengths the relative difference of NSR is larger reaching −8.8% and −16% at 1020 nm for SZA 50 and 75 degrees respectively.
290
3.2Effects of changes in Extraterrestrial solar flux and temperature correction.
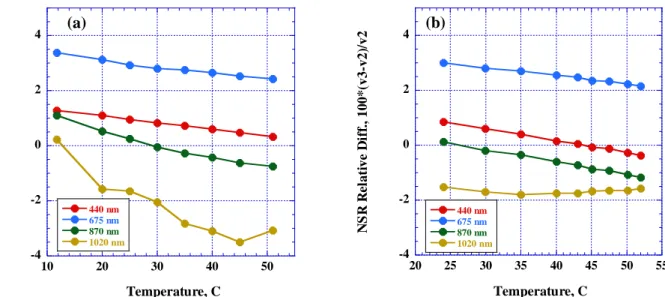
Figure 4 shows the relative difference between the extraterrestrial solar fluxes of V2 and V3 for the four standard sky wavelengths of the AERONET retrievals. The agreement is reasonable (differences of ~1% or less) at most of the wavelengths except 675 nm where the difference is anomalously large (~3%). Figure 5 shows the combined effects of both changes in solar 295
flux and application of the temperature correction of sky radiances on NSR for two instruments, No 721 and 1026 which were deployed at the Mezaira site in 2013-2014 and 2017-2018 respectively. Each point corresponds to an individual observation
taken at specific value of the sun photometer sensor head temperature. In addition to temperature, part of the difference is due
to solar flux changes and accounting for NO2 and water vapor absorption in V3. For example, at 675 nm the ~ 3% bias is mostly due to differences in solar flux. The change in temperature dependence of the difference is due to the improved 300
temperature correction in V3 (Giles et al., 2019). As is seen from Fig. 5a, the largest temperature correction effect is for 1020 nm which is the most temperature sensitive channel (Holben et al., 1998). At the same time for instrument 1026, the 1020 nm NSR difference is almost temperature neutral. The reason is that instrument 1026 is the latest version –T instrument equipped with new model of filters (Iridian) which is much less temperature sensitive than older filter models (Barr, Spetragon, POC) utilized in older versions of CIMEL instruments. Subtraction of the solar flux offset (V3 versus V2) in the case of 1026 305
instrument gives a maximum NSR difference of ~ 1.3% at 440 nm and less than 1% at 1020 nm. For instruments of older versions, the effect of temperature correction is expected to be larger than for those of Version-T, however, the specific numbers will vary from instrument to instrument.
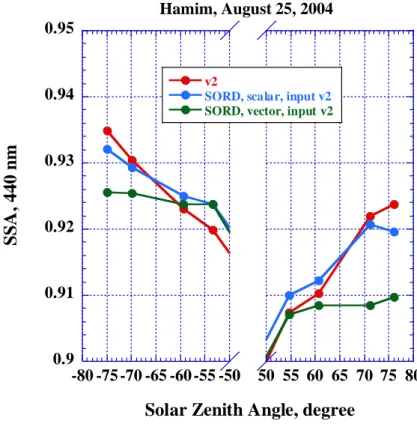
3.3 Joint effects of temperature correction, solar flux and BRDF on retrievals of SSA, case study. 310
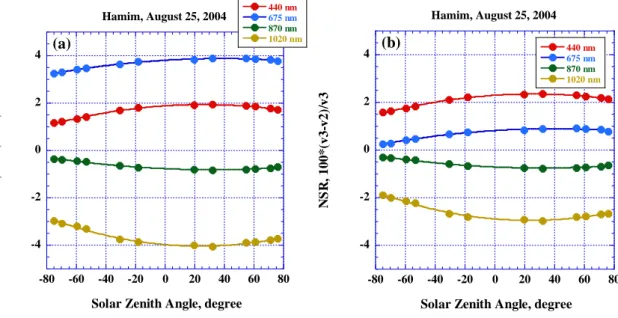
The joint effect of the above factors on aerosol retrievals is illustrated by a case study of diurnal variability of dust SSA retrieved at the Hamim AERONET site on August 25, 2004 during the UAE field campaign (e. g. Reid et al., 2008b). This site is located in a desert region in the United Arab Emirates and is in proximity to several dust aerosol sources. This particular day was selected due to a combination of very stable AOD level (0.486±0.016) and very stable 440-870 nm Angstrom Exponent (0.22 ±0.01) which makes an assumption of the stability of aerosol properties throughout the day reasonable. Also, 315
a large temperature gradient (29.1 - 47.8 C), especially in the morning, makes an analysis of the diurnal variability of the temperature correction possible. Figure 6a shows the dependence of the difference in NSR on solar zenith angle where negative values correspond to the morning and the positive ones to the afternoon. On Figure 6b the effect of solar flux is subtracted so the variability is due to difference in temperature correction and BRDF only. Figure 6a shows the total range of the variability of NSR difference is within ~ ±4% for 675 and 1020 nm. Comparison of Figures 6a and 6b shows that the 675 nm channel is 320
primarily affected by changes in solar flux while the difference at 1020 nm is mostly due to the temperature correction. The diurnal variability of NSR difference at 1020 nm shows clear dependence on SZA, reaching a maximum absolute value in the early afternoon when the instrument sensor head temperature is maximal. The NSR difference at 440 nm and 870 nm are the least affected by solar flux values due to their similarity in both graphs of Figure 6. In addition, comparison of Fig. 6a and Fig. 6b shows that the difference due to the temperature correction at 440 nm is partially compensated by the change in solar flux 325
while at 675 and 1020 nm the both factors work in the same direction.
In analysis of the effect of the changes implemented in the V3 aerosol retrieval algorithm on SSA retrievals from almucantar scans the following approach was used. It consists of generating three different input files for each set of measurements. The NSR and BRDF data of the first input file (1st) are identical to those of V2. The second input file (2nd) differs from the first one by replacing V2 NSR with those of V3 and in the third input file (3rd) both NSR and BRDF parameters 330
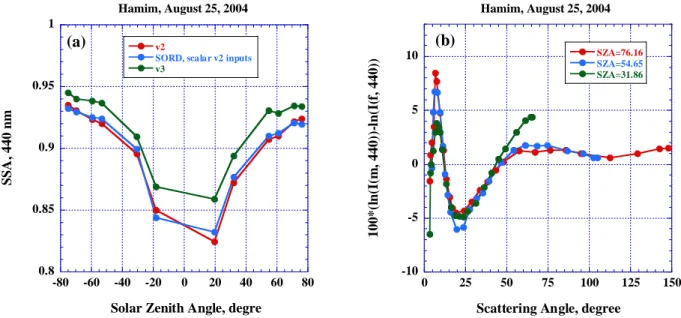
are replaced, utilizing only V3 inputs. These input files are then combined with SORD in different modes, scalar or vector, which allows for analysis of the effects of accounting for polarization on retrieval results. All the combinations are inverted, and retrieval results are compared to each other allowing for analysis of sequential changes in retrieved SSA values as individual changes in input data take place. Fig.7a compares the diurnal variability of SSA retrieved by the V2 retrieval algorithm and that of V3 with the 1st file as an input and SORD in the scalar mode. The comparison shows a good agreement 335
between two sets of retrievals with maximum difference of ~0.0074 at SZA 19.50. The diurnal variability of SSA retrieved by version three V3 is also shown.
A distinct feature of Fig.7a is a sharp decrease in the retrieved SSA for SZA smaller than 500. This partially can be explained by the decrease in the range of the scattering angles as SZA decreases in which case the solution becomes less stable
with respect to both random noise and biases. However, the systematic decrease in retrieved SSA with SZA implies presence 340
of a bias which itself is SZA dependent. The recent analysis of Sinyuk et al. (2015) showed that this bias could be related to the accuracy of the model of randomly oriented spheroids at small scattering angles. This model was originally proposed by Mishchenko et al., (1997) for modeling of light scattering by non-spherical dust aerosols, was further developed in Dubovik et al. (2002, 2006) and is currently employed by the AERONET aerosol retrieval algorithm. The model was proved to be successful in interpreting the results of laboratory measurements of the light scattered by non-spherical aerosols in the 345
backscattering direction (Dubovik et al, 2006). However, careful inspection of the fitting of the laboratory measurements by the model shows that it underestimates measured intensity at small scattering angles in the range centered at ~ 70 (e. g. Lenoble et al., 2013, p. 49, Fig. 2.18, left upper panel). The influence of this bias on the accuracy of SSA retrievals depends on SZA through the range of scattering angles with the maximum scattering angle for almucantar geometry being double of that of SZA. For large SZA the effect of the bias is counterbalanced by the fit at the large scattering angles where the spheroidal 350
model is accurate. In these cases, the bias is not or just partially fitted by retrieval code and has little effect on the accuracy of SSA retrievals. However, with decreasing range of the scattering angles the contribution of the bias to the fitting of NSR increases and with no measurements constraining the solution at larger scattering angles it pushes the retrieved SSA lower. This reasoning is illustrated by the Fig. 7b which shows the relative difference between measured and fitted angular NSR as a function of scattering angle for the three values of SZA. In particular, all curves exhibit a peak in the vicinity of ~ 70 where 355
the fit underestimates the measurements. The magnitude of the peak is decreasing with decreasing of SZA corresponding to more accurate fit of the bias. Also, a decrease in fitting accuracy for the smallest SZA at larger scattering angles (>500) can be seen.
Figure 8 shows the diurnal variability of SSA retrieved at 440 nm for SZA greater than 500, a limit which is a key quality control for Level 2 almucantars (Dubovik et al., 2000a; Holben et al., 2006). The results are presented for three different 360
combinations of SORD and inversion inputs listed in the figure captions. As is seen from the figure, the SSA retrievals by both algorithms under the same conditions (scalar RTC) exhibit noticeable SZA dependence. Switching to the vector mode in V3 retrieval code reduces the SZA dependence of SSA retrievals in both morning and afternoon. This can be explained by the higher accuracy of vector RTC in situations with substantial contribution of molecular scattering. In this particular Hamim case, the Rayleigh optical depth at 440 nm comprises ~ 32% of the total optical depth which together with strong polarization 365
of molecular scattering makes accurate accounting for polarization important.
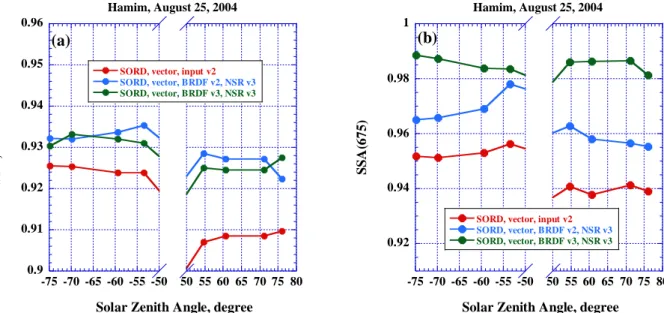
Fig. 9 shows Level 2 SSA retrievals by the V3 aerosol retrieval algorithm with RTC in vector mode for the three different types of input files described in the figure captions. Figure 8 shows a near constant offset in the values of retrieved SSA in the morning versus the afternoon which averages ~ 0.014 for 440 nm. One of the possible explanations for this difference is that the dust in the morning and the afternoon was transported to Hamim from different regions. This assumption 370
is supported by the analysis of GSFC back trajectories for the Hamim site ( https://aeronet.gsfc.nasa.gov/cgi-bin/bamgomas_interactive), which shows different back trajectories in the afternoon versus morning. Figure 9a shows that the contribution from the changes in NSR dominates that of BRDF for 440 nm SSA retrievals while according to Fig. 9b, the
contributions from changes in NSR and BRDF at 675 nm are comparable. This is consistent with the results in Fig. 2, 4 and 6 which show that the changes in the temperature correction dominate 440 nm NSR while the 675 nm NSR are mostly affected 375
by the changes in solar flux and BRDF. For SSA retrievals at 870 nm the contribution of the changes in BRDF is dominant, as shown in Fig. 10a, versus comparatively smaller effects for both solar flux and temperature correction. The SSA retrievals at 1020 nm, shown in Fig. 10b, are affected primarily by the changes in temperature correction and BRDF, however acting significantly in opposite directions.
Figure 10 shows higher variability of SSA retrievals with SZA in the afternoon than in the morning for the inversions 380
employing both NSR and BRDF of V3. In particular, retrieved SSA values in the near - infrared wavelengths in the morning are all close to 0.99 which is close to the theoretical limit for SSA of 1.0. This can be explained by low dust absorption at longer wavelengths (Dubovik, 2002) and constraints on the variability of retrieved parameters employed in the AERONET inversion algorithm (Dubovik and King, 2000b). These constraints are based on a priori assumed ranges of variability of aerosol parameters and impose limits on the values of retrieved parameters. Theoretically, the highest retrieved SSA value is 385
limited by 1, but because SSA is not retrieved directly (Dubovik and King, 2000b), the limits on SSA retrievals are imposed through the constraints on the imaginary part of the refractive index (IRI). For low absorbing aerosols the actual IRI values are very small and therefore even a small bias in simulated NSR can cause the retrieval values hit the assumed limit. In the morning, the IRI retrievals assume the AERONET constrained lower limit value of 0.0005 in which case the corresponding SSA retrievals are concentrated around 0.99. In the afternoon, the lower IRI limit is not reached due to the higher aerosol 390
absorption.
3.4 Comparison of aerosol parameters retrieved by V2 and V3 retrieval algorithms.
This comparison of operational almucantar retrievals of V2 versus V3 is presented for four selected AERONET sites (Mezaira, GSFC, Mongu, and Kanpur) and the results are summarized in the tables 1 through 17. For SSA and the real part of 395
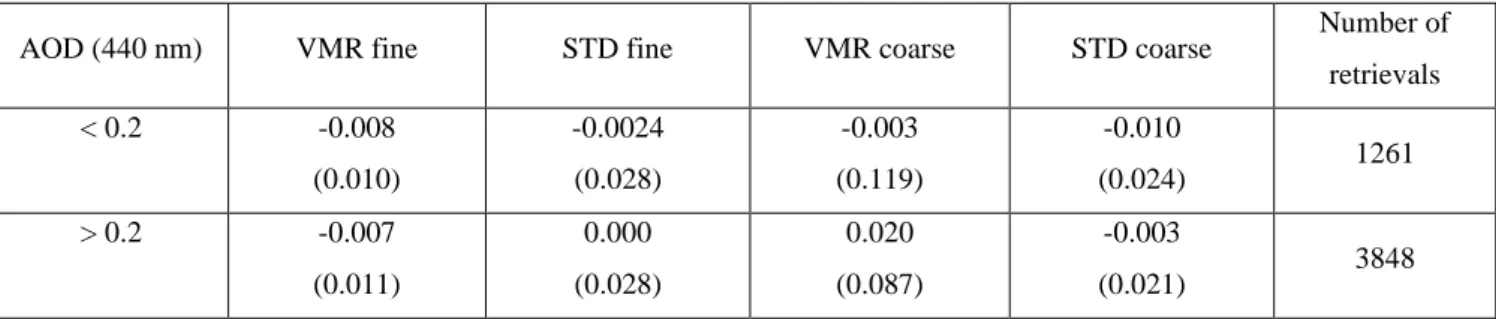
refractive index the analysis is done for three bins of 440 nm AOD which allows for extending the analysis of the inversion comparisons to different levels of sensitivity relative to the combined effects of measurement noise and modeling biases. For the size distribution parameters two AOD bins (smaller and greater than 0.2 at 440 nm) are used due to the significantly higher stability and accuracy of the aerosol size distribution retrievals (Dubovik, 2000a, 2002). The tables display statistics (mean value and standard deviation) of the difference between aerosol parameters retrieved by the V2 and V3 retrieval algorithms. 400
For Mezaira, the SSA 440 nm retrievals by V2 and V3 are not biased with respect to each other. However, SSA retrieved by V3 are systematically higher than those of V2 at longer wavelengths with the mean difference at 675 nm being the largest due to cumulative effects of both solar flux and BRDF changes. Also, the mean differences are smaller for bins corresponding to larger AOD. The mean difference of the retrievals of the real part of the refractive index shows similar patterns at 440 and 675 nm but further increases reaching a maximum at 1020 nm. The agreement in size distribution parameters for both modes 405
is reasonable bearing in mind the mean climatological values for VMR (volume median radius) and STD (standard deviation, in parentheses) for Mezaira site which are 0.15 µm (0.5) for fine and 2.3 µm (0.62) for coarse modes respectively. This
translates into an average relative difference of only ~0.1% for VMRC and ~1.5% for STDC for AOD smaller than 0.2 and into ~0.8% and ~0.5% for greater AOD. The corresponding numbers for the fine mode are also small: 5.4% and 0.5% for smaller AOD bin and 4.9% and 0.05% for AOD larger than 0.2.
410
For GSFC, Mongu and Kanpur sites the mean differences between V2 and V3 in SSA retrievals at the two longer wavelengths are much smaller than those for Mezaira due to smaller BRDF differences. However, the effect of the solar flux on SSA 675 nm retrievals is much weaker for GSFC than that for Mongu and Kanpur, which is explained by the difference in the magnitude of aerosol absorption. To gain better understanding of the influence of the aerosol absorption on the uncertainty in retrieved SSA the formula (10) of Dubovik, et al. (2000a) can be used. Below this formula is rewritten to make the 415
dependence on SSA explicit:
Δω
0≈ω
0(
𝛥𝜏𝑠𝑐𝑎
𝜔0 −𝛥𝜏𝑒𝑥𝑡
𝜏𝑒𝑥𝑡
), (1)
where ω0 is SSA, 𝜏𝑒𝑥𝑡 and 𝜏𝑠𝑐𝑎 are extinction and scattering optical depth respectively, 𝛥𝜏𝑠𝑐𝑎 and 𝛥𝜏𝑒𝑥𝑡 are their
uncertainties. Both uncertainties are always present: 𝛥𝜏𝑒𝑥𝑡 is due to the accuracy of the AOD measurements and 𝛥𝜏𝑠𝑐𝑎 may
result from the modeling bias. For example, the changes in the magnitude of sky radiances due to the adjustment in solar flux 420
value will be interpreted by the inversion algorithm as a change in scattering optical depth. Eq. (1) shows that the contribution of the 𝛥𝜏𝑠𝑐𝑎 to the SSA uncertainty depends on aerosol absorption: the smaller the aerosol absorption (larger ω0) the smaller
the 𝛥𝜏𝑠𝑐𝑎 contribution and vice versa. Figure 11 shows the results of simulation of the SSA uncertainty using Eq. (1) for the
different levels of aerosol absorption (SSA of 0.99, 0.96, and 0.86) and gives a qualitative picture of the dependence of SSA uncertainty on aerosol absorption.
425
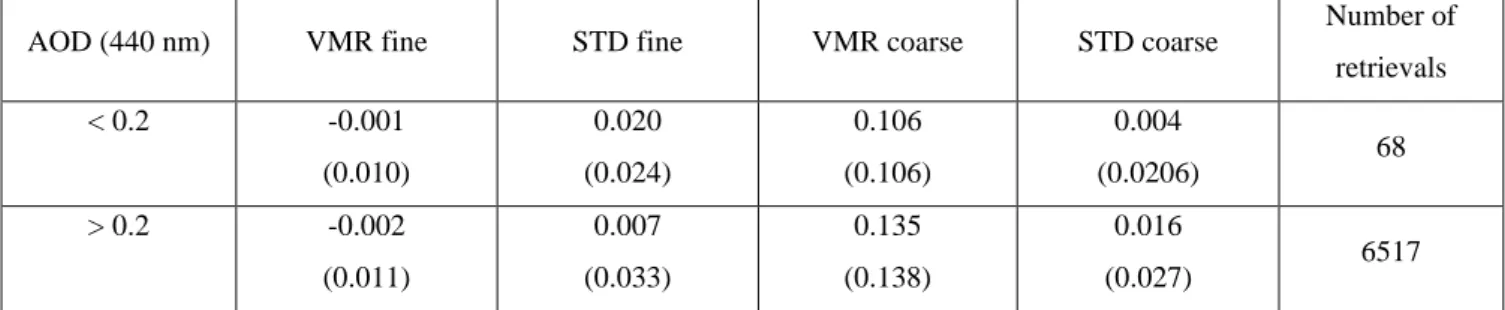
The parameters of size distribution retrieved by V2 and V3 are in good agreement for all three sites, which can be seen from the comparison V3-V2 mean differences to the following mean climatological values of VMR and STD (in parentheses) from all almucantar retrievals at each site: 0.166 m (0.456) and 2.921 m (0.672) for GSFC fine and coarse modes respectively, 0.146 m (0.420) and 3.432 m (0.655) for Mongu, 0.172 m (0.486) and 2.85 m (0.626) for Kanpur. The comparison gives the following average relative differences for VMR and STD (in parentheses) for the smaller AOD bin: 0.9% 430
(4%) and 0.9% (1.9%) for GSFC fine and coarse modes respectively, 5.4% (4.2%) and 3.7% (0.8%) for Mongu, 0.4% (4%) and 3.3% (0.65%) for Kanpur. For the AOD greater than 0.2 the corresponding differences are the following: 3.7% (0.2%) and 2.1% (1.3%) for GSFC, 0.9% (0.5%) and 3.8% (1.7%) for Mongu, 0.9% (1.5%) and 4.7% (2.6%) for Kanpur.
The mean difference in the retrieved real part of the refractive index is almost spectrally constant for Mongu site and decreases with increasing wavelength for GSFC and Kanpur. However, in all the three cases, the standard deviations of the 435
retrievals difference are significantly smaller than the ranges of operational almucantar retrieval variability for cases when AOD (440)>0.4 in both V2 and V3.
As discussed in section 2, the reduction in the range of scattering angles of measured sky radiances affects the accuracy 440
of SSA retrievals making them less stable in the presence of random noise, instrumental offsets, and modeling biases. Before V3, the two scan geometries utilized by CIMEL instruments were almucantar (ALM) and solar principal plane (PP) (Holben et al., 1998). The ALM scan is performed at a fixed view zenith angle equal to the SZA with varying azimuth angle ranging from ± 3.50 to ± 1800, including sweeps in both directions from the sun position. The symmetry between these two ALM sides is used for the quality control of sky radiances measurements to screen out cloud cover and very inhomogeneous aerosol cases 445
(thick plumes). The maximum acceptable difference between the corresponding equal-angle almucantar scan measurement pairs is 20% (Holben et al., 1998), measurements that exceed this threshold are eliminated. The range of scattering angles for ALM geometry is a function of the SZA and it is twice the value of the SZA thus making retrievals at small SZA less reliable and/or biased (see Fig 7a). Level 2 criteria for SSA retrievals require SZA to be larger or equal to 500 thus making utilizing ALM retrievals for satellite products validation problematic at many latitudes and seasons (especially summer) due to the 450
relative closeness of satellite overpass time to local noon. In the PP scan geometry, the measurements are taken in the solar principle plane (sun azimuth position) with the view zenith angle changing and the range of scattering angles equal to the sum of SZA and maximum view zenith angle which is set to 750 corresponding to 150 elevation angle. Thus, the PP scan geometry has an advantage over that of ALM for small SZA observations due to the larger range of scattering angles measured. However, due to the lack of the PP scan symmetry the quality assurance, primarily cloud screening, of measured sky radiances becomes 455
a problem. For new CIMEL Model-T instruments this principal plane scan is turned off in favor of the newly design hybrid (HYB) scan. Note that only the newer Model-T instruments can perform the HYB scan due to the requirement of greater instrument controller processing capacity to compute the complete set of angles and perform this scan. Descriptions of this model is provided on the AERONET website: https://aeronet.gsfc.nasa.gov/new_web/system_descriptions_instrument.html.
The HYB scan has the same range of scattering angles as the PP scan and yet also possesses the ALM scan symmetry 460
as depicted in Fig. 12. The HYB scan begins from the Sun and then proceeds in steps in such a way that the scattering angle monotonically increases at each step which requires simultaneous adjustments of both view and azimuth angles. After reaching the elevation angle of 15° the scan further proceeds at fixed view angle by varying the azimuth angle similar to that of an ALM scan except than the view angle is not equal to SZA. The combination of two scans in two different planes allows maximizing the range of scattering angles, similar as in the PP geometry. The scattering angle range of the HYB scan is equal to 75° plus 465
the SZA. Therefore, for a HYB scan made at 25° SZA the scattering angle range of measurements is 100°, which is the same scattering angle range that the ALM scan is capable of at 50° SZA. The extension of the SZA range in HYB scan geometry results in substantial increase in the number of inversions: e. g. Mezaira (~61%) and Kanpur (~ 57%). The increase was
estimated as the ratio of the number of inversions for SZA less than 50° to that for larger SZAs. Table 13 shows the detailed
geometry of HYB scan for three SZA values: 30°, 60° and 75°. 470
The information on the AERONET sites equipped with Model-T sun photometers can be found on the AERONET web site which provides an option to choose between ALM and HYB scan scenarios (https://aeronet.gsfc.nasa.gov/cgi-bin/draw_map_display_inv_v3 ).
475
4.1 HYB scan extension of SSA retrievals to smaller SZA.
Due to the increased range of scattering angles for the HYB geometry, the corresponding SSA retrievals are expected to exhibit less SZA variability than those of ALM and to a much lower SZA. To test this assumption, the dependences of SSA retrieved from HYB scans on SZA were generated for three AERONET sites by aggregating retrievals in five SZA bins (each bin is 100 wide centered at 30°, 40°, 50°, 60° and 70° SZA) and calculating the mean value and the standard deviation for each 480
bin. Figure 13 shows the dependencies of 440 nm SSA retrievals on SZA for Mezaira, Mongu Inn, and Kanpur sites. These
sites have the longest record of HYB type observations starting from the fall of 2014. Figure 13a shows the mean SSA values
for SZA 50°and larger are nearly constant but decrease by ~0.007 for smaller SZA. The magnitude of the decrease, however, is much smaller than that observed in the Hamim case study from almucantar retrievals where SSA drops by ~ 0.045 between 50°and 30°(see Fig 7a). Figure13c shows a similar SZA dependence for Kanpur with mean SSA variability of ~ 0.003 for 485
SZA larger than 400 and a decrease by ~ 0.015 between the 30° and 40°angular bins. As was discussed in analysis of the Hamim almucantar inversions, the reason for the decrease of retrieved SSA with decreasing SZA can be attributed to the bias in the modeling of light scattering by non-spherical dust aerosols when scattering angle range is limited, which therefore can be expected to influence SSA retrievals at dust dominated locations and smaller SZA. In this regard, both Mezaira and Kanpur sites are affected by dust aerosols: Mezaira is a desert site dominated by coarse mode dust and Kanpur has a significant seasonal 490
dust presence. The aerosol loading at Mongu Inn, on the other hand, is dominated by spherical fine mode aerosols from seasonal biomass burning and therefore no SZA dependent bias in SSA retrievals is expected. This is illustrated in Fig. 13b which shows that for Mongu Inn, the SSA does not exhibit any significant SZA dependence
The dependencies of SSA retrievals on SZA for HYB scans for longer wavelength are shown at Fig. 14 through 16. The general feature of the results for Mezaira and Mongu Inn is the absence of any clear SZA trend for SSA retrievals. For Kanpur 495
the SZA dependence at 440 nm (Fig. 13c) is gradually reversed as wavelength increases reaching the maximum 300 to 400 SZA difference of ~ 0.018 at 1020 nm. The stability of dust SSA retrievals at Mezaira at longer wavelength can be explained by the strong BRDF effect in V3 for barren desert sites which counterbalances the effect of modelling bias. Additional analysis revealed that the SSA trend reversal for Kanpur can be explained by changes in relative contributions of fine and coarse aerosol component to the total AOD with SZA bins. For example, at 1020 nm, the 300 SZA bin is dominated by coarse mode AOD 500
which is ~ 0.3 while fine mode AOD is only ~ 0.085. At the same time, at 400 SZA bin the coarse and fine mode contributions are comparable: ~ 0.18 (coarse) and ~ 0.16 (fine) resulting in SSA at 300 being larger than that at 400 (e. g. Eck et al., 2010).
4.2 Hybrid versus almucantar scan - comparison of SSA retrievals.
Typically, HYB and ALM scans are taken ~ 10-12 minutes apart for the SZA range of 500 to 750, therefore the 505
corresponding retrieval results are expected to be in relatively good agreement. Fig. 17 and 18 show the statistics of the difference in SSA retrieved from HYB and ALM scans as a function of SZA. The statistics were generated using the data from
all AERONET sites for which the HYB inversions were available by aggregating SSA retrievals in five SZA bins. Each bin is
10 wide centered at 50.5° (387), 54.5° (160), 59.5° (187), 64.5° (121) and 73.5° (296) SZA where the number of inversions
corresponding to each SZA bin are shown in parentheses. In general, the agreement is good for all wavelengths with the mean
510
values of the differences below 0.005. At the same time the variability is increasing with increasing wavelength due to predominant contribution of fine mode aerosols to the generated statistics (aerosol loading of ~80% sites is dominated by
fine mode aerosols), and therefore much smaller AOD at the longest wavelengths which results in less sensitivity to aerosol
absorption. Also, there is a trend of decreasing difference with increase of SZA due to increasing similarity of both scan geometries which is very clearly visible at 440 nm. At longer wavelengths SZA dependencies exhibit maximum at ~ 550 due 515
to sharp decrease of the mean difference at the smallest SZA.
5 Uncertainty estimates of the retrieved aerosol parameters: U27
The first assessment of the accuracy of aerosol parameters retrieved by AERONET sky scan inversions was presented in (Dubovik, 2000a). This analysis was performed by sensitivity studies for a set of preselected aerosol models assuming given 520
input uncertainties due to random errors, instrumental offsets, and known uncertainties in atmospheric radiation modelling. The main results are presented in Table 4 of that paper, summarizing the dependence of the accuracy on aerosol type for a limited number of AOD values and for a single fixed value of solar zenith angle (60 °). Applicability of the results to the 50-70° range of solar zenith angles is therefore assumed. The AOD dependence was analyzed for two AOD values for water-soluble aerosols (smaller and greater than 0.2 at 440 nm) and for one AOD range (greater than 0.5 at 440 nm) for biomass 525
burning and dust aerosol types. The accuracy of wavelength dependent aerosol parameters (real and imaginary parts of refractive index and single scattering albedo) was only analyzed for 440 nm. Based on these results the following thresholds for level 2 aerosol retrieval quality control for the refractive indices are used: AOD (440) is greater than 0.5 and SZA is greater than 50° (Dubovik, 2000a; Holben et al., 2006). These thresholds were selected in order to insure that for Level 2 data the uncertainty of retrieved SSA was 0.03 or less. For the size distribution retrievals there was no lower limit threshold in 440 nm 530
AOD to meet quality control for Level 2 data.
In V3 the analysis of the accuracy of retrieved aerosol parameters is extended to all the wavelengths participating in the inversion (440, 675, 870 and 1020 nm) and to a wider range of values of AOD and SZA. The approach is somewhat similar to that of Dubovik (2000a) in that the variability in retrieved aerosol parameters is generated by perturbing observations in inversion inputs as in typical sensitivity studies. However instead of generating synthetic measurements for the prescribed sets 535
of aerosol models and then perturbing them, the real time Sun photometer observations are perturbed by the assumed values of instrumental and auxiliary input biases. This allows avoiding some rather complex modeling such as considering aerosols of different types or mixtures thereof over different types of surfaces which would require a large set of different combinations to analyze. Also, a very wide range of AODs and SZAs are covered since the entire multi-decade data base of AERONET almucantar observations were analyzed in this V3 assessment of uncertainty.
5.1 Approach for individual inversions.
The assumption made in this analysis is that the perturbations in measurements and auxiliary inputs are due to uncertainties (biases, systematic errors) in AOD, radiometric calibration of sky radiances, solar spectral irradiance, and surface reflectance. Sun photometer pointing bias is not included in the list of uncertainties because this error is quite small (~0.1 °) 545
and furthermore averaging the left and right parts of almucantar scans before use as input to the retrieval code reduces this uncertainty significantly. Each bias assumes three values: positive value, negative value, and zero (non-biased), and the values and the signs of biases of the same type are assumed spectrally independent. This means, for example, that AODs at different wavelengths are biased in the same direction with the same assumed bias value. The same is true for sky radiances, solar irradiance spectrum, and surface reflectance. The radiometric calibration and solar spectrum irradiance uncertainties are 550
combined in one bias because both affect the magnitude of sky radiances. As a result, there are three distinct biases each assuming three values which makes 27 distinct combinations in perturbing measurements in inversion inputs. The following values for one sigma biases of the input data are assumed. AOD: ± 0.01/m (Eck et al., 1999b), where m is optical air mass, radiometric calibration bias: ± 3%, solar irradiance spectrum: ±2%., and surface reflectance: ±0.05. The combined calibration and solar irradiance bias assume the ± 5% values, which overestimate the sum of individual biases in cases when they 555
compensate each other. In the Ross -Li BRDF model, only the first of the three BRDF parameters is perturbed. This is
equivalent to an assumption that the angular shape of BRDF is unchanged and only the surface albedo is biased. For each set of Sun photometer observations an array of 27 inputs corresponding to 27 combinations of biases are produced. All of these inputs are then separately inverted, and the following statistics of the inversion results is generated: average value, standard deviation, minimal and maximal values. These statistics describe the variability in retrieved aerosol parameters due to the 560
assumed uncertainties in inversion inputs for each individual inversion. From these statistics only the standard deviation (which we label as U27) is used as a proxy for the estimated uncertainty as an indicator of a spread of the retrievals corresponding to the different combinations of input uncertainties.
5.2 Look Up Table (LUT) approach. 565
Because operationally running 27 inversions instead of one substantially increases the computational time, a LUT approach was designed to speed up the determination of U27 for all new observations when they are reprocessed to Level 2 with final calibrations applied. A climatological LUT is generated from the entire AERONET almucantar and hybrid scan database by binning U27s in AOD (440 nm), Angstrom Exponent (AE, 440- 870nm), and SSA (440, 675, 870, 1020 nm). A total of ~1 million sky scans that passed Level 2 quality controls were inverted 27 times in order to produce the U27 values 570
for all parameters. Using this LUT approach, U27 for each individual new Level 2 retrieval can be obtain by interpolation using the corresponding measured and inverted combination of AOD, AE, and SSA. The analysis of U27 for dust aerosol individual retrievals of SSA at longer wavelengths revealed physically nonrealistic small values of U27 related to IRI hitting its lower limit (boundary) constraint of the inversion as was discussed in analysis of the results presented on Fig. 10. Therefore,
a second LUT was generated from the subset of U27s for only individual inversions when no boundary hits were detected for 575
any of the retrieved parameters. The second LUT is used for obtaining the unbiased estimates of uncertainty in situations when the effect of boundary hitting by retrievals on U27 is substantial (typically for SSA of dust aerosol, which is already very weakly absorbing).
The following binning intervals were used in generating the LUT. AOD: less than 0.05, 0.05-0.1, 0.1-0.2, 0.2-3.4 (in 0.2 increment bins). AE (440-870 nm): less than 0.3, 0.3-2.4 (in 0.3 increment bins). SSA: 440, 675 nm: less than 0.7, 0.7-0.8, 580
0.8-0.85, 0.85-0.9, 0.9-0.95, 0.95-0.975, and 0.975-1.0. SSA: 870-1020 nm: two additional bins: less than 0.6, and 0.6-0.7. The U27 are provided for the following parameters: VMR of size distribution for both modes, width of size distribution for both modes, IRI at four standard wavelengths, SSA at four standard wavelengths, and asymmetry parameter at four standard wavelengths. The uncertainty estimates for the real part of refractive index (RRI) are not provided for the reason that will be discussed later in section 5.4.2.
585
All parameters use AOD and AE in the LUT; however, some absorption dependent parameters also utilize the binning of SSA, which produces two types of LUTs. The first LUT is two dimensional with binning in AOD and AE. This LUT is used to generate U27 for VMR, width of PSD, and asymmetry parameter. The second LUT is binned by AOD, AE, and SSA and used to obtain U27 for IRI, and SSA in order to account for the effect of different absorption levels by aeroso ls with overlapping AE ranges, e. g. pollution and smoke aerosols (both of which exhibit a wide range of absorption (Dubovik et al, 590
2002; Giles et al, 2012)). The two-dimensional (2D) LUT can be viewed as a rectangular grid, each node of which corresponds to an AOD, AE pair. Each inversion has its own AOD and AE, and thus represents a point in the AOD, AE 2D space. If a point is inside of that grid, four surrounding nodes are used for 2D interpolation. Similarly, the three-dimensional (3D) LUT can be viewed as a parallelepiped lattice, each node of which corresponds to an AOD, AE, SSA triad. Each inversion has its own AOD, AE and SSA, and thus represents a point in the AOD, AE, SSA 3D space. If a point is inside of the lattice, we use the 595
eight surrounding nodes for 3D interpolation. If one or more points that are required for interpolation are missing, the values of the closest nodal points are used. The 2D interpolation is done on the original LUT (no restriction on boundary hits of the a priori constraints). The 3D interpolation uses the no hits LUT (no constraint limits reached for any retrieved parameters) only for the following combination of AE, SSA bins: AE– less than 0.3 and SSA–0.975-1.0, conditions for which the most of the boundary hits of the IRI parameter occurs.
600
Figure 19 shows comparison of U27 estimated for SSA retrievals by the two methods for Mezaira for SSA at 440 nm and 675nm. Figure 19a shows good agreement between them at 440 nm although the dependence of LUT interpolated U27 on AOD exhibits less scattering than that for individual inversions which can be explained by the additional LUT averaging. Figure 19b at 675 nm demonstrates the effect of the boundary hits by IRI retrievals on U27 obtained for individual inversions in which case the variability among the 27 individual retrievals is reduced due to the lower limit constraint for IRI resulting in 605
an upper limit for SSA. Because of this artificial variability reduction, the corresponding standard deviations are underestimated in some of the individual retrievals. It is also seen from the Fig. 19b that combining the original LUT with the
one with no hits for the lowest AE and the highest SSA bins corrects these unphysically small U27 values especially for low levels of AOD.
610
5.3 Quality control.
For V3 retrieval parameters, we define the Level 2 criteria for estimated retrieval uncertainties in a manner very similar to that of Dubovik et al. (2000a) and Holben et al. (2006), thus limiting the quality assured U27 retrievals to those within AOD/SZA boundaries close to or equal to those defined in the previous V2. The following Level 2 criteria are used and U27 estimates of uncertainty are provided for these parameters:
615
- SSA, IRI: for ALM 440 nm AOD larger than 0.4 and SZA larger than 50°. For HYB 440 nm AOD larger than 0.4 and SZA larger than 25°. This insures that for both ALM and HYB scans the minimum angle of scattering angle range is 100° for measured directional sky radiances.
- Volume median radius, width of particle size distribution, asymmetry parameter: For ALM 440 nm AOD larger than 0.02 and solar zenith angle (SZA) larger than 50°. For HYB 440 nm AOD larger than 0.02 and SZA larger than 25°. 620
5.4 Analysis.
The approach utilizing LUT interpolation was investigated by generating U27 for aerosol retrievals at four selected AERONET sites: GSFC, Mezaira, Kanpur, and Mongu for which the results are presented below.
5.4.1 SSA 625
Figure 20 shows the uncertainties estimates for SSA retrieved at the GSFC site. As is seen, at all the wavelengths the U27 exhibits power like functional dependencies on AOD with smaller uncertainties corresponding to the larger optical depth and vice versa. The scattering of the data increased with increasing wavelength which can be explained by the decrease in AODs at longer wavelengths due to the large AE, 1.61 yearly climatological value. In addition, the data displayed in Fig. 20 are comprised of retrievals for the range of SZA greater than 500 (upper limit ~770) which can contribute to additional U27 630
scattering due to SZA variability within narrow AOD bins. The solid blue lines on Fig. 20 indicate the upper boundary of Level 2 SSA retrieval uncertainty established in Dubovik et al. (2000a) for AOD (440 nm) greater than 0.2 for water-soluble aerosol type (weakly absorbing) which dominates GSFC aerosol loading especially at the highest AOD levels. The close inspection of Fig. 20a shows that the crossing point between the blue line (Dubovik et al. (2000a) estimate) and U27 AOD dependence is close to AOD (440) of 0.3 thus increasing the AOD by 0.1 in V3 for the same estimate of SSA uncertainty 635
(0.03) that was assumed in V2 (for water soluble aerosol). Similar analysis of Fig. 20b though Fig. 20d show that the AOD (440 nm) corresponding to the uncertainty of 0.03 increases with wavelength: ~ 0.4, 0.5, 0.6 for 675, 870, and 1020 nm respectively.
Figure 21 shows the uncertainty estimates for SSA retrieved at the Mezaira site. The uncertainties exhibit some minor scattering at 440 nm and much larger variability at longer wavelengths. The main reason for the larger scattering of U27 values 640