Acknowledgements
Abstract
Background: Obesity and advanced age are two major risk factors associated with increased breast cancer (BC) risk and progression. While mechanisms underlying the obesity-BC link are emerging, preclinical and clinical studies typically do not incorporate age as a relevant biological variable that may interact with obesity and other risk factors. Due to systemic features shared between advanced age and obesity, including chronic inflammation and immune dysfunction, we tested the hypothesis that advanced age and obesity similarly enhance BC growth in part through modulation of tumor-intrinsic features.
Methods: Young lean, young obese, and aged lean mice received orthotopic transplantation of metM-Wntlung (claudin-low subtype) BC cells into the mammary tissue. Tumor growth was monitored via biweekly palpations, and tumor and lung tissues were excised and stored at study endpoint for subsequent analyses. Lungs were analyzed histologically for metastasis. Differential tumor gene expression was profiled with Affymetrix microarray, analyzed using Gene Set Enrichment Analysis (GSEA), and validated by RT-PCR.
Results: Young obese and aged lean mice (relative to young lean mice) displayed accelerated tumor growth and increased tumor mass. Metastasis analysis suggests greater incidence of metastasis in young obese mice compared to young lean and aged lean. Gene expression analyses demonstrate that tumors from aged lean and young obese (relative to young, lean mice) were commonly enriched for genes relating to tumor aggression (e.g. epithelial and mesenchymal transition and angiogenesis) and negatively enriched for markers of antitumor immunity.
Table of Contents
Introduction _________________________________________________________________ 4
Breast Cancer Prevalence and Claudin-Low Subtype ____________________________________ 4
Aging, Obesity, and Breast Cancer ____________________________________________________ 5
Impact of Tumor Microenvironments _________________________________________________ 6
Goals and Hypotheses _________________________________________________________ 7
Methods ____________________________________________________________________ 9
metM-WNTlung Cell Line ____________________________________________________________ 9
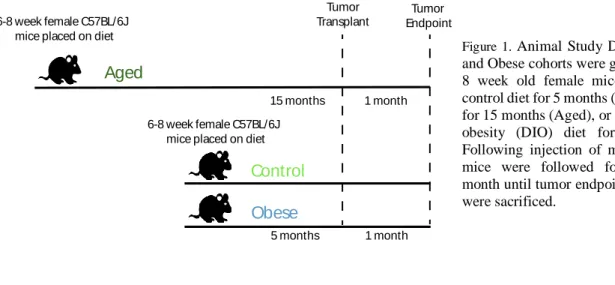
Animal Study Design: ______________________________________________________________ 9
Body Weight and Fat Composition Analysis: __________________________________________ 10
Tumor Weight and Volume Analysis: ________________________________________________ 10
Breast Cancer Metastasis Analysis: __________________________________________________ 11
RNA Profiling and Gene Set Enrichment Analysis (GSEA): ______________________________ 12
Quantitative RTq-PCR analyses: ____________________________________________________ 13
Statistical Analysis: _______________________________________________________________ 13
Results_____________________________________________________________________ 14
Diet-induced obesity and aging accelerate BC progression and metastasis in vivo ____________ 14 Generation of control, aged, and obese phenotypes _____________________________________________ 14 Advanced age and obesity increase primary tumor growth _______________________________________ 16 Advanced age and obesity contribute to BC metastasis __________________________________________ 16 Advanced age and diet-induced obesity increase gene expression markers of tumor aggression. 19
Advanced age and diet-induced obesity dampen antitumor immunity signatures ____________ 21
Discussion__________________________________________________________________ 24
Conclusions ________________________________________________________________ 27
Introduction
Breast Cancer Prevalence and Claudin-Low Subtype
Breast cancer (BC) is the most prevalent cancer and second leading cause of cancer-related deaths in women.1 In 2019, an estimated 268,600 new cases of BC will be diagnosed, accounting for 30% of all new female cancer diagnoses and an estimated 42,260 deaths.1 While overall death rates have been falling on average 1.8% each year from 2006-15 due to improvements in treatment and early detection, survival rates for certain BC subtypes have struggled to improve.1,2,3 BC represents a heterogenous disease which has led to the classification of human breast tumors into distinct molecular subtypes based on gene expression patterns.4 These molecular subtype can predict prognosis and inform treatment options.3,5
Aging, Obesity, and Breast Cancer
Advanced age and obesity are two major risk factors that independently increase an individual’s risk of breast cancer incidence and mortality.8,9 Breast cancer, like many other cancers, is considered an age-related disease, as less than 5% of BC diagnoses occur in women under 40 years of age and the median age at diagnosis is 62 years.5 Further, advanced age at diagnosis predicts a poor prognosis, but the underlying mechanism is unknown.10 These older populations are often underrepresented in clinical trials and there is limited clinical and preclinical research investigating the impact of age-related biology on breast cancer progression.10,11 Specifically, the majority of preclinical studies fail to incorporate the variable of age, performing cancer research in young mice, ~ 6-20 weeks of age.12 This represents only the early portion of their 2+ year lifespan translating to approximately 20 years of age, failing to capture the aged environment in which most newly diagnosed BCs reside.12,13 Advancing age results in multiple biological changes including systemic inflammation, immunosenescence, and loss of organ-specific tissue mass and function over time, each of which could contribute to differential BC progression.10,8 The impact of these age-related changes on BC growth and progression warrants further investigation.
compared to in comparison to low-fat, control mice.16, 17 With more than one-third of the current US population afflicted by obesity these correlations pose significant public health problems prompting further investigation.18
Advanced age and obesity share common features that may facilitate BC progression including chronic, low-grade inflammation and immune dysfunction both systemically and within the adipose tissue. Advanced age can lead to adipose dysfunction by altering tissue composition and function, increasing percent fat mass, and increasing the ratio of pro-inflammatory to anti-inflammatory immune cells, cytokines, and chemokines.19 In obesity, altered dietary energy balance leads to hypertrophy and hyperplasia of adipose tissue, leading to recruitment of inflammatory factors, leading to chronic inflammation which can result in favorable environment for tumor growth and proliferation.15 While there is strong relationship that obese and aged mammary adipose will foster proliferation and expansion of tumor-adjacent tissues, it is unknown how this impact the tumor-intrinsic microenvironment itself.
Impact of Tumor Microenvironments
tumor-Goals and Hypotheses
The primary goal of this project is to identify age- and obesity-related changes to the tumor microenvironment that contribute to increased breast cancer (BC) progression. To examine breast cancer progression in advanced age and obesity preclinically, this project utilizes an orthotopic tumor transplant model in which young, aged, and obese mice received injection of claudin-low, metM-Wntlung BC cells into the fourth mammary gland. This preclinical model allows us to tests the central hypothesis that advanced age and obesity share common mechanisms contributing to BC progression through the following specific aims:
Specific Aim 1: Confirm that advanced age and diet-induced obesity (DIO) drive breast cancer progression in a mouse model of claudin-low breast cancer. Hypothesis: Advanced age and obesity will result in accelerated BC growth and metastasis compared to the young, lean mice.
Approach: We will examine tumor growth and metastasis in young lean, young obese, and aged mice.
Specific Aim 2: Test whether advanced age and obesity enhances markers of tumor aggression within the tumor microenvironment. Hypothesis: Tumors from aged and obese mice display increased expression of genes associated with aggressive tumor features, such as epithelial to mesenchymal transition and angiogenesis.7
Specific Aim 3: Test whether advanced age and obesity dampen makers of antitumor immunity within the tumor microenvironment. Hyptothesis: Tumors from aged and obese mice display decreased expression of genes associated with antitumor immunity, including interferon gamma response, and markers of T-cell activity/presence.
Methods
metM-WNTlung Cell Line
The metM-WNTlung cell line was generated by the Hursting laboratory in 2010 from a lung metastasis that developed following transplantation of a claudin-low MMTV-Wnt-1 mammary cancer cell line into the mammary fat pad of a severe combined immunodeficiency (SCID) mouse.17 Further characterization of the cell line determined that it grew in the mammary adipose of C57BL6/J mice and metastasized to the lung.17metM-WNTlung cells were taken out of liquid nitrogen storage and maintained in RPMI 1640 media (Gibco Life Technologies) supplemented with 10% fetal bovine serum (FBS), 10 mmol/L HEPES buffer, 2 mmol/L L-glutamine, and 1% penicillin/streptomycin. Prior to tumor cell injection, metM-WNTlung cells were transduced with a lentiviral construct containing both eGFP and NanoLuciferase (gifted by Antonio Amelio), as previously described.17,22 This allows detection of primary tumor growth and metastasis in vivo via bioluminescence imaging and ex vivo via immunohistochemistry with anti-GFP. The cell lines tested negative for mycoplasma by the University of North Carolina's Tissue Culture Facility.
Animal Study Design:
for the tumor study: Control, Aged, and Obese. Note that during the diet period, one aged and one control mouse developed dermatitis and had to be euthanized before initiation of the tumor study.
At this point, aged (16 mos) and young (6 mos) cohorts received orthotopic injection of metM-WNTlung breast cancer cells (1.5 x 10⁴ cells/50 uL PBS) into the fourth mammary fat pad of the mice. Tumor growth was monitored via biweekly palpations until mice in at least one experimental group reached tumor endpoint, defined as a diameter of 1.5 cm measured in any direction. At tumor endpoint, the mice were sacrificed by carbon dioxide euthanasia and cervical dislocation, after which tumors were excised, weighed, and collected for subsequent analysis. Lungs were also collected to determine metastatic burden ex vivo.
Body Weight and Composition Analyses:
Body weight was recorded at baseline and then every week until the end of the study. Body composition was measured at interim timepoint and study endpoint via quantitative magnetic resonance imaging (qMRI) (Echo Medical Systems, Houston, TX). qMRI imaging resulted in lean mass, fat mass, and total water mass measurements. Percentage body fat was calculated by dividing fat mass by total body weight measured the same day.
Tumor Weight and Volume Analysis:
Breast Cancer Metastasis Analysis:
Table 1. Optimized Aperio ImageScope Postive Pixel Count algorithm settings used to quantify metastatic burden.
RNA Profiling and Gene Set Enrichment Analysis (GSEA):
RNA was isolated from frozen tumor samples using TRIzol Reagent (Sigma-Aldrich) and RNeasy Miniprep Kit (Quiagen) following an optimized version of the manufacturers’ protocols. RNA quality was assessed by Agilent 2100 Bioanalyzer by Mike Vernon at UNC Functional Genomics Core. In brief, Mouse Clarion S Gene Expression Mircoarray (Affymetrix) was used to measure gene expression. This was performed by the UNC Functional Genomics Core, according to manufacturers protocol. Collected data was imported into Gene Set Enrichment Analysis (GSEA), a software that compares RNA expression data to determine whether defined gene sets related to pathways or processes demonstrate statistically significant, concordant differences between two phenotypes. GSEA tested whether a Hallmark collection of gene sets were enriched in obese vs control or aged verses control. This analysis produces a normalized enrichment score (NES), which corresponds to the strength of the enrichment in one phenotypes verses another, and a False-discovery rate (FDR), which reflects the significance of the NES .24 FDR of less than 0.05
Color Saturation Threshold 0.377
Hue value 0.1
Hue With 0.343
Color Saturation Threshold 0.04
Iwp (high) 172
Iwp (low) - Ip (high) 143
Ip (low) = lsp (high) 125
Isp (low) 0
software was utilized to identify the core genes within a gene set contributed to the NES.24 Selected core genes were then validated using RTq-PCR.
Quantitative RTq-PCR analyses:
Extracted tumor RNA samples were reverse transcribed into cDNA using the High-Capacity cDNA Reverse Transcription Kit (Applied Biosciences). RTq-PCR was performed to validate expression of core genes, with primers ordered from integrated DNA technologies and SYBR Green mix (Biorad) according manufacturer’s instructions. cDNA samples were assayed in triplicate. PCR and data collection were conducted on a ViiA7 (Applied Biosystems, Foster City, CA). Gene expression data was normalized to three housekeeping genes: -actin, Rplp0 (large ribosomal protein), and Rpl4 (ribosomal protein L4).
Statistical Analysis:
Nishita Sheth
Results
Diet-induced obesity and aging accelerate BC progression and metastasis in vivo
Generation of control, aged, and obese phenotypes
To determine the effects of age and diet-induced obesity (DIO) on BC, control, obese, and aged mice were orthotopically transplanted with claudin-low, metM-WntLung BC cells into the fourth mammary fat pad and then followed until tumor endpoint (Figure 1).
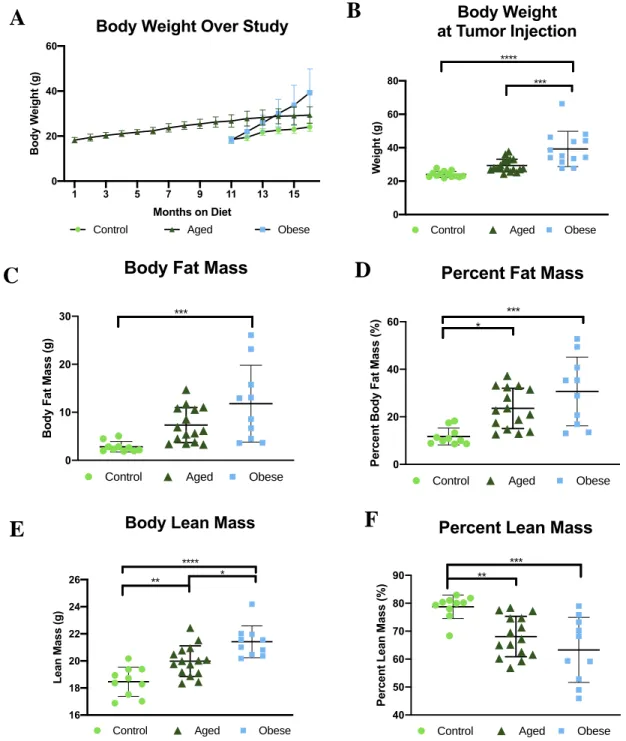
Body weight measured throughout the study confirmed weight gain of mice placed on the DIO diet (Figure 2A). Additionally, advanced age resulted in modest weight gain over time. At tumor endpoint obese mice had the significantly greater body mass relative to control and aged mice (p= < 0.0001; p= 0.0003) (Figure 2B). No significant difference in body weight occurred between the control and aged mice, both ofwhich were fed lean, low-fat diets. In agreement, body composition analysis demonstrated that obese mice had significantly greater body fat mass (p= 0.0008) and percent body fat mass (p=0.0003) relative to control mice (Figure 2C, 2D). Aged mice displayed
1 month 5 months
1 month 15 months
6-8 week female C57BL/6J mice placed on diet
6-8 week female C57BL/6J mice placed on diet
Tumor Transplant
Tumor Endpoint
Aged
Obese
Control 6-8 week female C57BL/6J
mice placed on diet
Aged
Obese
Control
Aged Obese
1 month 5 months
1 month 15 months
Transplant Endpoint
obese mice compared to control (Figure 2E, 2F). Again, aged mice had intermediate total lean mass and percent lean mass.
Figure 2. Obese mice displayed the greatest body weight (A, B), body fat mass (C), and percent body fat mass (D) and lean mass (E) compared to control and aged mice. Control mice displayed the highest percent lean mass (F) relative to all other group. Aged mice had intermediate levels of all measures. Data presented as mean SD. Differences across groups analyzed using one-way ANOVA. Differences in significance indicated by asterisk. *, P 0.05; **, P 0.01; ***, P0.001; ****, P0.0001.
A
B
C
D
E
F
1 3 5 7 9 11 13 15
0 20 40 60
Months on Diet
B o d y W ei g h t (g )
Body Weight Over Study
Control Aged Obese
0 20 40 60 80 W ei g h t (g ) Body Weight at Tumor Injection
Control Aged Obese
**** *** 16 18 20 22 24 26 L ea n M as s (g )
Body Lean Mass
Control Aged Obese
**** * ** 0 10 20 30 B o d y F at M as s (g )
Body Fat Mass
Control Aged Obese
*** 0 20 40 60 P er ce n t B o d y F at M as s (% )
Percent Fat Mass
Control Aged Obese
*** * 40 50 60 70 80 90 P er ce n t L ea n M as s (% )
Percent Lean Mass
Control Aged Obese
Advanced age and obesity increase primary tumor growth
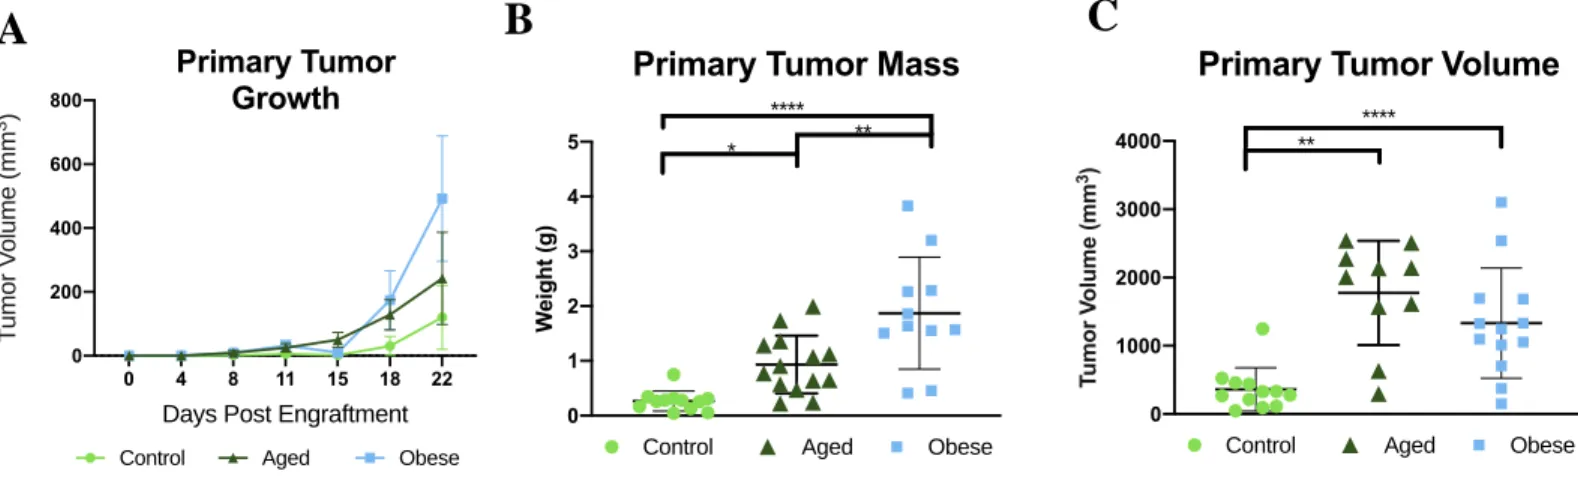
Obesity and advanced age accelerated primary tumor growth in vivo as evidenced by tumor palpation data (Figure 3A). Measurement of tumors extracted at study endpoint, revealed that obese mice had significantly greater tumor mass compared to both control (p <0.0001) and aged mice (p= 0.0030) (Figure 3B). Advanced age served as an intermediary phenotype as it was significantly different from both control (p= 0.0358) and obese (p= 0.0030) in terms of tumor mass (Figure 3B). In confirmation, tumor volume as determined by the product of three distinct dimensions, was greatest in obese mice relative to both control (p < 0.0001) followed by aged (p = 0.0030) mice (Figure 3C). Primary tumors from aged mice were larger in terms of volume compared to controls (p = 0.0026) (Figure 3C).
Figure 3. Advanced age and diet-induced obesity drive primary tumor growth. Aged and obese mice exhibited accelerated tumor growth in vivo (A) and increased in primary tumor mass (B) and volume (C) at study endpoint, relative to control mice. Data presented as mean SD. Differences across groups analyzed using one-way ANOVA. Differences in significant indicated by asterisk. *, P 0.05; **, P 0.01; ***, P0.001; ****, P0.0001.
Advanced age and obesity contribute to BC metastasis
To determine the effects of advanced age and diet-induce obesity on BC metastasis, lung
0 4 8 11 15 18 22
0 200 400 600 800
Days Post Engraftment
T u m o r V o lu m e ( m m 3) Primary Tumor Growth
Control Aged Obese
0 1000 2000 3000 4000 Tu m o r V o lu m e (m m 3)
Primary Tumor Volume
Control Aged Obese
**** ** 0 1 2 3 4 5 W ei g h t (g )
Primary Tumor Mass
Control Aged Obese
**** ** *
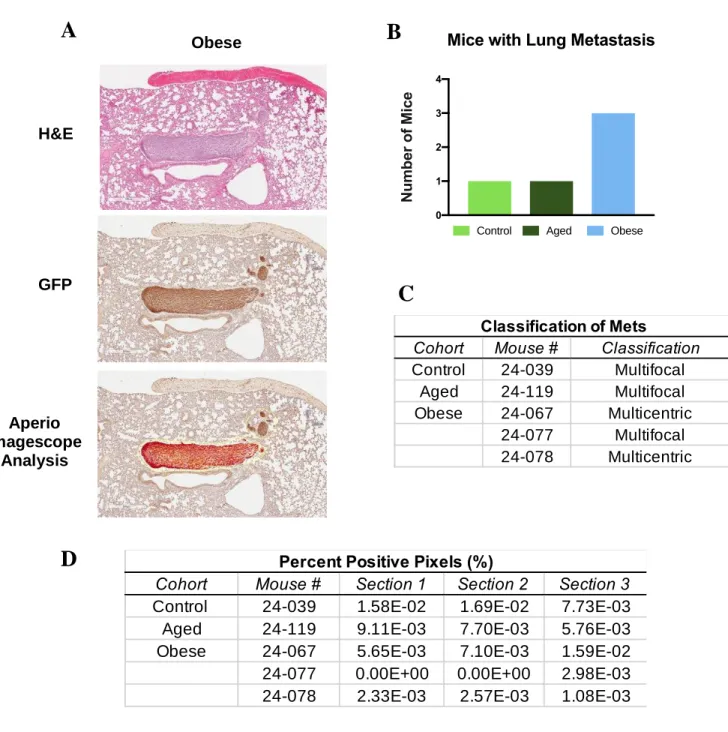
Figure 4. Metastasis Analysis. (A) H&E, GFP, and Aperio Imagescope Analysis of breast cancer metastasis in extracted lung tissues. Magnification = 4.4 X. (B) Number of mice quantified with lung metastasis from n=6. (C) Classification of lung metastasis defined as multifocal or multicentric. (D) Percent positive signal defined as total percent positive pixel count per section divided by total pixel count per section for mice
H&E
GFP
Aperio Imagescope
Analysis
Obese
0 1 2 3 4
N
u
m
b
er
o
f
M
ic
e
Mice with Lung Metastasis
Control Aged Obese
A
B
C
Cohort Mouse # Classification
Control 24-039 Multifocal
Aged 24-119 Multifocal
Obese 24-067 Multicentric
24-077 Multifocal
24-078 Multicentric
Classification of Mets
D
Cohort Mouse # Section 1 Section 2 Section 3
Control 24-039 1.58E-02 1.69E-02 7.73E-03
Aged 24-119 9.11E-03 7.70E-03 5.76E-03
Obese 24-067 5.65E-03 7.10E-03 1.59E-02
24-077 0.00E+00 0.00E+00 2.98E-03
24-078 2.33E-03 2.57E-03 1.08E-03
Advanced age and diet-induced obesity increase gene expression markers of tumor aggression.
Next, we examined tumoral gene expression to identify potential mechanisms underlying enhanced BC progression in aged and obese mice. Whole tumor RNA was profiled using Affymetrix Microarray Analysis. Resulting gene expression data was analyzed using Gene Set Enrichment Analysis (GSEA) software and Hallmark gene sets which represent genes coordinately expressed in biological pathways and processes such as epithelial-mesenchymal-transition, inflammatory response, and angiogenesis.24 When examining genes commonly enriched in Obese vs. Control and Aged vs. Control, eight gene sets displayed significantly positive enrichment in both the aged and obese groups with FDR <0.05 (Figure 5). Of these, epithelial-mesenchymal transition which was chosen for further validation due to its high normalized enrichment scores and statistical significance (FDR < 0.001) and NES (2.17)
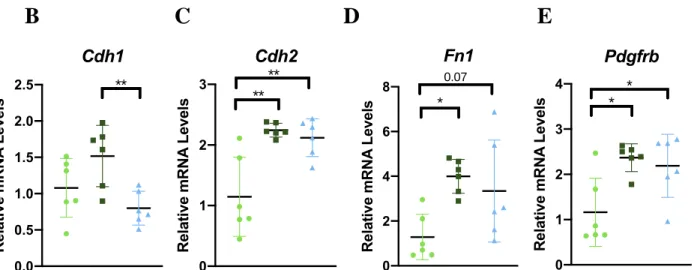
Figure 5. A) Tumoral gene expression analyzed with GSEA using hallmark gene sets. Gene sets positively enriched in Obese vs Control or Aged vs Control determined by FDR q-value < 0.05. B-E) Expression of leading edge genes validated with RTq-PCR. Data presented as mean ± SD. Differences across groups analyzed using one-way ANOVA. Asterisks indicate differences in significance.* p < 0.05., ** p < 0.01, *** p < 0.001.
Leading edge analysis in the GSEA software was then performed on the epithelial-to-mesenchymal transition gene sets for both Obese vs. Control and Aged vs. Control to identify the genes that significantly contributed to the normalized enrichment score (NES). Through this analysis, the following genes were identified as leading contributors to the NES in both the obese and aged mice compared to controls: N-cadherin (Cdh2) , Fibronectin (Fn1), and Platelet derived growth factor receptor (Pdgfrb) (Figure 5C-E).. RT-qPCR validation of leading edge genes confirmed that both aging and obesity resulted in significantly greater expression of Cdh2 (P < 0.01 for each comparison), and Pdgfrb (<0.05 for each comparison) (Figure 5C,5E). While both phenotypes displayed increased average fibronectin expression, it only reached statistical significance in the aged (P = 0.018) (Figure 5C). Expression of epithelial cadherin (E-cadherin;
Advanced age and diet-induced obesity dampen antitumor immunity signatures
Next, we examined gene sets negatively enriched gene in tumors from obese and aged mice compared to control mice. Four gene sets were identified: interferon gamma response, allograft rejection, inflammatory response, and myogenesis (FDR < 0.05) (Figure 6A). Negative enrichment scores indicate that the identified gene sets were enriched in the control mice, rather than the obese and aged mice. The interferon gamma response gene set was chosen for further validation due to its high NES (-2.47) and statistical significance (FDR < 0.001).
A
0.0 0.5 1.0 1.5 2.0 2.5 R el at iv e m R N A L ev el s Tnfa *B
C
D
Figure 6. A) Tumoral gene expression was analyzed with GSEA using hallmark gene sets. Gene sets negatively enriched in Obese vs Control or Aged vs Control determined by FDR q-value < 0.05. B-F) Expression of leading-edge genes validated with RTq-PCR. Data presented as mean ± SD. Differences across groups analyzed using one-way ANOVA. Asterisks indicate differences in significance. * p < 0.05., ** p < 0.01, *** p < 0.001.
Leading edge analysis in the GSEA software was then performed on the interferon gamma response gene set for both Obese vs. Control and Aged vs. Control to identify the genes that significantly contributed to the normalized enrichment score (NES). Through this analysis, genes were identified as leading contributors to the negative NES in both the obese and aged mice compared to controls and chosen for RT-qPCR validation.
Obesity significantly decreased both Ifnand Tnfa (both P<0.05) (Figure 6A,6B). Obesity resulted in a reduction of genes whose expression is stimulated by interferon gamma including
Klrk1 (both P<0.001), Cxcl11 (P<0.01), and Gzma (P<0.05) (Figure 6D-F). Aging appeared to serve as an intermediary phenotype, showing decreased levels in Ifn, Tnfa, and Cxcl11 compared to controls, but not statistically different in comparison to either control or obese mice. Advanced age also showed significantly different expression compared to controls for Klrk1 (P<0.01), and
cells may be present and how active they may be in the differing control, aged, and obese tumor microenvironments. GSEA was conducted once more on Obese vs. Control and Aged vs. Control groups, specifically examining immune-related gene sets. From this, 41 gene sets presented with a negative enrichment score, indicating they were upregulated in control mice compared to aged and obese. Of these, nine identified with CD8+ T-cell biology, and nine identified with CD4+ biology, prompting the investigating of these T-cell markers. Markers of T-cell presence were upregulated in control vs obese for Cd3e (P<0.05) and Cd8b (P<0.01) (Figure 7A-B). Markers of T-cell activation were decreased in obese vs controls for Cd86 (P<0.01) and the antigen on T-cells,
Cd28 (P<0.001) (Figure 7C-D). Advanced served as an intermediate, with decreased expression of Cd3e,Cd8b, and Cd86, but no statistical significance between either control or obese mice.
0.0 0.5 1.0 1.5 2.0 R el at iv e m R N A L ev el s Cd3e * 0.0 0.5 1.0 1.5 2.0 R el at iv e m R N A L ev el s Cd8b ** 0.0 0.5 1.0 1.5 2.0 R el at iv e m R N A L ev el s Cd86 ** 0.0 0.5 1.0 1.5 R el at iv e m R N A L ev el s Cd28 *** *
A
B
C
D
Discussion
This project aims to better understand the impact of advanced age and obesity on BC progression in a mouse model of Wnt driven, claudin-low BC Outcomes from this study indicate that biological age and adiposity similarly enhance BC progression. Combined with the facts that our population is aging and increasing burden with obesity, these findings emphasize the importance of investigating mechanisms underlying age- and obesity- related BC progression. In addressing this gap, our findings demonstrate that the aged and obese tumor microenvironments, which consists of multiple cell types including tumor, immune, endothelial and stromal cells, display similar gene expression alterations indicative of enhanced tumor aggression and reduced antitumor immunity. These findings are in agreement with enhanced tumor growth in these populations. Better understanding of these common biological underpinnings of g age- and obesity-related BC is a crucial step to in reducing outcome disparities in aged, obese and aged obese populations.
recapitulate human data demonstrating that both obesity and aging separately accelerate primary tumor growth.
Analysis of lung tissues, a common metastatic site of metMWNTLung BC cells, displayed that obesity induced the greatest incidence of metastasis compared to aged and control mice. When examining total metastatic signal (calculated from percent positive pixels), one control mouse exhibited the greatest percent positive signal. Interestingly, examination of multicentric vs. multifocal lesions further supported that obesity may increase BC metastasis. Obese mice demonstrated a greater number of lung tissues with multicentric lesions. This indicates that these metastatic tumors have formed separately in different quadrants of the lung tissue, instead of spreading from one metastatic tumor lesion as seen in the multifocal lung tissues.23,26 Multifocal vs. multicentric metastatic lesions in the literature show differences in tumor progression and survival.26 A retrospective study by Lynch et. Al26 found that patients with multicentric breast cancer metastatic lesions exhibit significantly shorter breast cancer specific survival rates and recurrence free survival, compared to multifocal breast cancer. Thus, obesity may contribute to more aggressive BC metastasis compared to aged and control mice. Due to the small sample size for our lung metastasis analysis, we are not powered to determine statistically significant differences among experimental groups. This serves as a limitation of our analysis. To resolve this, further examination of metastatic burden is underway, analyzing additional lungs as well as liver sections. Unfortunately, this work was not able to be completed in time for this report.
N-cadherin has been shown by several studies to promote BC invasiveness.29,30 Interestingly, cadherin levels were increased in aged relative to obese mice. Typically, a transition from E-cadherin to N-E-cadherin has been indicative of EMT. 27,28 However, a study by Nieman et al. suggested that N-cadherin promotes EMT transition and motility of BC cells regardless of the levels of expression of E-cadherin.29 Thus, both obesity and aging indicate increased EMT markers. In addition, both obesity and advanced age resulted in an increase in platelet derived growth factor receptor , which is associated with blood vessel growth and angiogenesis, allowing for greater oxygen and nutrients access for tumor cells and as a result increased proliferative potential.31 Both EMT and angiogenesis are hallmarks of cancer progression.32 These results suggest that obesity and aging lead to changes in the tumor microenvironment that promote tumor aggression.
mice. Expression of Cd86, found on antigen presenting cells, and Cd28, found on the surface of T-cells and serves as costimulatory signal for activation of T-cells, is reduced in obese and aged mice suggesting reduced stimulation of T-cells.36 However, gene expression data cannot conclusively discern whether the decreased IFN signaling is due to the lower abundance of T-cells, a decrease in activity of the T-cells present, or via another mechanism. Here, obesity and aging appear to follow similar immune surveillance changes, both resulting in a reduction of genes
Future directions for this work include histologically confirming mammary inflammation and tumor proliferation and angiogenesis. In addition, we aim to profile tumor infiltrating immune cell populations via flow cytometry to better understand the immune landscape of aged- and obese- tumor microenvironments. In parallel to examining gene expression changes in the tumor microenvironment, GSEA and RTq-PCR on extracted RNA from mammary fat pads will allow for the characterization of the tumor adjacent mammary adipose. In this, we are examining whether advanced age induces inflammation, similar to obesity, to foster a protumorigenic environment that would facilitate invasion and expansion of tumor mass into adjacent tissue. In addition, further analysis and quantification of lung and liver metastasis will occur
Conclusions
Works Cited
1. Siegel RL, Miller KD, Jemal A. Cancer statistics, 2019. CA Cancer J Clin. 2019;69(1):7-34. doi:10.3322/caac.21551.
2. NIH. Cancer Stat Facts: Female Breast Cancer.; 2015.
3. Perou CM. Molecular Stratification of Triple-Negative Breast Cancers. Oncologist. 2011. doi:10.1634/theoncologist.2011-s1-61.
4. Akslen LA, Fluge O, Pergamenschikov A, et al. Molecular portraits of human breast tumours. Nature. 2000;406(6797):747-752. doi:10963602.
5. American Cancer Society. Breast Cancer Facts & Figures 2017-2018.; 2018.
6. Prat A, Parker JS, Karginova O, et al. Phenotypic and molecular characterization of the claudin-low intrinsic subtype of breast cancer. Breast Cancer Res. 2010;12(5).
doi:10.1186/bcr2635.
7. Dias K, Dvorkin-Gheva A, Hallett RM, et al. Claudin-low breast cancer; clinical & pathological characteristics. PLoS One. 2017;12(1):1-17.
doi:10.1371/journal.pone.0168669.
8. Benz CC. Impact of aging on the biology of breast cancer. Crit Rev Oncol Hematol. 2008;66(1):65-74. doi:10.1016/j.critrevonc.2007.09.001.
9. Calle EE, Rodriguez C, Walker-Thurmond K, Thun MJ. Overweight, Obesity, and Mortality from Cancer in a Prospectively Studided Cohort of U.S. Adults. N Engl J Med. 2003;348(17):1625-1638. doi:10.1056/NEJMoa1709038.
10. Schonberg MA, Marcantonio ER, Li D, Silliman RA, Ngo L, McCarthy EP. Breast cancer among the oldest old: Tumor characteristics, treatment choices, and survival. J Clin Oncol. 2010;28(12):2038-2045. doi:10.1200/JCO.2009.25.9796.
11. Dao D, Zemla T, Jatoi A, et al. Older‐Patient‐Specific Cancer Trials: A Pooled Analysis of 2,277 Patients (A151715). Oncologist. 2019:theoncologist.2018-0803.
doi:10.1634/theoncologist.2018-0803.
12. Bellantuono I, Petrie A, Holmes A, et al. Does age matter? The impact of rodent age on study outcomes. Lab Anim. 2016;51(2):160-169. doi:10.1177/0023677216653984. 13. Dutta S, Sengupta P. Men and mice: Relating their ages. Life Sci. 2016;152:244-248.
doi:10.1016/j.lfs.2015.10.025.
15. Quial D, Dannenberg A. The obese adipose tissue microenvironment in cancer
development and progression. 2019;15(3):139-154. doi:10.1002/cncr.27633.Percutaneous. 16. Bowers LW, Rossi EL, McDonell SB, et al. Leptin Signaling Mediates
Obesity-Associated CSC Enrichment and EMT in Preclinical TNBC Models. Mol Cancer Res. 2018;16(5):869-879. doi:10.1158/1541-7786.mcr-17-0508.
17. O’Flanagan CH, Rossi EL, McDonell SB, et al. Metabolic reprogramming underlies metastatic potential in an obesity-responsive murine model of metastatic triple negative breast cancer. npj Breast Cancer. 2017;3(1):1-10. doi:10.1038/s41523-017-0027-5. 18. Hales CM, Carroll MD, Fryar CD, Ogden CL. Prevalence of Obesity Among Adults and
Youth: United States, 2015–2016. NCHS data brief, no 288. Hyattsville, MD: National Center for Health Statistics. NCHS data brief, no 288 Hyattsville, MD Natl Cent Heal Stat. 2017;(288):2015-2016. https://www.cdc.gov/nchs/products/databriefs/db288.htm.
19. Palmer AK, Kirkland JL. Aging and adipose tissue: potential interventions for diabetes and regenerative medicine. Exp Gerontol. 2016;86:97-105.
doi:10.1016/j.exger.2016.02.013.
20. Yuan Y, Jiang YC, Sun CK, Chen QM. Role of the tumor microenvironment in tumor progression and the clinical applications (Review). Oncol Rep. 2016;35(5):2499-2515. doi:10.3892/or.2016.4660.
21. Wang M, Zhao J, Zhang L, et al. Role of tumor microenvironment in tumorigenesis. J Cancer. 2017;8(5):761-773. doi:10.7150/jca.17648.
22. Schaub F, Reza S, Flaveny CA, et al. Fluorophore-NanoLuc BRET Reporters Enable Sensitive In Vivo Optical Imaging and Flow Cytometry for Monitoring Tumorigenesis. 2017;37(4):784-790. doi:10.1183/09031936.00063810.The.
23. Julia L. Oh. Multifocal or Multicentric Breast Cancer: Understanding Its Impact on Management and Treatment Outcomes. In: Methods of Cancer Diagnosis, Therapy and Prognosis. Springer, Dordrecht; 2008:583-597. doi:https://doi.org/10.1007/978-1-4020-8369-3_40.
24. Subramanian A, Tamayo P, Mootha VK, et al. Gene set enrichment analysis: A
knowledge-based approach for interpreting genome-wide expression profiles. Proc Natl Acad Sci. 2005;102(43):15545-15550. doi:10.1073/pnas.0506580102.
25. Lamouille S, Xu J, Derynck R. Molecular mechanisms of epithelial-mesenchymal transition. 2014;15(3):178-196. doi:10.1038/nrm3758.Molecular.
J Clin Med. 2016;5(2):13. doi:10.3390/jcm5020013.
28. Hugo H, Ackland L, Blick T, et al. Epithelial-Mesenchymal and Mesenchymal-Epithelial Transitions in Carcinoma Progression. J Cell Physiol. 2007;731(August 2006):720-731. doi:10.1002/jcp.
29. Nieman MT, Prudoff RS, Johnson KR, Wheelock MJ. N-cadherin promotes motility in human breast cancer cells regardless of their E-cadherin expression. J Cell Biol.
1999;147(3):631-643. doi:10.1083/jcb.147.3.631.
30. Hazan RB, Phillips GR, Qiao RF, Norton L, Aaronson SA. Exogenous expression of N-cadherin in breast cancer cells induces cell migration, invasion, and metastasis. J Cell Biol. 2000;148(4):779-790. doi:10.1083/jcb.148.4.779.
31. Andrae J, Gallini R, Betsholtz C. Role of platelet-derived growth factors in physiology and medicine. Genes Dev. 2008;22(10):1276-1312. doi:10.1101/gad.1653708.
32. Hanahan D, Weinberg RA. Hallmarks of cancer: The next generation. Cell. 2011;144(5):646-674. doi:10.1016/j.cell.2011.02.013.
33. Mojic M, Takeda K, Hayakawa Y. The dark side of IFN-γ: Its role in promoting cancer immunoevasion. Int J Mol Sci. 2018;19(1). doi:10.3390/ijms19010089.
34. Castro F, Cardoso AP, Gonçalves RM, Serre K, Oliveira MJ. Interferon-gamma at the crossroads of tumor immune surveillance or evasion. Front Immunol. 2018;9(MAY):1-19. doi:10.3389/fimmu.2018.00847.
35. Lieberman J. Granzyme A activates another way to die. Immunol Rev. 2010;235(1):93-104. doi:10.1111/j.0105-2896.2010.00902.x.
36. Sansom DM. CD28, CTLA-4 and their ligands: Who does what and to whom?