Effects of a Low Carbohydrate Diet on
Type 2 Diabetics - A Systematic Review
of the Literature
By
Matthew E Atkins
A Master's paper submitted to the faculty of the University of North Carolina at chapel Hill Partial Fulfillment of the requirements for the degree of Master of
Public Health in the Public Health Leadership Program
July, 2004
Purpose of this review: To determine whether type 2 diabetics treated with a low
carbohydrate diet of at least four weeks duration have better intermediate
outcomes, including glycemic control, hemoglobin Ale (HbgAlc), weight
reduction, insulin sensitivity, triglycerides (TG), and lipid levels compared to type
2 diabetics on a heart healthy or normal diet?
Background/Introduction
type 2 Diabetes
Type 2 diabetes is a chronic disease that affects a growing number of
Americans. Nearly 18.2 million Americans suffer from the disease today.15 As
the average age of the United States population has increased, so has the
F
incidence of obesity, hypertension, glucose intolerance, dyslipidemia, and type 2 ~
[--I
Tdiabetes. In fact, the prevalence of type 2 diabetes has slowly risen over the past
three decades, roughly paralleling the increase in the proportion of people,
including children and young people, who are either overweight or obese5 The
prevalence of type 2 diabetes in adults ages 40-74 increased from 8.9% during
1976-80 to 12.3% during 1988-19944 Furthermore, type 2 diabetes is being
diagnosed more frequently among younger and younger cohorts.
Type 2 diabetes is a leading cause of morbidity and mortality in the United
States, and is associated with both microvascular and macro vascular
complications7 Debilitating microvascular complications include blindness and
kidney failure8
Macrovascular complications, which comprise the majority of the
morbidity and mortality associated with diabetes, 17 include heart disease, stroke,
and amputation.17 Diabetics have a 2- to 4-fold higher risk of both coronary artery
disease and stroke than non-diabetics. In 2003, the number of deaths directly
attributable to diabetes was 47.7 per 10,000 individuals.15
In addition, diabetes is a disease of economic significance to the U.S.
health care system. The U.S. spent over 98 billion dollars on medical care and
lost productivity for type 2 diabetics in the 1997 fiscal year. 18
Current evidence suggests that tight glycemic control is the best way to
prevent many of the microvascular complications of type 2 diabetes. Several
studies have provided substantial evidence to support tight glycemic control. For
example, the Diabetes Control and Complications Trial (DCCT) and the United
Kingdom Prospective Diabetes Study (UKPDS) both showed that tight glycemic
control plays an important role in preventing the microvascular complications of
diabetes, including retinopathy, neuropathy, and nephropathy.19•20
The UKPDS enrolled 3,867 newly diagnosed type 2 diabetics. The
patients were randomized either to conventional diet control, sulphonylurea, or
insulin therapy. Over ten years, hemoglobin A1c was 7.0% in the intensive
therapy groups (i.e. sulphonylurea, insulin) compared to 7.9% in the conventional
diet group. The result was a highly significant 25% reduction in the number of
microvascular endpoints. There was no significant difference between insulin
therapy and treatment with a sulphonylurea. None of the individual drugs had an
adverse effect on cardiovascular outcomes, but all intensive treatment increased
L
reduction in macrovascular outcomes, including amputation and myocardial
infarction, convincing data in this area are lacking20
Thus, intensive blood-glucose control in patients with type 2 diabetes
substantially decreases the risk of microvascular complications but not
macrovascular disease. Tight glycemic control may best be achieved through a
combination of pharmacotherapy and lifestyle modifications.21
Diet Therapy for Diabetes
Dietary changes are one important lifestyle modification that play an
important role in managing diabetes. In both the UKPDS and DCCT, dietary
interventions played a key role in glycemic control.21•22 Several additional studies
have documented the effectiveness of dietary interventions in type 2 diabetics.
One study showed a 2.0% absolute decrease in HbA1, in patients with newly
diagnosed type 2 diabetes.23 Another study demonstrated a 1.0% absolute
decrease in HbA1, in patients with an average 4-year duration oftype 2 diabetes 24
In addition to tight glycemic control, other risk factors for cardiovascular
disease, such as hyperlipidemia and hypertension, are treated concurrently to
further lower risk. In fact, the UKPDS studies failed to demonstrate that tight
glycemic control leads to a decrease in macro vascular outcomes; the possibility
exists that other risk factors (e.g. hyperlipidemia, hypertension) for cardiovascular
disease may be more important. Thus, it is imperative that dietary
recommendations for diabetics address other risk factors for cardiovascular
disease in addition to glycemia.
Rationale for this study
In the middle of a rapidly growing obesity epidemic, patients are
constantly bombarded with fad diets and promises of amazing weight loss and
health benefits. Low-carbohydrate diets have recently resurfaced as a means of
rapid weight loss. Especially popular is the low carbohydrate diet promoted by
Robert Atkins, MD, requiring individuals to consume <20grams (g) of
carbohydrate a day during the initial stage of the diet. Because, by definition,
these diets are low in carbohydrates, many have proposed that they would be
especially beneficial for type 2 diabetics trying to stabilize their blood glucose
levels48.49•50 However, the long-term safety and efficacy ofthese diets remain
largely unknown. Both the American Heart Association and the American
Diabetes Association have cautioned against the use of these diets, pointing out
that excess consumption of proteins and fats may promote hyperlipidemia,
. . d. 1· bl. d 111· If · 26n 78
1mpmre msu m meta o ISm, an rena IVer rna unctwn.
·-Unfortunately, little is known about the long-term effects of a
low-carbohydrate diet on health. This study seeks to examine the current evidence for
recommending a diet low in carbohydrates for type 2 diabetics. What impact does
a low carbohydrate diet have on intermediate outcomes of health, including
glycemic control, HgbAl c, weight reduction, insulin sensitivity, triglycerides
(TGs), and lipid levels? Given the rising public interest in low carbohydrate diets,
it is important that we know how newly proposed diets will affect type 2 diabetic
. 103-104
Methods
Selection Criteria
Randomized controlled trials in the English language of patients with a
clinical diagnosis of type 2 diabetes were eligible if one of the following
interventions were included: low-carbohydrate, ketogenic, high protein, or high
fat diets. All interventions had to have a maximum carbohydrate content of 45%
of total energy, a level that was arbitrarily selected to include most "low
carbohydrate" diets in the scientific literature. Additionally, one of the following
outcomes had to be measured in the study: glycemia control, glycated hemoglobin,
insulin sensitivity, weight change, lipids, or triglycerides.
Studies were excluded if:
•
Participants were not type 2 diabetics, unless stratified randomization andanalysis was done separating the type 2 diabetic group from the non-type 2 diabetics.
•
Participants were pregnant•
At least one outcome of interest was not incorporated .•
Diets were not sustained for at least 4 days duration•
Multiple diets were included in the same studySearch Strategy and Data Sources
Searches were performed on PUBMED for studies that were published
between January 1, 1966, and March 16,2004 and met the eligibility
requirements. Studies indexed with the keywords such as diet, diabetes, and low
carbohydrate were sought (see Table 1 ). I also reviewed bibliographies of
retrieved articles to obtain additional citations.
Abstraction Methods
I reviewed 707 titles and abstracts identified by the combined MEDLINE
search (see Tablel). I extracted study design and participant data to identify those
studies that met inclusion criteria. I excluded duplicate studies of the same
participant group. I examined studies that included multiple diets or participant
groups for separate analysis ofthe type 2 diabetics. I excluded the studies without
separate analysis and study arms with diets not meeting inclusion criteria.
Data Abstraction
The author extracted three main types of data: I) The dietary intervention,
including percentage composition of carbohydrate, fat, and protein; 2) daily
caloric content; and, 3) diet duration. Study data included total number of
subjects, mean ages, and sex. The main outcome variables included weight
change, glycemic control, glycated hemoglobin, insulin levels, and measures of
serum lipid levels (low-density lipoprotein {LDL} cholesterol, high-density
lipoprotein {HDL} cholesterol, and serum triglycerides.
Internal Validity Check
To assign grades to any recommendation, determine the strength of
conclusions, or guide recommendations for future research, it is necessary to
perform a quality assessment. The author performed a quality assessment starting
at the point of study selection.
I contructed a modified version of Verhage's delphi list, a criteria list for
the quality assessment of randomized clinical trials for conducting systematic
included components capture generic methodological issues not just specific to
the subject area being reviewed. Specifically, the assessment components
determined if the studies:
• evaluated the similarity of baseline characteristics ofthe groups
• used effective means of randomization
• employed allocation concealment
• provided evidence of masking patients
• provided evidence of masking care providers
• provided evidence of masking outcome assessors
• provided point estimates of outcome variables with a measure of variability
• looked for protection against bias
• employed intention to treat analysis
I assigned an overall quality grade to each study; either poor, fair, or good.
Good quality studies scored an "adequate" on at least four of the nine components,
and included an adequate method of randomization and analyzized data on an
intent-to-treat basis. Adequate approaches to randomization included central
randomization, computer-generated random numbers or random number tables.
Inadequate approaches included use of alternation, case record numbers, birth
dates, or week days. A grade of unknown was reported for studies that simply
included the word "randomized" without further detail.
I gave an overall quality grade of fair to those studies that received an
adequate score on less than four components, or received an "unknown" on either
the approach to randomization or intent-to-treat analysis. A grade of poor was
reserved for studies that had major design flaws, including an inadequate
approach to randomization or data anlysis not performed on an intent-to-treat
basis.
TABLEl Literature Search Strategy
Description Articles
MELINE key word searches
Search 1, diet* 282,781
Search 2, diabetic 103,706
Search 3, NIDDM 30,829
Search 4, diabetes 212,085
Search 5, low carbohydrate* 645
Search 6, high fat* 6,531
Search 7, high protein* 3,807
Search 8, ketogenic 853
Search 9, isocaloric 2,951
Search 10, hypocaloric 753
Search 11, protein sparing 2,241
Search 12, carbohydrate restricted 6,908
Combine searches: 1 AND (2 OR 3 OR 4) AND (5 OR 6 707 OR 7 OR 8 OR 9 OR 10 OR 11 OR 12) LIMIT to
participant type: human Exclusion Criteria
Not an adult study 287
Articles not in English 73
Review articles 154
No dietary intervention 85
Study did not examine type 2 diabetes 76
Diet duration less than 4 days 47
No outcome of interest 95
Non-human trial 1
Inpatient study 5
Pregnancy study 10
Total articles excluded from those found in MEDLINE 635 search
Articles included from manual search of bibliographies 2 Articles not available free of charge from UNC libraries 52
Total articles included in analysis 12
Combined duplicate reports on the same study 0
€
B f/l
Ash et al. Facchini et al. Gutierrez et a1. Hollander et al. Heilbronn et al. Luscombe et al. Madigan et al. Markovic et al. Ozata et al. Nuttall et al. Parker et al. Samaha et al.
"
·~J
~
Adeq Adeq Adeq Unk Unk Unk Unk Unk Unk Adeq Unk Adeq~ <'·
::: ~ '1j
" ~ ·...:: c;; 0 <l)
p "' u u "' "
" 0 "
1--r ... 0
t--cau Unk Adeq Adeq Unk Unk Unk Unk Unk Adeq Adeq Unk Unk ;;;
:.
'§
.,... C'-· 00 " 00 "
'"·-""
0 00~
"'
I.:J.o Reported Reported Reported Reported Reported Reported Reported Reported Reported Reported Reported Reported
Legend: Unknown=Unk; Adequate""Adeq; Jnadequate""lnad
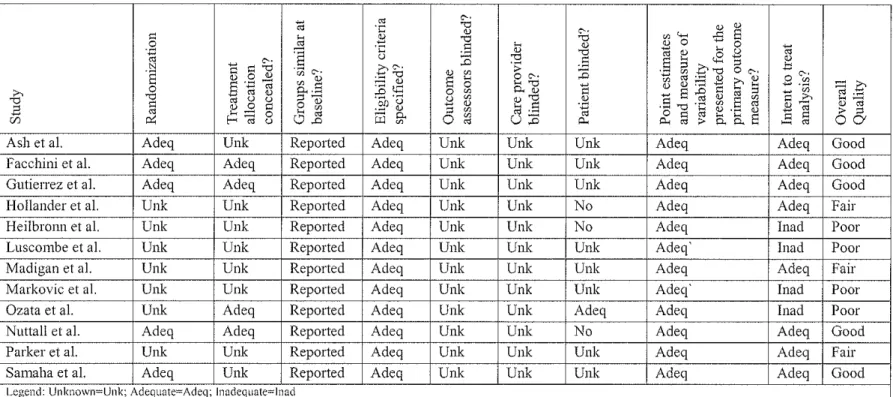
Table 2. Quality Assessment of Articles
·§
ll ·c
u
c
<'··-
.,
~ (jJ
.oc:1
:§'2
~ g.
Adeq Adeq Adeq Adeq Adeq Adeq Adeq Adeq Adeq Adeq Adeq Adeq <'·
.,
]
.0" 00
s
~ 0 00u 00
~
"
" 00
0 ::J
Unk Unk Unk Unk Unk Unk Unk Unk Unk Unk Unk Unk
.1l
·;:0 <'• ~.,
'""
..,.,
i;j.s
u::o
Unk Unk Unk Unk Unk Unk Unk Unk Unk Unk Unk Unk <'·.,
]
::0J
Unk Unk Unk No No Unk Unk Unk Adeq No Unk Unk" "
(/) 4--< ,..s:::
s
<l) 0 ... 0
iii (!)
s
£"
~ ~ ~ 0"'
'1j"
0 C'-·~a3~EQ~
-s{l5c;:t5J
s
'1j ·~ ~ .§ ~~§t:?iiO..S Adeq Adeq Adeq Adeq Adeq Adeq Adeq Adeq Adeq Adeq Adeq Adeq
~
0~ ~·-~ 00
".£':'
ll "'
"
"
-
"'
Adeq Adeq Adeq Adeq Inad Inad Adeq Inad Inad Adeq Adeq Adeq"'c
~;.=:" "'
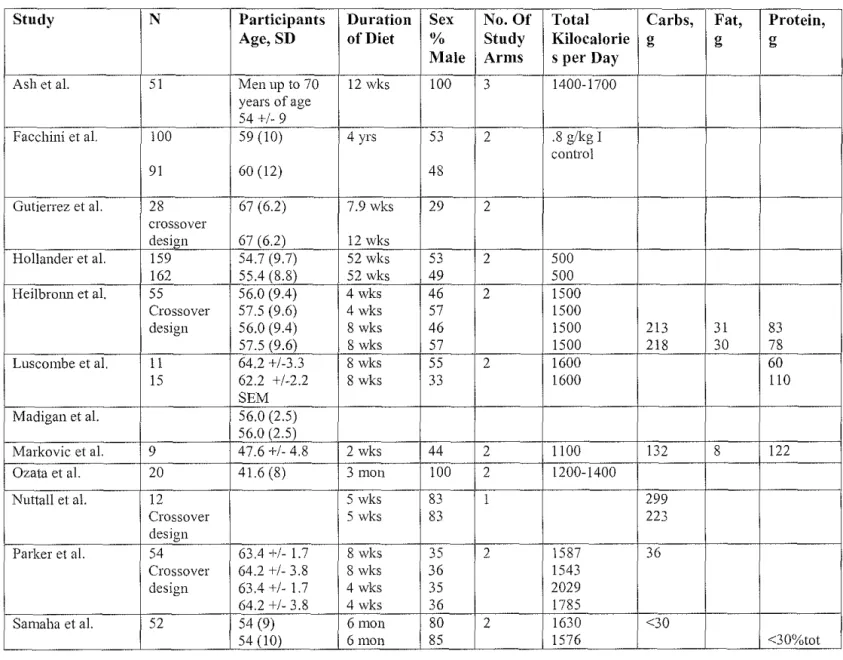
Table 3. Study Characteristics
Study N Participants Duration Sex No. Of Total Carbs, Fat, Protein,
Age, SD of Diet % Study Kilocalorie g g g
Male Arms s per Day
Ash et al. 51 Men up to 70 12 wks 100 3 1400-1700 years of age
54+/- 9
Facchini et al. 100 59 (10) 4 yrs 53 2 .8 g/kg I control
91 60 (12) 48
Gutierrez et al. 28 67 (6.2) 7.9 wks 29 2 crossover
design 67 (6.2) 12 wks
Hollander et al. 159 54.7 (9.7) 52 wks 53 2 500
162 55.4 (8.8) 52 wks 49 500
Heilbrmm et al. 55 56.0 (9.4) 4 wks 46 2 1500 Crossover 57.5 (9.6) 4 wks 57 1500
design 56.0 (9.4) 8 wks 46 1500 213 31 83
57.5 (9.6) 8 wks 57 1500 218 30 78
Luscombe et al. 11 64.2 +/-3.3 8 wks 55 2 1600 60
15 62.2 +/-2.2 8 wks 33 1600 110
SEM Madigan et al. 56.0 (2.5)
56.0 (2.5)
Markovic et al. 9 47.6 +/- 4.8 2 wks 44 2 1100 132 8 122 Ozata et al. 20 41.6 (8) 3 mon 100 2 1200-1400
Nuttall et al. 12 5 wks 83 1 299
Crossover 5 wks 83 223
design
Parker et a!. 54 63.4 +/- 1.7 8 wks 35 2 1587 36 Crossover 64.2 +/- 3.8 8 wks 36 1543
design 63.4 +/- 1.7 4 wks 35 2029 64.2 +1-3.8 4 wks 36 1785
Samaha et al. 52 54 (9) 6mon 80 2 1630 <30
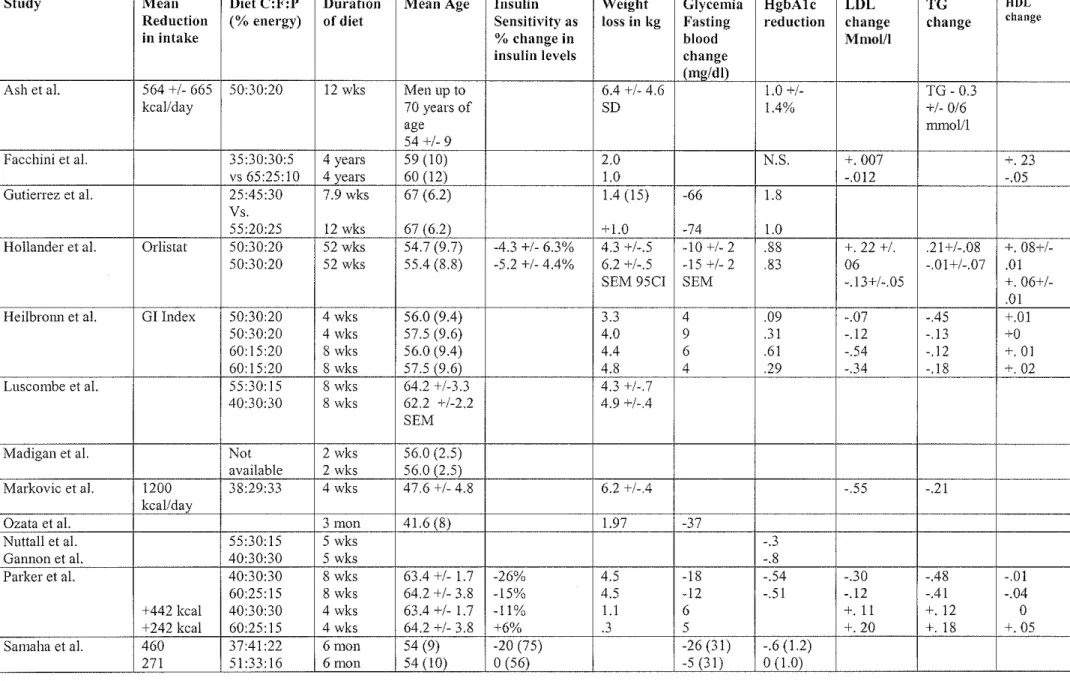
Table 4. Outcomes oflnterest
Study Mean Diet C:F:P Duration Mean Age Insulin Weight Glycemia HgbAlc LDL TG fiDL
Reduction (%energy) of diet Sensitivity as loss in kg Fasting reduction change change change
in intake 0/o change in blood Mmol/1
insulin levels change
(mg/dl)
Ash et al. 564 +/- 665 50:30:20 12 wks Men up to 6.4 +/- 4.6 1.0 +/- TG- 0.3
kcal/day 70 years of SD 1.4% +/- 0/6
age nm1o111
54+/-9
Facchini et al. 35:30:30:5 4 years 59 (10) 2.0 N.S. +.007 +. 23
vs 65:25:10 4 years 60 (12) 1.0 -.012 -.05
Gutierrez et al. 25:45:30 7.9 wks 67 (6.2) 1.4(15) -66 1.8 Vs.
55:20:25 12 wks 67 (6.2) + 1.0 -74 1.0
Hollander et al. Orlistat 50:30:20 52 wks 54.7 (9.7) -4.3 +/- 6.3% 4.3 +1-.5 -10+/-2 .88 +. 22 +/. .21+/-.08 +. 08+/-50:30:20 52 wks 55.4 (8.8) -5.2 +/- 4.4% 6.2 +/-.5 -15 +/- 2 .83 06 -.01+/-.07 .01
SEM 95CI SEM -.13+/-.05 +.
06+1-.OJ Heilbrmm et al. GI Index 50:30:20 4 wks 56.0 (9.4) 3.3 4 .09 -.07 -.45 +.01
50:30:20 4 wks 57.5 (9.6) 4.0 9 .31 -.12 -.13 +0
60:15:20 8 wks 56.0 (9.4) 4.4 6 .61 -.54 -.12 +.OJ
60:15:20 8 wks 57.5 (9.6) 4.8 4 .29 -.34 -.18 +. 02
Luscombe et al. 55:30:15 8 wks 64.2 +/-3.3 4.3 +/-.7 40:30:30 8 wks 62.2 +/-2.2 4.9 +/-.4
SEM
Madigan et al. Not 2 wks 56.0 (2.5) available 2 wks 56.0 (2.5)
Markovic et al. 1200 38:29:33 4 wks 47.6 +/- 4.8 6.2 +/-.4 -.55 -.21 kcallday
Ozata et al. 3 mon 41.6 (8) 1.97 -37
Nuttall et al. 55:30:15 5 wks -.3
Gannon et al. 40:30:30 5 wks -.8
Parker et al. 40:30:30 8 wks 63.4 +/- 1.7 -26% 4.5 -18 -.54 -.30 -.48 -.01 60:25:15 8 wks 64.2 +/- 3.8 -15% 4.5 -12 -.51 -.12 -.41 -.04 +442 kcal 40:30:30 4 wks 63.4 +/- 1.7 -11% 1.1 6 +. 11 +. 12 0 +242 kcal 60:25:15 4 wks 64.2 +/- 3.8 +6% .3 5 +.20 +. 18 +.05 Samaha et al. 460 37:41:22 6mon 54 (9) -20 (75) -26(31) -.6 (1.2)
271 51:33:16 6mon 54 (10) 0 (56) -5 (31) 0 (1.0)
13
·---t
L
Ill. Results
Articles Identified
My MEDLINE search identified a total of707 potentially eligible articles. Reference searching
identified two additional stndies. After abstract review, a total of 64 articles met the inclusion criteria.
Twelve of these articles were available free of charge through UNC libraries and were included in the
analysis (Table 1).
Quality of the Studies
The modfied version oft he Delphi list, a criteria list for the quality assessment of randomized
clinical trials for conducting systematic reviews was applied to the identified studies. Table 2
summarizes the results of this assessment. Overall, five of the 12 studies received a grade of good.
Three of 12 received a grade of fair, and the remaining four had a major methodological flaw and
received a grade of poor.
All 12 of the identified studies clearly specified the eligibility criteria. All 12 reported similar
baseline characteristics of the groups initially and presented point estimates and a measure of variability
for the outcomes of interest. Only four of the studies clearly stated the method of randomization; the
other eight simply employed the word "randomized." The treatment allocation was determined to be
blinded from the physicians in only four ofthe studies; the other eight did not provide enough
information to deduce this. None of the studies stated whether the outcome assessors were blinded.
Four of the 12 did not employ intent-to-treat analysis, and received the grade of "poor" overall
quality. The four "poor" quality studies are excluded from subsequent analysis and discussion in this
Study Characteristics
The eight "fair" or "good" quality studies included a total of 18 different dietary interventions
(Table 3). All ofthe studies were randomized controlled trials in which the patients were randomized to
one of two or more dietary interventions. Additionally, the studies varied in design, as three of the
studies were crossover designs. In these three studies, the patients first were randomized to receive one
diet, then after a specified period of time received a second diet. The number of participants in the
studies ranged from 12 to 391.
Some of the diets included a washout phase at the beginning of the study during which patients
received s standard diet intended to mimic their normal diets in caloric and carbohydrate content. In
these studies, the weight at end of washout period was recorded as the patients' baseline weights.
Diet Characteristics
The dietary interventions were also highly heterogeneous. The duration of the diets ranged from
4 weeks to 52 weeks (Table 4). Furthermore, the average number of kilocalories per day ranged from
500 kcal/day to 2029 kcal/day (Table 3). The percentage of carbohydrate in the diets ranged from 25%
to 65% of total energy, and only five of the eight "fair" or "good" quality diets included the total daily
kilocalorie intake. Five of the diets reported dietary composition ranges in grams of carbohydrates,
proteins, and fat.
Most of the dietary interventions prescribed a diet and had the patients keep a daily log. This
self-reported log was used to calculate the actual dietary interventions' total calories and amount of
carbohydrate in diet. A few studies actually provided prepackaged meals to ensure that participants
received precisely the prescribed dietary intervention. The Madigan dietary intervention included a
Patient Characteristics
The average age of participants in the different studies ranged from 41.6 to 67 years (Table 3).
Two of the studies examined only men. The Facchini study recruited a cohort of more advanced type 2
diabetic patients referred to nephrology clinics for various degrees of renal failure and otherwise
unexplained proteinuria. The Gutierrez study included an arm of patients treated with second-generation
sulfonylurea agents. The Parker study excluded patients with any degree of proteinuria.
Several of the studies were limited to patients with varying degrees of obesity. For example, the
Ash cohort included men with a body mass index (BMI) between 25 and 40. The Hollander study
included patients with a BMI ranging between 28 and 40, and the Samaha study cohort included only
severely obese patients with an average BMI of 43.
Outcome Measures for the Low-Carbohydrate Interventions
Three of the studies reported insulin sensitivity as a percent change in serum insulin levels. The
Parker study showed a greater decrease in serum insulin levels in the two arms that had lower
carbohydrate contents (60% versus 40%). The Samaha study, which included an arm with 37%
carbohydrate content, showed a decrease in serum insulin level compared to the 51% carbohydrate arm,
which showed no change. The Hollander study included two 50% carbohydrate arms which both
showed a comparable decrease in serum insulin levels
Change in weight was reported in all but two of the studies. Most of the studies showed weight
loss of varying degrees. The weight in most of the studies was usually greater in the low carbohydrate
groups.
Fasting blood glucose levels also dropped in most ofthe studies. In the Guitierrez, Parker, and
Samaha studies, the decrease in fasting blood glucose was greater in the lower carbohydrate containing
diets.
17
f
J
j
~--All ofthe diets demonstrated a reduction in glycated hemoglobin Ale levels, except for the
Facchini study, which failed to demonstrate any significant increase or decrease. The Gutierrez, Nuttall,
Samaha, and Parker studies showed a greater reduction in the low carbohydrate arm
The lipid findings were equivocal. The Facchini study found a greater drop in LDL in the high
carbohydrate containing arms, but Parker found the converse. The Parker study demonstrated an
increase in LDL levels in two of the arms, which was greater in the higher carbohydrate-containing arm.
Similar equivocal results were found for triglyceride levels
A change in HDL levels was reported in three of the dietary interventions. Facchini show an
increase in the 35% carbohydrate-containing mm, but a decrease in levels in the 65%
carbohydrate-containing arm. Parker showed a small increase in one 60% carbohydrate-carbohydrate-containing arm, compared to
no change in the 40% containing arm. The other two Parker arms both showed decreases in HDL levels,
with a greater decrease in the 60% containing arm.
IV. Discussion
Based on the current studies, the evidence suggests that adherence to a low carbohydrate diet of
at least four days duration may lead to weight loss and lower semm insulin levels. However, the data
are equivocal for the other intermediate outcomes, including serum glucose levels, hemoglobin A I c, and
lipid levels.
There is variability among studies with regard to internal validity. Many studies may be biased
due to unsuitable comparison interventions, lack of blind outcome assessment, inadequate follow-up
times, and inability to define or assess relevant outcomes, or unreliable measurement techniques. The
variation in the quality of selected primary studies has implications for data synthesis, interpretation of
L
For example, the Gutierrez study's crossover design makes interpretation of results difficult.
Patients are first on low carbohydrate/high fat diet, and then cross over to a higher carbohydrate L
containing diet. Measuring the change in outcome variables using data from the beginning of the low
carbohydrate diet period may not be valid, as patients were not eating their normal diet at that time.
This problem was not unique to the Gutierrez study, as some of the other studies had run-in periods
while others did not. Prescribing a particular dietary intervention to a patient at the clinic cannot be
based upon changes from a run-in period diet, unless that diet reflects what the patients normally
consume. In this way, nm-in periods and crossover designs may hurt the external validity ofthe
studies' results.
Many of the studies were small and had limited power to detect significant differences in
between intervention groups. In fact, few of the differences in outcomes outside of weight loss were
significant. Over half the studies had less than 60 total participants. Difficulties and complexities in
monitoring the dietary intake of individuals are likely to be one reason the studies have been small to
date. A meta-analysis would be useful but extremely difficult to conduct due to the heterogeneity ofthe
individual interventions.
The Ash study and Samaha study both suffered drop-outs. The Ash study lost only 5 of 51
patients to follow-up. The subjects lost were similar between groups and were comparable to the
original population with regards to baseline characteristics. The Samaha study had a much higher
drop-out rate, losing 53 of 132 patients to follow-up, and used last observation carried forward for those who
dropped out. Although the study showed an increase in insulin sensitivity and improved glycemic
control markers, it is possible the results were influenced by the high drop-out rate. Thirty-two of the 53
drop-outs came from the higher carbohydrate group. It is possible that individuals compliant with the
higher carbohydrate (and lower fat-containing) diet were more likely to drop-out from the study than
individuals who were less compliant. This could skew results if those compliant individuals would have
lost weight and reaped some of the clinical benefits associated with weight loss.
Additionally, many of the studies provided prepackaged meals to participants, which means
larger trials would cost significantly more. Furthermore, supplying participants with prepackaged meals
is a threat to the study's external validity. A physician or dietician in the field prescribing a low
carbohydrate diet to a patient will likely not be supplying the prepackaged meals to ensure compliance,
and application to long-term therapy is limited by the patients' willingness to pay for prescribed meals.
Regardless, the use of prepackaged meals for a short period of time was thought to transfer knowledge
of appropriate portion sizes and food types to patients. However, the Ash study included a subsequent
follow-up 15 months after the free supply of prepackaged meals to patients was discontinued, and the
weight loss was not sustained in the long term. This result is consistent with previous studies providing
prepackaged meals51
Another factor that contributes to the heterogeneity and makes comparisons more difficult
among studies is the fact that some of the studies use the simple prescription of a particular diet as the
intervention, while others relied on a dietary recall or diary to evaluate whether the patients actually
followed the prescribed diet. Still others provide prepackaged meals to avoid recall bias and ensure the
accuracy of data. It is likely that patient adherence varies between the different dietary intervention
types. The studies relying solely on the prescription of a diet may have the most external validity, as
that is what physicians and dieticians will be doing in the field.
However, it is important that we not draw conclusions about the efficacy of a low carbohydrate
diet from studies relying on dietary recall to ensure compliance. Sources of error in short-term dietary
recalls and records have been well documented40'41 Most the studies included in this review relied on
t_ L
subject recall or records, and are thus subject to several biases.40 These errors may be respondent or
recorder based.
Respondent based errors stem from the fact that accurate recall depends on several factors. The
respondents must be motivated, aware of their food intake, and have adequate memory and
communication skills. One study found that respondent knowledge of the study's purpose affected the
measurement of food intake41 The same study also showed that respondent fatigue, related to length of
survey, influenced results. Another study showed that continual contact with physicians increased the
accuracy of the reports.42 A third study found that men frequently did not list all the food they
consumed because they were embarrassed to admit how much they had consumed43 All of these
respondent based errors affect the external validity of the studies.
Many of the studies in this review relied on dietary logs with the subject using household
measures to estimate the quantity eaten (i.e. a "fistful" of beans, or even more inaccurate, a "large or
small" portion). These household measures are then converted to grams by the investigators. However,
the type of conversion inevitably leads to a loss of precision. A study by Guthrie et al. found that
amounts of butter, salad dressing, cereal, and salads were overestimated by more than 51% over
two-thirds of the time, and the intake of salad dressings, butter, sugar, and salad were underestimated by at
least 51% a quarter of the time44 To make matters worse, some specific types of foods tend to be
erroneously recalled while others tend to be erroneously omitted. A 1985 study found that cooked
vegetables tend to be omitted more frequently than other types of food, while sugar containing foods
4'
tend to be erroneously recalled more frequently.·'
A study by Prentice et al. compared the energy expenditures of a group of lean and a group of
obese women with their self-reported dietary records.46 They used isotopically measured total energy
expenditures and found that the obese group had a 28 percent higher daily energy expenditure than the
~--r
L
lean group, but tended to underestimate tbeir intake by 837 kcal/day. The lean group accurately
self-estimated their intake. This bias has significant implications for this review, as many of the included
studies were of obese patients. If obese patients tend to underreport the amount of carbohydrate they
consume and low-carbohydrate diets contribute to a feeling of satiety, then it is possible that control
groups eating higher amounts of carbohydrate are underreporting their consumption in some ofthe
studies.
Frank et al. found that the amount of training an interviewer receives can effect the amount of
food recalled, and thus has implications for comparing the results of more than one study47 Well-trained
interviewers using a detailed protocol substantially improved the reliability and reproducibility of
dietary recalls. Furthermore, the behavior ofthe interviewer may affect results, especially if more than
one interviewer is used in a study.40 The manner of asking questions can affect answers, and the
resulting information may vary depending on whether the probing is general or detailed. This facet
undoubtedly contributes to the heterogeneity of the studies. Unfortunately, very few of the studies state
what kind of training the interviewers received in detail, or how many different interviewers were used.
Studies of prescribed diets, which measure effectiveness, may provide more externally valid
results, as this is what health care professionals will be doing in the field. Furthermore, dietary
prescriptions that require patients to keep a log of their meals may not be comparable to prescription
alone, as there may be benefit in requiring subjects to write down their intake daily. All of these factors
make comparisons and conclusions a very messy business.
Most of the studies are consistent with the hypothesis that weight loss produces improvements in
glycemic control. In general, the most hypocaloric diets seem to have better results. However, the
included diets in this review were not isocaloric. Additionally, the low-carbohydrate diets vary
L
diets. Since only one of the diets reported the main reduction in caloric intake from baseline (Ash et al.),
it is difficult to ascertain whether the beneficial effects in any of the outcome variables are due to the
implementation of a low carbohydrate diet or a low caloric diet which leads to weight loss in general.
Conversely, some authors hypothesize that dietary interventions that are low in carbohydrate
lead to weight loss because more fat or protein helps provide a feeling of satiety. Patients on low
carbohydrate diets may consume less food and less overall total calories compared to a higher
carbohydrate diet. Less overall caloric intake then leads to weight loss, and we see the usual benefits
associated with weight loss. If this is true, then setting up randomized controlled trials with isocaloric
diets would negate the satiety effects of the diet and intervention group would be similar to the control
group.
Source of error
If I were to publish this systematic review, a huge potential bias exists. After abstract review, a
total of 68 articles were identified that may have met the inclusion criteria. Fifty-two ofthese were not
available free of charge. Of the 16 that were acquired, only 12 of these (75%) met the inclusion criteria
after careful examination. Thus, of the remaining 52 unacquired articles, if 75% of these truly met the
inclusion criteria, 36 articles were omitted. It is noteworthy that the UNC health science library
provides free access to the more reputable journals, and it is likely the included studies are of higher
quality than the omitted studies.
Conclusion and Recommendation
In conclusion, the data regarding the effectiveness of low carbohydrate diets for type 2 diabetics
-are limited. The studies have been small, of varying quality, and very heterogeneous with respect to
dietary interventions and methodology. Weight loss, in general, is probably beneficial for type 2
diabetics. However, there is insufficient evidence to recommend for or against the specific use oflow
carbohydrate dietary interventions in type 2 diabetics. Larger studies of better quality must be
conducted and methodology must be standardized to allow pooling of data. It is possible that the dietary
interventions must stay below a maximum threshold of dietary carbohydrate for benefits to be elicited.
Furthermore, new variables such as the glycemic index of the carbohydrates included in the diet or what
food replaces the carbohydrates may be equally important. Future research must address these questions.
Based on the current evidence, it is this author's opinion that type 2 diabetics should be
counseled that weight loss in general will be beneficial, providing them with numerous well documented
health benefits. If individuals wish to pursue weight loss through a low carbohydrate diet, physcians
should advise them that conslusive evidence of their benefits independent of weight loss is lacking, and
that the long term effects of low carbohydrate diets are largely unknown.
V, References
1. United States Preventive Services Task Force. Guide to Clinical Preventive Services. 2nd ed.
Alexandria, VA: Office of Disease Prevention and Health Promotion; 1996.
2. Harris R, Donahue K, Rathore S, Frame P, WoolfS, Lohr KN. Screening adults for type 2 diabetes: a
review of the evidence for the U.S. Preventive Services Task Force. Ann Intern Med 2003; 138:215-290.
3. Harris R, Lux L, Bunton A, et al. Screening for type 2 Diabetes Mellitus: Systematic Evidence Review No. 19 (Prepared by Research Triangle Institute-University of North Carolina Evidence-based Practice Center under Contract No. 290-97-0017). Rockville, MD. Agency for Healthcare Research and Quality. May 2002 (Available on the AHRQ Web site at: www.ahrq.gov/clinic!serl1lcs.htm).
4. Harris MI, Flegal KM, Cowie CC, et al. Prevalence of diabetes, impaired fasting glucose, and impaired glucose tolerance in U.S. adults: the third National Health and Nutrition Examination Survey,
1988-1994. Diabetes Care 1998;21 :518-524.
5. Boyle JP, Honeycutt AA, Narayan KM, et al. Projection of diabetes burden through 2050: impact of
changing demography and disease prevalence in the U.S. Diabetes Care 2001;24:1936-40.
6. Moss SE, Klein R, Klein BE. The incidence of vision loss in a diabetic population. Ophthalmology
1988;95(1 0): 1340-8.
7. Eastman RC, Javitt JC, Herman WH, et al. Model of complications ofNIDDM. I. Model construction
8. Eastman RC, Javitt JC, Herman WH, eta!. Model of complications ofNIDDM. II. Analysis of the health benefits and cost-effectiveness of treating NIDDM with the goal ofnormoglycemia. Diabetes
Care 1997;20(5):735-744.
9. Humphrey LL, Ballard DJ, Frohnert PP, Chu CP, O'Fallon WM, Palumbo PJ. Chronic renal failure in non-insulin-dependent diabetes mellitus. A population-based study in Rochester, Minnesota. Ann Intern
Med 1989;111(10):788-796.
10. Resnick HE, Valsania P, Phillips CL. Diabetes mellitus and nontraumatic lower extremity amputation in black and white Americans: The National Health and Nutrition Examination Survey Epidemiologic Follow-up Study, 1971-1992. Arch Intern Med 1999;159:2470-275.
11. Humphrey LL, Palumbo PJ, Butters MA, eta!. The contribution of non-insulin-dependent diabetes to lower-extremity amputation in the community. Arch Intern Med 1994;154:885-892.
'
f-12. UK Prospective Diabetes Study Group. Intensive blood-glucose control with sulphonylureas or b
insulin compared with conventional treatment and risk of complications in patients with type 2 diabetes F
(UKPDS 33). Lancet 1998;352(9131):837-853.
l
13. Moss SE, Klein R, Klein BE. The 14-year incidence oflower-extremity amputations in a diabetic -~-·· population. The Wisconsin Epidemiologic Study of Diabetic Retinopathy. Diabetes Care
1999;22(6):951-959.
F
14. American Diabetes Association. Economic consequences of diabetes mellitus in the U.S. in 1997.
Diabetes Care 1998;21:296-309.
15. Diabetes statistical fact sheet available at Diabetes.org (ADA website)
16. Recommendations and Rationale Screening for type 2 Diabetes Mellitus in Adults By the U.S. Preventive Services Task Force (USPSTF)
17. Haffner SM: Management ofdyslipidemia in adults with diabetes (Technical Review). Diabetes
Care 21:160-178, 1998
18. American Diabetes Association. Economic consequences of diabetes mellitus in the U.S. in 1997.
Diabetes Care 1998;21:296-309.
19. Diabetes Control and Complications Trial Research Group: The effect of intensive treatment of diabetes on the development and progression oflong-term complications in insulin-dependent diabetes mellitus. N Eng! J Med 329:977-986, 1993
20. U.K. Prospective Diabetes Study (UKPDS) Group: Intensive blood-glucose control with
sulphonylureas or insulin compared with conventional treatment and risk of complications in patients with type 2 diabetes (UKPDS 33). Lancet 352:837-853, 1998
21. Delahanty LM, Halford BH: The role of diet behaviors in achieving improved glycemic control in
intensively treated patients in the Diabetes Control and Complications Trial. Diabetes Care
16:1453-1458, 1993
22. UKPDS Group: UK Prospective Diabetes Study 7: Response of fasting plasma glucose to diet
therapy in newly presenting type U patients with diabetes. Metabolism 39:905-912, 1990
23. UKPDS Group: UK Prospective Diabetes Study 7: Response of fasting plasma glucose to diet
therapy in newly presenting type U patients with diabetes. Metabolism 39:905-912, 1990
24. Franz MJ, Monk A, Barry B, McLain K, Weaver T, Cooper N, Upham P, Bergenstal R, Mazze R: Effectiveness of medical nutrition therapy provided by dietitians in the management of
non-insulin-dependent diabetes mellitus: a randomized, controlled clinical trial. JAm Diet Assoc 95: I 009-1017,
1995
25. Verhage AP, de Vet HC, de Bie RA, Kessels AG, Boers M, Bouter LM, det a!. The delphi list a criteria list for quality assessment of randomized clinical trials for conducting systematic reviews
developed by delphi consensus J Clin Epidemio/1998;51: 1235-1241.
26. Stein K High-protein, low-carbohydrate diets: do they work? JAm Diet Assoc. 2000;1 00:760761.
27. St Jeor ST, Howard BV, Prewitt TE, Bovee V, Bazzarre T, Eckel RH. Dietary protein and wieght reduction: a statement for the Healthcare Professionals From the Nurtrition Committee of the Council on Nutrition, Physical Activity, and Metabolism of the American Heart Association. Circulation. 2001 ;104:1869-1874.
28. Nuttall FQ, Gannon MC, Saeed A, Jordan K, Hoover H.
The metabolic response of subjects with type 2 diabetes to a high-protein, weight-maintenance diet.
J Clin Endocrinol Metab. 2003 Aug; 88(8): 3577-83.
29. Ash S, Reeves MM, Yeo S, Morrison G, Carey D, Capra S.
Effect of intensive dietetic interventions on weight and glycaemic control in overweight men with Type
II diabetes: a randomised trial.
Int JObes Relat Metab Disord. 2003 Jul; 27(7): 797-802.
30. Samaha FF, Iqbal N, Seshadri P, Chicano KL, Daily DA, McGrory J, Williams T, Williams M,
Gracely EJ, Stem L. A low-carbohydrate as compared with a low-fat diet in severe obesity.
N Eng! J Med. 2003 May 22; 348(21): 2074-81.
31. Facchini FS, Saylor KL. A low-iron-available, polyphenol-enriched, carbohydrate-restricted diet to
slow progression of diabetic nephropathy. Diabetes. 2003 May; 52(5): 1204-9.
32. Luscombe ND, Clifton PM, Noakes M, Parker B, Wittert G. Effects of energy-restricted diets
containing increased protein on weight loss,
resting energy expenditure, and the thermic effect offeeding in type 2
33. Parker B, Noakes M, Luscombe N, Clifton P. Effect of a high-protein, high-monounsaturated fat
weight loss diet on glycemic control and lipid levels in type 2 diabetes. Diabetes Care. 2002 Mar; 25(3):
425-30.
34. Heilbronn LK, Noakes M, Clifton PM. The effect of high- and low-glycemic index energy restricted diets on plasma lipid and glucose profiles in type 2 diabetic subjects with varying glycemic
control. JAm Coil Nutr. 2002 Apr; 21(2): 120-7.
35. Ozata M, Oktenli C, Bingo! N, Ozdemir IC. The effects ofmetforrnin and diet on plasma testosterone and leptin levels in
obese men. Obes Res. 2001 Nov; 9(11): 662-7.
36. Madigan C, Ryan M, Owens D, Collins P, Tomkin GH. Dietary unsaturated fatty acids in type 2 diabetes: higher levels of postprandial lipoprotein on a linoleic acid-rich sunflower oil diet compared
with an oleic acid-rich olive oil diet. Diabetes Care. 2000 Oct; 23(10): 1472-7.
37. Gutierrez M, Akhavan M, Jovanovic L, Peterson CM. Utility of a short-term 25% carbohydrate diet
on improving glycemic control in type 2 diabetes mellitus. JAm Coil Nutr. 1998 Dec; 17(6): 595-600.
38. Hollander P A, Elbein SC, Hirsch IB, Kelley D, McGill J, Taylor T, Weiss SR, Crockett SE, Kaplan
RA, Comstock J, Lucas CP, Lodewick PA, Canovatchel W, Chung J, Hauptman J. Role of orlistat in the
treatment of obese patients with type 2 diabetes. A !-year randomized double-blind study. Diabetes
Care. 1998 Aug; 21(8): 1288-94.
39. Markovic TP, Campbell LV, Balasubramanian S, Jenkins AB, Fleury AC, Simons LA, Chisholm DJ. Beneficial effect on average lipid levels from energy restriction and fat loss in obese individuals with or
without type 2 diabetes. Diabetes Care. 1998 May; 21(5): 695-700.
40. Wllett, W. Nutritional Epidemiology, 1st Edition. 1990 Oxford University Press. 50-74.
41. Hackett AF, Appelton DR, Rugg-Gunn AJ, and Eastoe JE. Some influences on the measurement of
food intake during a dietary survey of adolescents. Hum. Nut. Applied Nutr. 1985 39A. 167-177.
42. Kim WW, Kelsay JL, Judd IT, Marshall MW, Mertz W, and Prather EW. Evaluation oflong-terrn
dietary intakes of adults consuming self-selected diets. Am. J Clin. Nutr. 1984 40(Suppl.), 1333-1337.
43. Paul OM, Lepper H, Phelan WH, Dupertuis GW, MacMillan A, McKean H, and Park H. A
longitudinal study of coronary heart disease. Circulation 1973 (28), 20-31.
44. Guthrie HA, Selection and quantification oftypical food portions by young adults. J Am. Diet.
Assoc. 1984 84, 1440-1444.
45. Karvetti R, and Knuts. Validity of the 24-hour recall. JAm. Diet. Assoc. 1985 (85) 1437-1442.
27
t
l
f
r-f
J
46. Prentice AM, Black AE, Coward W A, Davies HL, Goldberg GR, Murgatroyd PR, Ashford I, Sawyer M, and Whitehead RG. High levels of energy expenditure in obese women. Br. Med. J 1986 292, 983-987.
47. Frank GC, Holatz AT, Weber, LS, Berenson GS. Effects of interviewer recording practices on nutrient intake-Bogalusa heart study. JAm. Diet. Assoc. 1984, 1432-1439.
48. Bilsborough S.A. and Crowe T.C. Low-carbohydrate diets: what are the potential short- and long-term health implications? Asia Pacific Journal of Clinical Nutrition 2003;12(4): 396-404
49. Hays, J.H., Gorman, R.T., et al. Results of Use ofMetformin and Replacement of Starch With Saturated Fat in Diets of Patients With type 2 Diabetes," Endocrinology Practice, 8(3), 2002, pages 177-183.
50. Hickey, J.T., Hickey, L., Yancy, W.S., eta!. Clinical Use of a Carbohydrate-Restricted Diet to Treat the Dyslipidemia of the Metabolic Syndrome, Metabolic Syndrome and Related Disorders, 2004, 1(3), pages 227-232.