Early Screening for Gestational Diabetes Mellitus: A Systematic Review
by Dana K Kelley
A Master’s Paper submitted to the faculty of the University of North Carolina at Chapel Hill in partial fulfillment of the
require-ments for the degree of Master of Public Health in the Public Health Leadership Program
Chapel Hill 2016
Contents
Abstract...3
Introduction ...5
Defining Gestational Diabetes Mellitus ...5
Gestational Diabetes and Associated Risks ...5
Screening for Gestational Diabetes Mellitus...6
Justification for a Systematic Review ...8
Methods ...9
Search Strategy ...9
Inclusion/Exclusion Criteria ...10
Study Selection...12
Synthesis of Evidence ...12
Results ...13
Study Selection...13
Study Characteristics ...14
KQ1: Accuracy and Early Screening ...17
Fasting Plasma Glucose ...17
Oral Glucose Tolerance Test ...19
Glycosylated Hemoglobin ...19
KQ2: Benefit of Early Screening ...22
Discussion ...26
Interpretation of Evidence ...26
Limitations ...33
Future Directions ...34
References ...36
Appendices Appendix A. PubMed Search Strategy ...40
Appendix B. USPSTF Quality Rating Criteria ...40
Appendix C. Data Extraction Tables (by Study) ...41
List of Tables Table 1. Inclusion and Exclusion Criteria...11
Table 2. Study Characteristics...15
Table 3. Summary Table of Results for KQ1 ...20
Table 4. Summary Table of Results for KQ2 ...25
Table 5. Study Risk of Bias ...30
Abstract:
BACKGROUND: Gestational diabetes mellitus (GDM) is diabetes that is diagnosed for the first time during pregnancy. Rates of GDM in the U.S. and internationally have been rising in recent years. GDM is associated with an increased risk of adverse pregnancy outcomes, an increased risk of maternal Type 2 Diabetes Mellitus in the future, and an increased risk of future chronic disease for the neonate. Although recommendations differ, most guidelines recommend screening women with an oral glucose tolerance test during the second trimester of pregnancy and advise earlier screening in women considered high-risk for developing GDM.
AIMS: The objective of this systematic review will be to evaluate the accuracy of various methods of early screening for GDM as compared with traditional screening during the second trimester, and to determine whether earlier screening leads to improved maternal-fetal health outcomes.
METHODS: PubMed and the Cochrane Library were systematically searched according to pre-established eligibility criteria. Hand searches of relevant references and the grey literature were also done. One reviewer examined abstracts for eligibility and abstracted relevant data from included articles. Each included articles was assessed for quality.
CONCLUSIONS: Due to heterogeneity of methods and inconsistent outcomes with early
Introduction:
Defining Gestational Diabetes Mellitus: Physiologic changes to metabolism and the
endocrine system take place during pregnancy to support the growth and development of the fetus. Resistance to insulin [similar to that seen in Type 2 Diabetes Mellitus (T2DM)] is often seen during the second and third trimesters of pregnancy. If the woman’s pancreas is unable to compensate for this rising resistance by increasing the secretion of insulin, then blood glucose levels will begin to rise which may increase risk of adverse birth outcomes.3 Increased risk of adverse maternal-fetal outcomes has been shown to have a linear relationship to elevated levels of plasma glucose. Therefore, any elevation in blood glucose levels above what is considered normal may increase a woman's risk of negative birth outcomes, whether or not the levels were high enough to qualify as GDM.30 Gestational diabetes mellitus (GDM) is defined by the
American Congress of Obstetricians and Gynecologists (ACOG) as glucose intolerance, which is recognized for the first time during pregnancy. This often includes both women who have
previously undiagnosed T2DM as well as those who develop diabetes mellitus for the first time during pregnancy.34 Most women diagnosed prior to 24 weeks of gestation are thought to have had pre-gestational T2DM. Approximately 6-8% of pregnancies in the United States are complicated by GDM, with an even higher rate in obese patients (up to 14%).19 Internationally, rates of GDM are rising as well, closely paralleling the growing prevalence of mothers with advanced maternal age, obesity, and T2DM.33
Gestational Diabetes and Associated Risks: Pregnant women with GDM have been
injury, respiratory, cardiac and congenital disorders.34 Women with GDM are also more likely to experience a shoulder dystocia during delivery (odds ratio 4.07).20 Women who are diagnosed with GDM have a significantly increased risk of developing T2DM (odds ratio 3-7).8, 18 Children born to mothers with GDM may have increased rates of obesity and T2DM in the future.12
Screening for Gestational Diabetes Mellitus: There are significant variations in screening guidelines as well as thresholds used to define GDM across international organizations. While recommendations differ between professional societies, most recommend universal screening of asymptomatic women between 24-28 weeks gestation, and earlier screening (before 20 weeks gestation) in high-risk women. Early screening is used in addition to second trimester screening and is hoped to lead to earlier identification and treatment of diabetes in pregnancy leading to better health outcomes. Risk factors for GDM include: advanced maternal age, increasing parity, ethnicity (e.g. Hispanic and African American populations), obesity, high gestational weight gain, physical inactivity, low-fiber high-glycemic-load diets, history of previous macrosomia or GDM, family history of T2DM, and history of polycystic ovarian syndrome (PCOS).9, 26, 32 According to ACOG’s 2001 guidelines, women with low risk of GDM may forego testing. This requires women to be under 25 years of age, not a member of a high risk ethnic group, BMI ≤
25, have no history of abnormal glucose tolerance or macrosomia, and have no first-degree relatives with diabetes. However, only about 10% of pregnant women meet these criteria. Therefore, many physicians choose to screen all pregnant women.1
In the United States, the oral glucose tolerance test (OGTT) is considered to be the gold standard for diagnosis of gestational diabetes mellitus by ACOG and the United Stated
the fact that GDM is primarily a post-prandial condition.25 However, OGTT testing is expensive, unpleasant, and not well tolerated by some patients, especially those experiencing pregnancy related nausea.3 Other organizations, such as the International Association of Diabetes in
Pregnancy Study Group (IADPSG) and the American Diabetes Association (ADA) have recently begun to advocate for the use of Glycosylated Hemoglobin (HbA1c) levels for use in screening during pregnancy.28 The IADPSG, ADA, and World Health Organization (WHO) recommend screening for diabetes at the first antenatal visit using an HbA1c value of ≥ 6.5% as a diagnostic cut point,22, 35 however this recommendation is based on data collected in non-pregnant patients. Some studies have shown that a reference interval of 4.3-5.4% should be used as normal values for A1C in pregnant women, while values between 5.7-6.4% are associated with impaired glucose tolerance and an increased risk (12-25%) of developing T2DM over the first ten years postpartum.2, 21
The most current recommendations by ACOG suggest using a two-step diagnostic approach with a 50-g, 1-hour OGTT between 24-28 weeks for screening, and follow-up testing using a 100-g, 3-hour diagnostic OGTT for all positive screens. Women with GDM are
One study concluded that if cost of treatment for GDM is < $2630 and treatment is at least 74.9% effective at preventing complications associated with GDM, then the ICER was
$61,503.23 The ADA recommends screening for undiagnosed T2DM at first prenatal visit using a fasting value of 110-125mg/dL as a positive test, instead of > 92 mg/dL.37 Increasingly since the early twentieth century, there has been a push toward international standardization of definitions and guidelines based on outcomes from the Hyperglycaemia and Adverse Pregnancy Outcome (HAPO) study.12
The HAPO study was a landmark study done in 2002 which aimed to set international diagnostic criteria for threshold values based on the predictive value for adverse pregnancy outcomes. This trial was done in approximately 25,000 women over five years and looked at birth outcomes such as cesarean delivery, increased fetal size (macrosomia/LGA/obesity), neonatal morbidity (hypoglycemia), and fetal hyperinsulinism. The study concluded that
increased glycemic levels were related to increasing risk of adverse fetal outcomes. The IADPSG used the data from this study to create their recommendations for international screening
guidelines.
Justification for a Systematic Review: Some organizations and practitioners have begun
those women (and their children) who are screened at an earlier time period. This review will systematically search the recent literature to (1) understand the accuracy of early screening techniques and relevant threshold values among pregnant women, as contrasted to second trimester screening, in predicting or diagnosing pre-gestational or gestational diabetes mellitus, and (2) to explore the benefits and/or harms of first trimester screening versus second trimester screening and its relationship to birth outcomes (such as LGA, macrosomia, shoulder dystocia, and stillbirth).
Methods:
Two key questions (KQs) were posed for investigation by this review:
KQ1. Are the available tests accurate in early pregnancy and what cutoff values should be used?
KQ2. Does first trimester screening lead to better birth outcomes for mother and fetus than second trimester screening?
Search Strategy: No previous review protocol has been established for a review of these
included literature searches through 2002.29 That review concluded that evidence up to that point was limited and insufficient to justify early screening.
Inclusion/Exclusion Criteria: Inclusion and exclusion criteria of articles eligible for
inclusion were broadly defined (Table 1). Study types included for analysis were randomized trials, previously published systematic reviews, and observational studies assessing the accuracy of first trimester screening compared to second trimester screening, or assessing the health benefits (maternal or child birth outcomes) resulting from earlier screening were included. The population of interest was pregnant women with no previous diagnosis of T1DM or T2DM. This includes studies investigating early screening in both low and high-risk populations. Articles were excluded if the study population was women with concurrent medical conditions (e.g. thyroid disease, Addison’s disease, etc.) Studies were included from both developed and
developing countries in order to assess and expand the external validity of the conclusions of this review. Due to the wide variety of current guidelines and criteria, studies were not excluded based on their definition of GDM. Studies were only included if the full text could be found in English. Additionally, articles were excluded if they did not contain original research (i.e. study protocols or responses to published articles) or did not investigate the interventions, controls, and outcomes of interest. Due to the limited amount of available literature on the established
Table 1: Eligibility Criteria - full inclusion/exclusion criteria for studies in systematic review.
Inclusion Exclusion
Population Pregnant women without a prior DM
diagnosis (both low and high-risk populations), singleton pregnancies, and no concurrent medical conditions
Women with pre-gestational diabetes, multiple gestation pregnancies, concurrent medical conditions
Screening
Intervention Early glucose screening at or before 20 weeks gestation using any of the following methods: fasting plasma glucose, oral glucose tolerance testing, or HbA1C.
All other tests
Comparator Second trimester screening between
24-28 weeks gestation by gold standard (oral glucose tolerance test)
All other comparators
Outcomes KQ1: Diagnosis of GDM.
KQ 2: Birth outcomes: preterm birth, C-section, LGA, shoulder dystocia, preeclampsia, macrosomia, stillbirth
All other outcomes
Timing of Literature Review
January 2002 to June 2016 Articles published before 2002
Outcome
Timing Participants identified in first trimester followed through birth Participants did not present to provider or were not included in study in first trimester
Study Designs Randomized controlled trials, observational cohort studies
(retrospective and prospective), and systematic reviews
Non-systematic review, in-progress trials with no published results, case studies, case series
Language Article available in English Full article not available in English
Study Selection: Articles identified by the database searches were exported into RefWorks
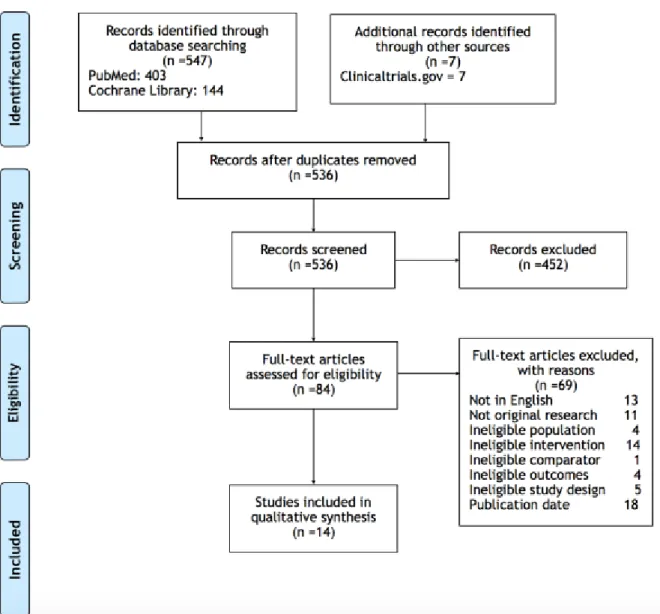
for removal of duplicates. Those identified through ClinicalTrials.gov were assessed without exportation. A Microsoft Excel spreadsheet was used to track articles and for manual de-duplication of any duplicates missed by the RefWorks program. All abstracts were reviewed by one reviewer for their compatibility with the established inclusion and exclusion criteria. Full article PDFs were obtained for those articles deemed eligible by their abstracts for inclusion in this review. These full articles were subsequently assessed by the author for eligibility again based on inclusion and exclusion criteria. Those found to be relevant to one or both of the two key questions were included for final review (citations and reasons for exclusion are included in Figure 1). Peer-reviewed publications and organizational and national guidelines were the
preferred sources of data. Non-published and in-progress trials which did not have available results were excluded.
Synthesis of Evidence: Studies included in the final systematic review were critically
appraised by one reviewer for risk of bias at the study level (i.e. selection bias, measurement bias, and confounding). Critical appraisal was done using the USPSTF Quality Rating Criteria (See Appendix 2 for USPSTF Quality Rating Criteria). A narrative summary of articles meeting inclusion criteria was synthesized for a qualitative investigation of the status of current literature and recommendations.
Due to a limited number of heterogeneous studies meeting inclusion criteria and
addressing one of the two KQs, no meta-analysis was performed. In addition to internal validity within included studies, external validity (i.e. applicability) of included studies was also
Figure 1. Article Flow Diagram.
Results:
Study Selection: Searches of PubMed, the Cochrane Library, and grey literature returned
536 search results, which were eligible for abstract screening. None of clinical trials.gov
abstract review, 85 references underwent full-text review. Fourteen articles were included in the final evidence synthesis (see Figure 1 for full flow diagram of article inclusion and exclusion). Study Characteristics: Of these 14 studies, none were randomized controlled trials; two
were systematic reviews and all others were cohort studies (both retrospective and prospective). The majority of studies were conducted in developed countries, however three were from developing countries (i.e. India, Pakistan, and China).31, 34, 37
Of the 14 included studies, nine addressed KQ1. Included strategies of first trimester screening were: fasting plasma glucose (6 studies), oral glucose tolerance tests (1 study), and glycosylated hemoglobin (2 studies). All studies enrolled women early in pregnancy prior to the time of traditional GDM screening (24-28 weeks gestation). Those women who tested within normal limits on the first screening test were then retested using OGTT between 24-28 weeks gestation as the gold standard. Of these nine studies, four were rated as good quality while the rest were judged to be of fair to poor quality.
Seven of the included studies examined birth outcomes in relation to early GDM screening and were therefore relevant to answering KQ2. The pregnancy outcomes most commonly reported across trials were preterm birth, preeclampsia, cesarean delivery, large for gestational age infant/macrosomia, shoulder dystocia, neonatal complications, and stillbirth. While some studies investigated only one of these outcomes (i.e. stillbirth)34 each of these
outcomes was addressed by multiple trials. The results and qualities of these studies varied widely. Three studies were rated as good quality, the rest were rated as fair to poor; common sources of bias across all studies included high risk of selection bias and no control for
Table 2. Study characteristics of each study. Study,
Year
Study Design
Country Sample
Size
High risk vs random POI**
Study Period Key
Question
Alunni, 20154
Retrospect ive cohort study
USA 1298 NR* July 2010 -
June 2012
KQ2
Bito, 20056 Prospectiv e
observatio nal study
Hungary 155 High Risk Jan 1, 2001 -
Sept 30, 2002 KQ1
Corrado,
20127 Retrospective cohort study
Italy 738 Random May 2010 - May 2011
KQ1
Fong, 201410
Retrospect ive cohort study
USA 526 NR* Jan 2011 -
Jan 2013
KQ1; KQ2
Gandhi,
201111 Retrospective cohort study
UK 190 High Risk Jan 2009 -
Feb 2011 KQ1
Harrison,
201513 Prospective cohort study - as part of larger RCT
Australia 224 High Risk 2008-2010 KQ1
Hawkins, 200814
Retrospect ive cohort study
USA 2257 High Risk Dec 1999 - Jun 2005
Hivert,
201215 Retrospective cohort study
Canada 7839 High Risk 2004-2005; 2006-2007; 2008-2009 KQ2 Hughes, 201416 Prospectiv e cohort study New Zealand
974 Random 2008-2010 KQ1; KQ2
Most,
200924 Retrospective cohort study
USA 340 Random 2003-2007 KQ2
Scott,
200229 Systematic review UK studies 135 High Risk All literature through 2000 KQ1; KQ2 Seshiah,
200731 Prospective cohort study
India 739 Random NR KQ1
Syed,
201134 Systematic review Study done in Pakistan; searched literature from all countries 70 articles include d (14 interven tion, 56 observa
tional)
NR* Literature up to 2010
KQ2
Zhu, 201337 Retrospect ive cohort study
China 14039 Random Jan 1, 2010 - Feb 29, 2012
KQ1
*NR: Not reported
KQ1: Accuracy and Predictive Ability of First Trimester Screening
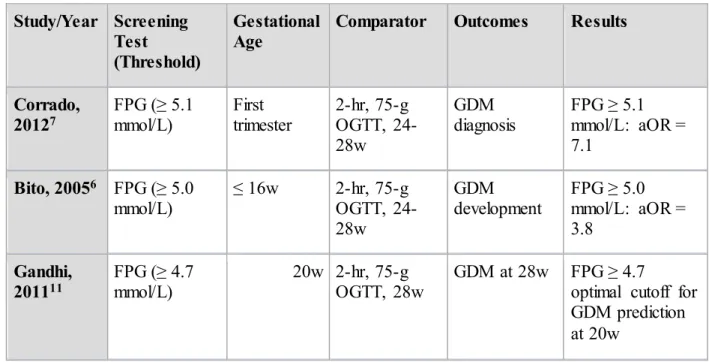
Three methods of early GDM screening were used across the included literature. First trimester fasting plasma glucose (FPG) was used most commonly (6 studies) with proposed threshold values ranging from 4.7 mmol/L to 5.6 mmol/L. One study supported the IADPSG threshold of ≥ 5.1 mmol/L, three studies that found evidence for lower threshold values, and only one study advocated for higher threshold values. One study investigated the accuracy of OGTT at the first antenatal visit. Lastly, two included studies evaluated the predictive ability of early hemoglobin A1c (HbA1c) screening (See Table 3 for a summary of studies addressing KQ1).10, 16
First Trimester Fasting Plasma Glucose: Six of the included studies investigated the
correlation between early FPG and later development of GDM. Women with overt diabetes (FPG values ≥7.0 mmol/L) at the first antenatal visit were excluded. Additionally, all studies used a 2-hour, 75-g OGTT as the gold standard of diagnosis of GDM between 24 and 28 weeks gestation. However, not all studies defined GDM using the same threshold values (WHO, IADPSG, Australasian Diabetes in Pregnancy Society [ADIPS], etc.).
FPG = 5.1 mmol/L: Two articles supported a threshold value similar to that proposed by
the IADPSG (5.1 mmol/L). Using an FPG cutoff value of ≥ 5.1 mmol/L, Corrado et al. found an adjusted OR (aOR) of 7.1 (95% CI:3.8-13.1) when compared to FPG values < 5.1 mmol/L, and an area under the receiver operating characteristic (ROC) curve of 0.614 (95% CI: 0.544-0.684).7
FPG < 5.1 mmol/L: Three studies examined threshold values < 5.1 mmol/L. Similar to
value (NPV) of 0.92 of being diagnosed with GDM at 24-28 weeks gestation. One study enrolling obese women (BMI ≥ 40) concluded that an FPG of ≥ 4.7 mmol/L was an optimal cutoff point in this population.11 However, this study found that this value had a low sensitivity 78.5% (95% CI:48.8%-94.2%) and specificity 43.7% (95% CI: 35.5%-52.2%). The positive liklihood ratio (LR) was only 1.39 (95% CI: 1.02-1.90) and the area under the ROC curve was unremarkable at 0.56 (95% CI: 0.39-0.72). A study by Harrison et al., enrolled high risk women as identified by a risk prediction tool, which included previous GDM, family history, high risk ethnicity, age, and BMI.13 This investigation looked at the ability of early FPG to predict GDM development as defined by both IADPSG and ADIPS criteria. Elevated FPG was defined in this study as ≥ 4.91 mmol/L (> 6.7 mmol/L was judged to be diagnostic of pre-gestational diabetes). This threshold value had an aOR of 6.32 (95% CI: 2.49-16.06) for predicting GDM diagnosed using ADIPS criteria, with a sensitivity of 34.0% and a specificity of 94.8%. In predicting GDM diagnosed by IADPSG criteria, this value had an aOR of 10.03 (95%CI: 3.40-29.56) with a sensitivity of 50.0% and a specificity of 92.4%. The area under the ROC curve was 0.79 (95% CI: 0.72-0.86) for ADIPS criteria and 0.83 (95% CI: 0.77-0.90) for IADPSG criteria.
FPG > 5.1 mmol/L: Only one study investigated a higher cutoff value than that proposed
by IADPSG.37 Median first trimester FPG was found to be 4.58 0.44 mmol/L across all
women. Incidence of GDM diagnosis was strongly correlated with increase in FPG (chi-square = 959.3, p < 0.001). The incidence of GDM development was 52.7% in women with a first
trimester FPG between 5.6-6.09 mmol/L. The area under the ROC curve was calculated to be 0.654 (95% CI: 0.643-0.665; SE 0.006; p < 0.001).
increase linearly with increasing FPG values.29 Therefore, lower values equal lower risk, and in order for the benefits of screening to outweigh the costs and harms, higher threshold values must be used. Additionally, this study concluded that FPG values < 4.8 mmol/L may be used to exclude the subsequent development of GDM. This review also conceded that, although FPG may be an attractive screening method, data have shown that fetal weight gain may be more closely linked with postprandial glucose values.17 Because FPG does not test postprandial values, and because some women who have normal FPG levels may have elevated postprandial levels, Scott et al. conclude that FPG may not be the most relevant screening test for GDM and associated birth outcomes.
Oral Glucose Tolerance Testing: Only one study investigated the relationship between
early oral glucose tolerance testing and the subsequent development of gestational diabetes.31 This study used 2-hr, 75-g OGTT at the first antenatal visit irrespective of gestational week (mean gestational age of these women at first antenatal visit was 23.55 weeks). A threshold value of ≥ 140 mg/dL was used as diagnostic of GDM according to the WHO criteria. A cohort of women who screened negative at their first prenatal visit, but who were subsequently diagnosed with GDM later in pregnancy (mean gestational age 30 weeks) were retrospectively divided into OGTT values < or ≥ 120 mg/dL at first antenatal screen. Of these women, 56% (who went on to develop GDM) had first visit OGTT levels < 120 mg/dL and 44% had values ≥ 120 mg/dL. The authors concluded that regardless of 2-hr OGTT results at the first antenatal visit, all women who test negative for GDM at this time should be rescreened at subsequent visits.
Glycosylated Hemoglobin: The remaining two studies addressing KQ1 investigated
value of ≥ 6.5% to diagnosis overt diabetes in pregnancy. These women were excluded in both studies.
The first of these studies included women who received a HbA1c test at ≤ 20 gestational weeks.10 Those women who had a first trimester HbA1c value between 5.7-6.4% had an aOR of 2.38 (95% CI: 1.01-5.63) for developing GDM when compared with their counterparts who had HbA1c values < 5.7%. The second study, found that the optimal HbA1c threshold value to diagnose GDM was ≥ 5.9%.16 In this study women were asked to have a 2-hr, 75-g OGTT at < 20 weeks gestation, and the HbA1c value of ≥ 5.9% was correlated with those women who had a positive OGTT test. This HbA1c value was 98.4% specific (95% CI: 97.0-99.9) but only 18.8% (95% CI 6.6–31.1) sensitive for detection of early GDM. The area under the ROC curve for HbA1c and GDM correlation was 0.711.
Table 3. Summary Table of Results for KQ1
Study/Year Screening
Test
(Threshold)
Gestational Age
Comparator Outcomes Results
Corrado,
20127 FPG mmol/L) (≥ 5.1 First trimester 2-hr, 75-g OGTT, 24-28w
GDM
diagnosis FPG mmol/L: aOR = ≥ 5.1 7.1
Bito, 20056 FPG (≥ 5.0
mmol/L) ≤ 16w 2-hr, 75-g OGTT, 24-28w
GDM
development FPG mmol/L: aOR = ≥ 5.0 3.8
Gandhi,
Harrison,
201513 FPG (4.91-6.70 mmol/L) ≤ 15w 2-hr, 75-g OGTT, 26-28w GDM development by ADIPS and IADPSG criteria
aOR = 6.32 predicting ADIPS GDM; aOR = 10.03 predicting IADPSG GDM
Zhu,
201337 FPG mmol/L) (≥ 5.6 First prenatal visit (median 13.4w)
2-hr, 75-g OGTT, 24-28w
GDM
development FPG mmol/L: 99% ≥ 5.6 specificity
Scott,
200229 FPG (< 4.8 mmol/L) < 24w OGTT, 24-28w GDM development FPG < 4.8 mmol/L: excludes GDM
Seshiah,
200731 OGTT mg/dL) (≥ 120 First prenatal visit (median 23.6w)
2-hr, 75-g OGTT at subsequent visits (median 30w)
GDM
development Of women who developed GDM, 56% had early OGTT ≥ 120 mg/dL, 44% had early OGTT < 120 mg/dL
Fong,
201410 HbA1c 5.7%) (≥ ≤ 20w One or two step OGTT at 24-28w
GDM
development HbA1c aOR = 2.38 ≥ 5.7%:
Hughes,
201416 HbA1c 5.9%) (≥ < 20w One or two step OGTT at 24-28w
GDM development
HbA1c ≥ 5.9%: 100% sens, 97.4% spec; HbA1c < 4.8%: excludes GDM
FPG: Fasting plasma glucose
KQ2: Early screening and pregnancy outcomes
The second interest of this review is to determine if early screening for gestational diabetes mellitus leads to better birth outcomes for the mother and the neonate. Only two studies showed any benefit for early screening. And this was seen only in selected outcomes. The majority of maternal and fetal outcomes were not different in women who were screened early than in those who were screened later. Two studies actually reported worse maternal and fetal outcomes in women who were identified through early screening than those identified in the second trimester (see Table 4 for a summary of articles addressing KQ2).
Macrosomia and Large for Gestational Age: Of the seven studies addressing KQ2, four
found similar birthweights and rates of LGA and macrosomic infants born to mothers screened
for GDM early versus those screened in the second trimester. Hivert et al. found similar
birthweights (kg) (early = 3.360 [3.080-3.690], traditional = 3.380 [3.040-3.650]) and rates of
macrosomia between those who received early screening and traditional screening.15 Hawkins et
al. found similar rates of LGA and macrocosmic infants in both early and traditional cohorts after
adjusting for maternal age, race, parity, weight, and glycemic control.14 Another study found no
differences in neonatal outcomes between women screened before 20 weeks gestation and
women screened at or after 20 weeks gestation.10 A similar study from 2015 found similar
birthweights and rates of macrosomia in infants born to mothers screened before or after 24
weeks gestation.4
A study from 2009 found that rates of LGA (18% vs. 6% [P=0.02]) and macrosomia (14% vs. 6% [P=0.001]) were twice as high (1.8% vs 4.4%) among infants born to mothers
identified through first trimester screening.24 Although the data seem to suggest that early
review by Scott et al. concluded that the utility of early screening should not be decided based on
rates of macrosomia.29 These authors argue that macrosomia is an intermediate outcomes and not
a relevant clinical outcome. The utility of early screening must be evaluated by looking at
reduction of harmful health outcomes.
Cesarean Delivery: Four studies investigated rates of cesarean delivery associated with
timing of screening. Two of these studies4,10 found that rates of C-section did not change
between mothers screened earlier, and those screened in the second trimester. Most et al. found
rates of cesarean delivery to be 45% in the early diagnosis group and 24% in the late diagnosis
group (P=0.002),24 and Hawkins et al. found a non-statistically significant increase in the odds
ratio of repeat cesarean delivery among this group.14 Taken together the data suggest that earlier
screening may not reduce rates of cesarean delivery and may actually increase rates when
compared to traditional diagnostic measures.
Gestational Age and Preterm Birth: The data found a similar story regarding rates of
preterm birth and gestational age at delivery. Alunni et al. and Hivert et al. found an average
gestational age at delivery of 39 weeks in both early screening and late screening cohorts.4, 15
Two studies found increased risk of preterm birth in the early screening population. Most et al.
did not find a statistically significant difference between groups, however 6.1% of the early
cohort in comparison with 5.4% of the late cohort were born preterm (P=0.79).24 Hawkins et al.
attributed this to higher rates of preeclampsia (aOR=2.4 [95% CI:1.5-3.8]) leading to early
delivery.14
Preeclampsia: Only three studies investigated preeclampsia as a maternal outcome as it
relates to GDM screening. Two found maternal outcomes such as preeclampsia were worse for
hypertension among mothers identified earlier (19.4%) compared to mother identified later
(12.4%; P=0.10). The last study found no difference in rates of maternal preeclampsia between
early and traditional cohorts.4
Shoulder Dystocia: Only two studies addressed shoulder dystocia as an outcome of
interest and these studies found opposing results. One study by Hawkins et al. concluded that women with diet-treated GDM who were identified before 24 weeks had lower rates of cesarean deliveries for dystocia (3%) than women with diet-controlled diabetes mellitus identified at or later than 24 weeks gestation (6%; p = 0.02).14 In direct contrast to that data, the study by Most et
al. found increased rates of shoulder dystocia in the early screening cohort leading to a mixed
picture surrounding shoulder dystocia.24
NICU Admission and Stillbirth: Of three studies which looked at rates of NICU
admissions and/or stillbirth, one found that early screening in the setting of a specialized diabetes clinic led to decreased rates of neonatal intensive care unit (NICU) admissions (15.4%)
compared to second trimester screening (20.8%; P=0.002).15Two papers found similar rates of
neonatal complications between the two cohorts (including NICU admission and intrauterine
fetal demise [IUFD or stillbirth]). A systematic review done of the literature published prior to
2010 concluded that it was not possible to show that early testing was superior to later testing in
improving rates of stillbirth.34 This review found only one study and one review article
investigating the relationship between early GDM screening and IUFD. This review also
concluded that threshold values or guidelines used to screen for and diagnose GDM (ADA vs.
WHO) had no bearing on stillbirth rates. This conclusion was based on data from two
Outcomes and First Trimester HbA1c: One study was identified that compared first
trimester hemoglobin A1c value (HbA1c) with perinatal outcomes.16 This study proposed an
early HbA1c threshold value of 5.9%. In women with elevated first trimester HbA1c, risk of
preterm birth was elevated with an aOR of 1.66 (95% CI: 1.01-2.74), as well as risk of shoulder
dystocia (aOR=2.48 [95% CI:1.21-5.10]) and preeclampsia (aOR=3.04 [95% CI: 1.97-4.70]).
Risk of perinatal death was also found to be higher in this population though the odds ratio was
not significant after adjusting for confounders (aOR=2.24 [95% CI: 0.75-6.69]).
Table 4. Summary Table of Results for KQ2
Study/Year Screening
Test
(Threshold)
Gestational Age
Comparator Outcomes Results*
Hawkins, 200814
RPG (≥ 130 mg/dL)
< 24w Two step OGTT at 24-28 weeks Preeclampsia, repeat cesarean, SHD, LGA, macrosomia Decreased cesarean for dystocia in early group; no
difference in LGA or macrosomia; increased
preeclampsia and cesarean
Hivert,
201215 1-hr GCT 10.3 mmol/L) (≥ First trimester (0-13w)
GCT in the second trimester
Duration of gestation, cesarean, neonatal comp, NICU, bwt, macro
Decreased NICU in early group; no difference in duration of gestation,
cesarean, neonatal comp bwt, macro; increased
Fong,
201410 HbA1c 5.7%) (≥ ≤ 20w One or two step OGTT at 24-28w
Cesarean, NICU, bwt, macro, IUFD
Alunni,
20154 HbA1c 5.7%) or FPG (≥
(≥ 92 mg/dL)
≤ 24w 2-hr, 75-g OGTT at 24-28 weeks
Maternal and neonatal outcomes, delivery mode, gestational age at delivery
All outcomes equal in both groups
Syed,
201134 Not specified First trimester Regular screening (24-28w)
Stillbirth No difference in stillbirth
Most,
200924 50-g GCT 140 mg/dL) (≥ and 100-g OGTT
First
trimester OGTT at 24-28 weeks Macro, LGA, cesarean, preterm, SHD, preeclampsia
Increased rates of all outcomes in early group
Hughes,
201416 HbA1c 5.9%) (≥ < 20w One or two step OGTT at 24-28w
Preeclampsia, SHD, stillbirth, preterm
HbA1c ≥ 5.9%: increased rates of all outcomes
*Results: Results report increase, decrease, or no change in magnitude of effect (not necessarily statistically significant)
GCT: Glucose Challenge Test Bwt: birthweight
Macro: Macrosomia
Neonatal comp: neonatal complications NICU: neonatal ICU admission
Preterm: Preterm birth SHD: Shoulder dystocia
Discussion:
Interpretation of the Evidence: The risk of bias of each individual study was assessed,
testing or glycosylated hemoglobin, but both of these methods are also of interest for use during early pregnancy.
Current international guidelines recommend using a fasting plasma glucose value of ≥ 5.1 mmol/L as a threshold value for diagnosing GDM. Studies have shown that FPG values change throughout pregnancy, and this review found evidence supporting threshold values from 4.7 mmol/L to 6.1 mmol/L as optimal cutoff values for early GDM screening. One systematic review proposed that a value of < 4.8 mmol/L could be used to rule out the future development of gestational diabetes mellitus at early screening.
Oral glucose tolerance testing has also been investigated and suggested cutoff values range from ≥ 140 mg/dL to ≥ 153 mg/dL for early diagnosis of GDM. Additionally, values < 140 mg/dL have not been found to be sensitive for ruling out GDM development later in pregnancy, and women who screen negative at their first antenatal visit should be screened again during the second trimester regardless of the results of their first OGTT. Fewer guidelines exist regarding the use of HbA1c as a diagnostic test in pregnancy. This is partially attributable to the fact that most data on optimal HbA1c thresholds come from studies done in non-pregnant populations. The studies investigating HbA1c values suggest using a cutoff between 5.7-5.9% as predictive of GDM development in pregnancy.
there is a linear relationship between blood glucose in pregnancy and the associated negative outcomes. This suggests that any amount of elevation in blood glucose levels during pregnancy increases a woman’s risk of developing harmful outcomes and should therefore be considered abnormal. However, it also suggests that any level chosen as a threshold will necessarily be somewhat arbitrary.
In accordance with KQ2, additionally, none of these methods of early screening for, or detection of, GDM have been consistently linked to better pregnancy outcomes. The large majority of studies included found no differences in pregnancy or birth outcomes for those women who received early screening when compared to those women who received standard, second trimester screening. Infrequently, single outcomes in various studies were found to improve among the group who received earlier screening, but these findings were not reproducable in other studies.
screening and diagnosis leads to worse outcomes. In the future studies should screen different cohorts of women in the first and second trimesters to avoid this confounding effect.
A potential source of confounding across studies was that not all studies defined ‘early screening’ the same. All included studies performed screening prior to the traditional 24 weeks gestation, but in some cases it was limited to screening before 15 or 16 weeks, and the median values for gestational age of women who received early screening varied widely between the studies. This could cause results to vary based on when early screening was performed and GDM was identified. The tests used to perform early screening in the studies on KQ2 varied widely between studies. This might cause variability in results between studies. However, despite this potential source of confounding, these studies overwhelmingly found similar results (i.e. no difference between early and late screening). This increases our confidence in the conclusions of this review. Furthermore, many different sets of criteria were used across the body of literature. While this should not have affected numerical values and cutoff points, it may have affected outcomes associated with ‘early identification’ if that definition changed across studies.
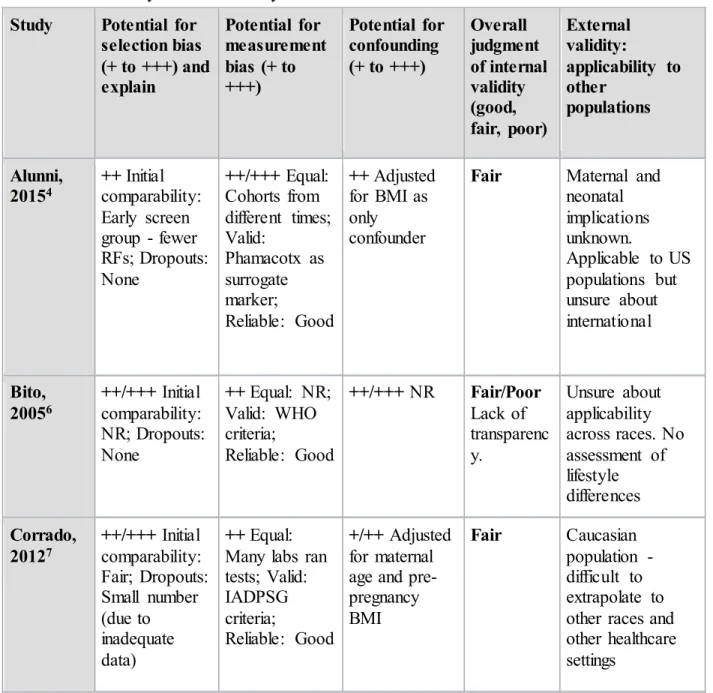
Table 5. Risk of Bias by Individual Study
Study Potential for
selection bias (+ to +++) and explain
Potential for measurement bias (+ to +++)
Potential for confounding (+ to +++)
Overall judgment of internal validity (good, fair, poor)
External validity:
applicability to other
populations
Alunni,
20154 ++ Initial comparability: Early screen group - fewer RFs; Dropouts: None
++/+++ Equal: Cohorts from different times; Valid:
Phamacotx as surrogate marker;
Reliable: Good
++ Adjusted for BMI as only confounder
Fair Maternal and
neonatal implications unknown.
Applicable to US populations but unsure about international Bito, 20056 ++/+++ Initial comparability: NR; Dropouts: None
++ Equal: NR; Valid: WHO criteria;
Reliable: Good
++/+++ NR Fair/Poor
Lack of transparenc y.
Unsure about applicability across races. No assessment of lifestyle differences Corrado, 20127 ++/+++ Initial comparability: Fair; Dropouts: Small number (due to inadequate data)
++ Equal: Many labs ran tests; Valid: IADPSG criteria;
Reliable: Good
+/++ Adjusted for maternal age and pre-pregnancy BMI
Fair Caucasian
Fong,
201410 ++ Initial comparability: Interest group with more risk factors;
Dropouts: None
++ Equal: Two screening methods; Valid: Early A1c not validated; Reliable: Good
+ Adjusted for age,
race/ethnicity, pre-pregnancy BMI,
gestational age at HbA1C sample collection, gestational age at GDM screening/diag nosis, and method of GDM screening (2-step vs. 1-(2-step)
Good Primarily
Hispanic
population with a high prevalence of obesity - may not apply to different demographics
Gandhi,
201111 ++/+++ Initial comparability: Good;
Dropouts: large number excluded due to failure to have tests at 20 and 28 weeks.
+ Equal: Good; Valid: Good; Reliable: Good
+++ Not adjusted for significant confounders
Fair Obese, Caucasian
population. Limited
information on GDM risk factors.
Harrison,
201513 ++ Initial comparability: Good;
Dropouts: Some lost to follow-up
+ Equal: Good; Valid: Good; Reliable: Good
+ Adjusted for age, baseline BMI, ethnicity, previous GDM and family history of T2DM
Good/Fair High risk population may not be
Hawkins,
200814 ++/+++ Initial comparability: Early
screening only in high-risk; Dropouts: More early screen likely to be ineligible
++ Equal: Good; Valid: National Diabetes Data Group criteria; Reliable: Good
+/++ Adjusted for
demographics and
lifestyle/glyce mic control
Fair Largely Hispanic
population. Screening guidelines different in different countries
Hivert, 201215
+/++ Initial comparability: Groups from different settings; Dropouts: None
++ Equal: Cohorts from different times/settings; Valid: Good; Reliable: Good
+++ Unable to adjust for pre-pregnancy BMI and family history
Fair Specialty clinic
may be increase interaction with health care providers or more intense
monitoring
Hughes,
201416 ++/+++ Initial comparability: higher risk factors in higher BMI group; Dropouts: High
+ Equal: Good; Valid: Good; Reliable: Good
+++ Outcome frequencies too low to adjust for potential confounders
Fair Primarily low-risk
Caucasian population
Most,
200924 ++ Initial comparability: Fair; Dropouts: NR
+/++ Equal: Good; Valid: Dependent on criteria;
Reliable: Good
+/++ Adjusted for maternal age. ethnicity, BMI, parity, previous cesarean delivery
Good/Fair Inner city, largely Hispanic and Asian populations
Scott,
200229 + Multiple reviewers ++ Equal: Non-transparent measurement; Valid: Good; Reliable: Good
++ NR Good/Fair International
Seshiah,
200731 ++ Initial comparability: Few
demographic collected; Dropouts: NR
++/+++ Equal: Cohorts from different times Valid: WHO criteria
Reliable: Good
+++ Not adjusted for age/BMI
Poor Done in India,
few demographics reported. Difficult to extrapolate. Syed, 201134 + Multiple reviewers
+ Equal: Re-ran all calculations; Valid: Meta- Analysis; Reliable: Good
++ NR Good Developing and
developed countries. Good
Zhu, 201337
++ Initial comparability: Fair; Dropouts: None
++ Equal: Good; Valid: Chinese MOH criteria
Reliable: Good
++ Adjusted for age and different testing
locations. Did not adjust for BMI
Good/Fair Chinese
population and guidelines used.
NR: Not reported
Limitations: There were several limitations associated with the available body of
evidence. The most significant limitation identified was a lack of randomized controlled trials. This is possibly due to a prevailing hesitancy to randomize pregnant women to interventions that may be harmful or have not been shown to improve outcomes for women and their babies. Additionally, many of the established guidelines and criteria are based off of data collected in non-pregnant populations and may not be applicable or appropriate criteria to apply to screening pregnant women.
The limitations of this review are twofold. The review was performed by a single
constraints on time and personnel. It is likely that articles exist in other journals and languages that investigated out questions of interest but were not included.
Future Directions: Due to the lack of evidence supporting better outcomes in those
women who receive earlier screening and interventions, randomized controlled trials to investigate the accuracy and utility of first trimester GDM screening would be ethically justifiable. RCTs are needed both that establish accuracy of the available tests and the best thresholds, as well as studies that investigate maternal and neonatal outcomes of early screening versus standard screening.
Secondly, the gold standard oral glucose tolerance test is an unpleasant tool that is not well tolerated by many pregnant women. Therefore, in addition to searching for highly specific first trimester tests which predict or diagnose GDM, there would be high clinical utility in the discovery of a highly sensitive test or threshold value that could rule out GDM development. This test would allow women with very low risk to forgo the second trimester OGTT and its associated burdens, as well as decreasing rates of false positives.
Funding:
This work was unfunded. It was done as part of a Masters in Public Health thesis project, conducted at the Gillings School of Global Public Health, Chapel Hill, NC.
Conflict of Interest:
Acknowledgements:
References:
1. American Congress of Obstetrics and Gynecology. (2013). Practice Bulletin 137 Gestational Diabetes Mellitus.
http://www.acog.org/resources-and-publications/practice-bulletins/committee-on-practice-bulletins-obstetrics/gestationa-diabetes-mellitus, cite last accessed on 1 April, 2016.
2. American Diabetes Association. (2013). Diagnosis and classification of diabetes mellitus. Diabetes care, 36(Supplement 1), S67-S74.
3. Allnutt, K. J., Allan, C. A., & Brown, J. (2015). Early pregnancy screening for identification of undiagnosed pre‐existing diabetes to improve maternal and infant health. The Cochrane Library.
4. Alunni, M. L., Roeder, H. A., Moore, T. R., & Ramos, G. A. (2015). First trimester gestational diabetes screening - change in incidence and pharmacotherapy need. Diabetes Research and Clinical Practice, 109(1), 135-140. doi:10.1016/j.diabres.2015.04.027 [doi]
5. Berggren, E. K., Boggess, K. A., Mathew, L., & Culhane, J. (2015, March). First Trimester HbA1c To Identify Women Who Will Fail Third Trimester GDM Screening.
In REPRODUCTIVE SCIENCES (Vol. 22, pp. 246A-246A). 2455 TELLER RD, THOUSAND OAKS, CA 91320 USA: SAGE PUBLICATIONS INC.
6. Bito, T., Nyari, T., Kovacs, L., & Pal, A. (2005). Oral glucose tolerance testing at gestational weeks < or =16 could predict or exclude subsequent gestational diabetes mellitus during the current pregnancy in high risk group. European Journal of Obstetrics, Gynecology, and Reproductive Biology, 121(1), 51-55. doi:S0301-2115(04)00574-3 [pii]
7. Corrado, F., D'Anna, R., Cannata, M. L., Interdonato, M. L., Pintaudi, B., & Di Benedetto, A. (2012). Correspondence between first-trimester fasting glycaemia, and oral glucose tolerance test in gestational diabetes diagnosis. Diabetes & Metabolism, 38(5), 458-461. doi:10.1016/j.diabet.2012.03.006 [doi]
8. Damm, P., Kühl, C., Bertelsen, A., & Mølsted-Pedersen, L. (1992). Predictive factors for the development of diabetes in women with previous gestational diabetes mellitus. American journal of obstetrics and gynecology, 167(3), 607-616.
9. Donovan, L., Hartling, L., Muise, M., Guthrie, A., Vandermeer, B., & Dryden, D. M. (2013). Screening tests for gestational diabetes: a systematic review for the US Preventive Services Task Force. Annals of internal medicine,159(2), 115-122.
10. Fong, A., Serra, A. E., Gabby, L., Wing, D. A., & Berkowitz, K. M. (2014). Use of
hemoglobin A1c as an early predictor of gestational diabetes mellitus. American Journal of Obstetrics and Gynecology, 211(6), 641.e1-641.e7. doi:10.1016/j.ajog.2014.06.016 [doi]
12. HAPO Study Cooperative Research Group. (2002). The hyperglycemia and adverse pregnancy outcome (HAPO) study. International Journal of Gynecology & Obstetrics, 78(1), 69-77.
13. Harrison, C. L., Lombard, C. B., East, C., Boyle, J., & Teede, H. J. (2015). Risk stratification in early pregnancy for women at increased risk of gestational diabetes. Diabetes Research and Clinical Practice, 107(1), 61-68. doi:10.1016/j.diabres.2014.09.006 [doi]
14. Hawkins, J. S., Lo, J. Y., Casey, B. M., McIntire, D. D., & Leveno, K. J. (2008). Diet-treated gestational diabetes mellitus: Comparison of early vs routine diagnosis. American Journal of Obstetrics and Gynecology, 198(3), 287.e1-287.e6. doi:10.1016/j.ajog.2007.11.049 [doi]
15. Hivert, M. F., Allard, C., Menard, J., Ouellet, A., & Ardilouze, J. L. (2012). Impact of the creation of a specialized clinic for prenatal blood sampling and follow-up care in pregnant women. Journal of Obstetrics and Gynaecology Canada : JOGC = Journal d'Obstetrique Et Gynecologie Du Canada : JOGC, 34(3), 236-242.
16. Hughes, R. C., Moore, M. P., Gullam, J. E., Mohamed, K., & Rowan, J. (2014). An early pregnancy HbA1c >/=5.9% (41 mmol/mol) is optimal for detecting diabetes and identifies women at increased risk of adverse pregnancy outcomes. Diabetes Care, 37(11), 2953-2959. doi:10.2337/dc14-1312 [doi]
17. Jovanovic-Peterson, L., & Peterson, C. M. (1991). Is exercise safe or useful for gestational diabetic women? Diabetes, 40 Suppl 2, 179-181.
18. Kim, C., Newton, K. M., & Knopp, R. H. (2002). Gestational Diabetes and the Incidence of Type 2 Diabetes A systematic review. Diabetes care, 25(10), 1862-1868.
19. Kim, S. Y., Saraiva, C., Curtis, M., Wilson, H. G., Troyan, J., & Sharma, A. J. (2013). Fraction of gestational diabetes mellitus attributable to overweight and obesity by race/ethnicity, California, 2007–2009. American journal of public health, 103(10), e65-e72.
20. Langer, O., Yogev, Y., Most, O., & Xenakis, E. M. J. (2005). Gestational diabetes: The consequences of not treating. American Journal of Obstetrics and Gynecology, 192(4), 989-997. doi:http://dx.doi.org.libproxy.lib.unc.edu/10.1016/j.ajog.2004.11.039
21. Lorenzo, C., Wagenknecht, L. E., Hanley, A. J., Rewers, M. J., Karter, A. J., & Haffner, S. M. (2010). A1C Between 5.7 and 6.4% as a marker for identifying pre-diabetes, insulin sensitivity and secretion, and cardiovascular risk factors the insulin resistance
atherosclerosis study (IRAS). Diabetes care, 33(9), 2104-2109.
22. Metzger, B. E., Gabbe, S. G., Persson, B., Buchanan, T. A., Catalano, P. A., Damm, P., ... & Lowe, L. P. (2010). International Association of Diabetes and Pregnancy Study Groups Consensus Panel. International association of diabetes and pregnancy study groups recommendations on the diagnosis and classification of hyperglycemia in
23. Mission, J. F., Ohno, M. S., Cheng, Y. W., & Caughey, A. B. (2012). Gestational diabetes screening with the new IADPSG guidelines: a cost-effectiveness analysis. American journal of obstetrics and gynecology,207(4), 326-e1.
24. Most, O. L., Kim, J. H., Arslan, A. A., & Klauser, C. (2009). Maternal and neonatal outcomes in early glucose tolerance testing in an obstetric population in new york city. Journal of Perinatal Medicine, 37(2), 114-117. doi:10.1515/JPM.2009.034 [doi] 25. Moyer, V. A. (2014). Screening for gestational diabetes mellitus: US Preventive Services
Task Force recommendation statement. Annals of internal medicine, 160(6), 414-420. 26. Nankervis, A., McIntyre, H. D., Moses, R., Ross, G. P., Callaway, L., Porter, C., & Jeffries,
W. (2012). ADIPS consensus guidelines for the testing and diagnosis of gestational diabetes mellitus in Australia. Australasian diabetes in pregnancy society.
27. Östlund, I., Haglund, B., & Hanson, U. (2004). Gestational diabetes and preeclampsia.
European Journal of Obstetrics & Gynecology and Reproductive Biology, 113(1), 12-16. doi:http://dx.doi.org.libproxy.lib.unc.edu/10.1016/j.ejogrb.2003.07.001
28. Panel, I. C. (2010). International association of diabetes and pregnancy study groups recommendations on the diagnosis and classification of hyperglycemia in
pregnancy. Diabetes care, 33(3), 676-682.
29. Scott, D. A., Loveman, E., McIntyre, L., & Waugh, N. (2002). Screening for gestational diabetes: A systematic review and economic evaluation. Health Technology Assessment (Winchester, England), 6(11), 1-161.
30. Sermer, M., Naylor, C. D., Gare, D. J., Kenshole, A. B., Ritchie, J. W. K., Farine, D., et al. (1995). Impact of increasing carbohydrate intolerance on maternal-fetal outcomes in 3637 women without gestational diabetes. American Journal of Obstetrics and
Gynecology, 173(1), 146-156. doi:http://dx.doi.org.libproxy.lib.unc.edu/10.1016/0002-9378(95)90183-3
31. Seshiah, V., Balaji, V., Balaji, M. S., Panneerselvam, A., Thamizharasi, M., & Arthi, T. (2007). Glycemic level at the first visit and prediction of GDM. The Journal of the Association of Physicians of India, 55, 630-632.
32. Solomon, C. G., Willett, W. C., Carey, V. J., Rich-Edwards, J., Hunter, D. J., Colditz, G. A., ... & Manson, J. E. (1997). A prospective study of pregravid determinants of gestational diabetes mellitus. Jama, 278(13), 1078-1083.
33. Sweeting, A., Park, F., & Hyett, J. (2015). The first trimester: Prediction and prevention of the great obstetrical syndromes. Best Practice & Research Clinical Obstetrics & Gynaecology, 29(2), 183-193.
34. Syed, M., Javed, H., Yakoob, M. Y., & Bhutta, Z. A. (2011). Effect of screening and management of diabetes during pregnancy on stillbirths. BMC Public Health, 11(Suppl 3), S2.
36. World Health Organization. (2013). Diagnostic criteria and classification of hyperglycaemia first detected in pregnancy.
Appendix A. PubMed Search Strategy: the following search strategy was used for the PubMed
database:
("diabetes, gestational"[MeSH Terms] OR ("diabetes"[All Fields] AND "gestational"[All Fields]) OR "gestational diabetes"[All Fields] OR ("gestational"[All Fields] AND
"diabetes"[All Fields])) AND ("pregnancy outcome"[MeSH Terms] OR ("pregnancy"[All Fields] AND "outcome"[All Fields]) OR "pregnancy outcome"[All Fields]) AND ("mass screening"[MeSH Terms] OR ("mass"[All Fields] AND "screening"[All Fields]) OR "mass screening"[All Fields]). Searches results were filtered to include only studies done since 2002 and studies done in humans.
Appendix B. USPSTF Quality Rating Criteria. Adapted from PubMed Health. Accessed at
http://www.ncbi.nlm.nih.gov/pubmedhealth/PMH0009125/ on 6 June 2016.
Initial comparability of groups
RCTs—adequate randomization, including concealment and whether potential confounders were distributed equally among groups; cohort studies—consideration of potential confounders with either restriction or measurement for adjustment in the analysis; consideration of inception cohorts
Maintenance of comparable groups
Includes attrition, cross-overs, adherence, contamination
Loss to follow-up Important differential loss to follow-up or overall high loss to follow-up
Measurements Equal, reliable, and valid (includes masking of outcome
assessment)
Interventions Clear definition of interventions
Analysis Adjustment for potential confounders for cohort studies, or intention-to-treat analysis for RCTs (i.e. analysis in which all participants in a trial are analyzed according to the intervention to which they were allocated, regardless of whether or not they completed the intervention)
Appendix C. Data Extraction Tables - by Study
Study 1
KQ1 Alunni, M. L., Roeder, H. A., Moore, T. R., et al. (2015) gestational diabetes screening- change in incidence and First trimester pharmacotherapy need
Study Question: How do GDM diagnosis rates compare using the standard two-step approach versus early screening and secondarily how do
pharmacotherapy needs and perinatal outcomes compare? Source of Funding: NR
Source Population: Two cohorts from the California Diabetes and Pregnancy Program at UCSD. Total UCSD prenatal population
Study Population: Singleton pregnancies diagnosed between 7/2010 and 6/2012. Two cohorts identified by review of clinic dataset and electronic chart
review. Excluded: pts with multiple gestations, pre-pregnancy T1DM or incidental dx of T2DM (A1C ≥ 6.5% or FPG ≥ 126 in first trimester.
Design: Retrospective cohort study
Intervention: Women diagnosed early (HbA1C ≥ 5.7% or FPG ≥ 92mg/dL at ≤ 24 weeks)
Intervention Setting: UCSD Diabetes and Pregnancy Program (DAPP)
Measurement: No info on total number screened - so no data on rates of dx. Maternal age, parity, BMI, and ethnicity were abstracted from EMR. Maternal outcomes: mode of delivery and gestational age at delivery. Neonatal birth weight and length (for ponderal index). Early diagnosis cohort analyzed to calculate proportions of pts dx with GDM via A1C, FPG, and OGTT to determine pharmacotherapy as well as gestational age at initiation of pharmacotx. No info on those who screened negative therefore no predictive values of screening.
Results: BMI strongest predictor of need for pharmacotherapy. But method of dx remained significant. At an HbA1C of 5.7%-5.9% over half of pts required pharmacotx. Over 70% of those diagnosed with FPG
elevations needed meds. Maternal and neonatal outcomes of mode of delivery and gestational age at delivery were similar for all groups. Neonatal outcomes of weight and ponderal index did not differ
Attrition: No dropouts, retrospective data collection. No data on those who screened negative
Quality Score: Fair
Study 2
KQ1 Bito, T., Nyari, T., Kovacs, L., & Pal, A. (2005). Oral glucose tolerance testing at gestational weeks 16 could predict or exclude subsequent gestational diabetes mellitus during the current pregnancy in high risk group
Study Question: What OGTT cut-off values at gestational age ≤ 16 weeks can predict or exclude subsequent onset of GDM in a high risk group?
Source of Funding: Not reported
Study Population: 155 women who had not had prior GDM or altered carbohydrate metabolism in a previous pregnancy, but who had one or more risk factors and were enrolled at ≤ 16 weeks gestation. Family history of T2DM, history of large neonate, history of adverse perinatal outcome, obesity, and age were all risk factors. Included women were not opposed to any medication or dietary restriction. Eight patients were excluded from the further analysis as GDM was diagnosed by this first OGTT at gw ≤ 16.
Design: Prospective observational study
Intervention: 2-hr 75-g OGTT at ≤ 16 weeks and FPG
Intervention Setting: Women referred to a special Diabetic Pregnant Outpatient Department in Hungary
Comparison: 2-hr 75-g OGTT at 24-28 weeks; 2-hr 75-g OGTT at 32-34 weeks Measurement: 2-hr 75-g OGTT and FPG. Patients were considered to have GDM in
the event of a glucose level of ≥ 7.0mmol/L fasting or ≥ 7.8 mmol/L at 120 min according the WHO criteria. Incidence of family history of T2DM, history of large neonate, adverse perinatal outcome, obesity and age and glycosuria were all recorded (unclear if used medical records or patient self-report)
Results: 54% of high-risk women developed GDM. 4.9% at ≤ 16 gw; 19.6% at 24-28 gw; 29.4 % at 32-34 gw. Best cut-off value for fasting glucose was ≥ 5 mmol/l: OR=3.8 (1.1-13.4) for developing GDM at 24-28 weeks. No correlated risk at 32-34 weeks. Best post load level 6.2: OR = 7.5 (1.0-57.8) at 24-28 wks and OR = 2.6 (1.1-6.5) at 32-34 wks. Combined 5.3 and 6.8 with obesity is strongest predictive factor for GDM at 32-34 weeks. OR = 6.0 (1.7-21.0)
Attrition: No loss to follow-up Quality Score: Poor/Fair
Study 3
Study Question: What is the correspondence between first-trimester fasting glycaemia and the results of the OGTT in diagnosing gestational diabetes?
Source of Funding: Not reported
Source Population: 775 consecutive Caucasian pregnant women scheduled for OGTT early in 3rd trimester
Study Population: 738 eligible patients. Exclusions due to twin pregnancy, no first trimester FPG assay, or FPG diagnostic of pre-gestational diabetes Design: Retrospective cohort study
Intervention: First trimester fasting plasma glucose
Intervention Setting: Department of Obstetrics and Gynecology, University of Messina, Italy
Comparison: 2-hr 75-g OGTT at 24-28 weeks according to the IADPSG guidelines
Measurement: 2-hr 75-g OGTT according to the IADPSG Consensus Panel Criteria. Women were asked to provide first trimester FPG results (not all done at same lab). If this value was < 7.0 mmol/l they underwent OGTT and were evaluated according to IADPSG criterial. Lab was blinded to and pre-existing values of FPG. At end of trial period women’s charts were reviewed and correspondence between the two different diagnostic strategies compared.
Results: 11.9% of eligible patients diagnosed with GDM according to ADA. When ≥ 5.1 mmol/L was used as a cutoff for first trimester screening crude OR = 8.0 (4.4-14.6) and adjusted OR = 7.1 (3.8-13.1)
Attrition: 18 did not have first trimester FPG and 6 had FPG value after first trimester. One excluded b/c first trimester FPG diagnostic of diabetes
Study 4
KQ1 Fong, A., Serra, A. E., Gabby, L., et al. (2014). Use of hemoglobin A1c as an early predictor of gestational diabetes mellitus Study Question: Can an early HbA1C value of 5.7-6.4% be used as an early predictor of
progression to GDM? Source of Funding: NR
Source Population: All women who delivered at a single institution over 2 years who had an early screening HbA1C test performed at ≤ 20 weeks of gestation.
Study Population: 526 women met inclusion criteria. Women were included if they had a screening HbA1C test at ≤ 20 0/7 weeks of gestation and had been delivered by our practice from Jan 2011 to Jan 2013. Women with known preexisting diabetes mellitus or HbA1C values ≥ 6.5% were excluded. Or if they did not undergo screening or did not deliver at the institution
Design: Retrospective cohort study Intervention: HbA1c at ≤ 20 weeks gestation
Intervention Setting: MemorialCare Center for Women at Miller Children’s Hospital in Long Beach, CA
Comparison: 1 step (2-hr, 75-g) or 2 step (1-hr, 50-g & 3-hr, 100-g) OGTT at 24-28 weeks gestation