ABSTRACT
Elizabeth Ann Hayes. A Method for Studying Heterogeneous Photochemical Reactions of Polycyclic Aromatic Hydrocarbons on Atmospheric Combustion Aerosols.
(Under the Direction of Professor RICHARD KAMENS and Dr. STEVE McDOW)
Combustion aerosols are an important source of toxic atmospheric compounds, a
major class of which is polycyclic aromatic hydrocarbons (PAHs). Photodegradation is
an important atmospheric loss mechanism for PAHs. Combustion aerosols consist of an elemental carbon core and an organic layer. Several recent studies show that aerosol surface characteristics influence PAH photodegradation rates. Recent research indicates
that organic layer constituents also strongly influence PAH photodegradation in organic
liquids. These results prompted an investigation of the relative importance of aerosol surface characteristics versus composition of the organic layer.
Organic compounds found on combustion aerosols were incorporated on carbon black particles to simulate a heterogeneous aerosol environment. Organic compounds identified in diesel soot, and wood soot combustion aerosols were investigated to
determine their influence on PAH reactivity. Solutions containing dissolved PAHs, and the organic compounds were syringe spiked on to a carbon black surface. A liquid
dispersion technique for obtaining thin, even coatings of the organic particulate matrix on
Teflon filters was used to facilitate UV light exposure to the synthesized particle
matrices. The filter supported aerosol matrices were exposed to UV light in a
PAH in the organic layer on elemental carbon particles. These results indicate that
constituents which coexist with PAH in the organic layer around the elemental core influence the reactivity of PAHs on combustion aerosols. Further evaluation of specific chemical and physical properties of the organic layer and the elemental surface using the developed technique will lead to better characterization of PAH reactivity on combustion aerosol surfaces.
Organic compounds found on combustion particles are a major source of atmospheric pollutants which adversely affect human health. This investigation of
physical and chemical factors influencing reactivity contributes to the knowledge about the stability, transport, and bioavailability of toxic compounds on combustion particles in
ACKNOWLEDGMENTS
I would like to thank Professor Richard M. Kamens and Dr. Stephen R. McDow for their personal interest and guidance of my graduate research in the Department of Environmental Science and Engineering. My professional development has been enhanced by their mentorship and the opportunities they offered during my graduate studies.
I would also like to recognize the contributions of my colleages in the research group and other friends, for sharing their knowledge, skills, and efforts in solving
problems in the field of atmospheric chemistry.
I would like to express my thanks to all of the faculty, staff, and students within the School of Public Health. I value the many friendships made while in graduate school.
I am also grateful to Dr. David Leith and Dr. Michael D. Aitken for their positive criticism and support during the preparation of this report.
1. Introduction
2. Background 3. Procedure
4. Results
5. Discussion
6. Summary and Conclusions
7. References
1
4
16
35
73
112
1. Introduction
The 1990 Clean Air Act Amendments addressed air pollution problems not solved by previous amendments to the 1970 Clean Air Act. A major concern of Congress has been the failure of the EPA to control emissions of air toxics, which are pollutants of known toxicity to human health. Listed among the air toxics are polycyclic organic matter (POM). A significant portion of the mutagenicity of organic extracts of POM may be attributed to
polycyclic aromatic hydrocarbons (PAHs) and their transformation products (Nielsen et al.,
1983). PAH are of significant concern due to their known animal carcinogenicity and
widespread abundance in the environment (Valerio et al., 1984).The main source of POM in the atmosphere is combustion of fossil fuels, including stationary sources such as coal burning plants, and mobile sources such as automobiles
(Suess, 1976). Particulate matter emitted to the atmosphere during combustion typically
contains an elemental carbon core coated by an organic layer. Combustion particles from different sources vary in chemical and physical properties. Diesel soot is largely elemental carbon with a thin organic coating which is predominantly non-polar (Japar et al., 1984; Schuetzle et al., 1981; Ross and Risby, 1982). Wood smoke is composed almost entirely of polar organic material such as methoxyphenols (Kamens et al., 1985; Hawthorne et al.,
1989). PAHs represent from .5 to 5 % of the organic fraction of combustion aerosols (Ross et al. 1982, Kamens et al., 1988). The mutagenicity of combustion aerosols can be modified by the photochemical reactions of PAHs on the particle surface.
PAH distribution between the air and particle phases is proportional to vapor
present in the gas phase degrades by attack of OH radical. The half-life of PAH in the gas
phase during smog episodes is short, from minutes to hours (Nielsen et al.,1983).
Transformation rates of particle-associated PAH are influenced by physical and chemical
properties of the particle. Particle-associated PAH reactivity is primarily due to
photodegradation. (Atkinson, 1988). The photoreactivity of PAHs is not surprising, given
their ability to absorb UV radiation above the atmospheric cutoff at 290 nm. The behavior
of PAHs found in the gas and particle phase can be monitored using smog chamber studies.
These studies permit conditions such as co-pollutant concentrations, and particle
concentrations to be controlled. The photoreactivity of PAHs is evident in samples
collected in a smog chamber located in Pittsboro, NC. PAHs present on combustion
particles degrade in sunlight and are stable at night (Kamens et al., 1985, 1986,1988).
Despite the known photodegradation pathways for PAHs in solution,
photodegradation on combustion particles remains poorly understood. Particle surface
characteristics seem to heavily influence PAH photodegradation (Behymer & Hites, 1985).
Another important determinant of PAH reactivity may be the associated organic
compounds present in the extractable organic layer. Other constituents identified in wood
combustion particles include methoxyphenols (Hawthorne et al., 1989). The presence of
methoxyphenols enhances the photodegradation of PAHs in solution (McDow et al. 1991,
1992). The question remains, given the presence of methoxyphenols on soot particles, as
to whether such photodegradation pathways occur in the atmosphere.
The goal of this research was to isolate the physical and chemical properties which
influence PAH reactivity on combustion particles. A laboratory technique of exposing
«B!<^fji^^
Particle-associated toxic organic compounds, when deposited in the lung, may
be released into the body causing possible adverse affects to human health. The causal
relationship between air pollution and lung cancer deaths has been approximated as a
5% increase in the rate of lung cancer deaths for each increment of pollution as indexed
by Ing/m^ of benzo(a)pyrene (BaP) in air. This relationship was endorsed by the
National Academy of Science (Quraishi, 1985). BaP is a polycyclic aromatic
hydrocarbon which has been shown to be carcinogenic in laboratory studies and linked
to cancer in certain occupational studies (Greenberg et al., 1985).
In an attempt to protect human health, the EPA set national ambient air quality
standards (1971) for total suspended particulate matter at 260 mg per m^ for a 24 hour
standard (Quraishi, 1985). Total suspended particulate (TSP) is that portion of ambient
matter collected on a high volume filter for 24 hours with a cut size of BOjum. In 1987, a revised national ambient air quality standard (NAAQS) for particulates was introduced which considered the respirable particulate fraction equal to or less than lO/x m - PMIO (Hesketh, 1991). This was based on the knowledge that the fine fraction will penetrate into the lungs and potentially create a greater health risk than TSP
(Hinds, 1982; Seinfeld, 1986). In addition there is evidence for the preferential
concentration of toxic compounds on the smallest respirable particles (Natusch &
Tompkins, 1978; Natusch, 1974, Fisher etal., 1979).
of these combustion processes. Analysis and characterization of ambient particulate
matter on the basis of size, surface area, physical "porous" structure, phases present
(solid, liquid), chemical composition of the liquid phase, and chemical characteristics
of solid adsorption sites enhances our ability to evaluate the transport, fate, and
potential health implications of emitted particulate matter from the various combustion
sources.
The concentration of PAH in the atmosphere is determined by the emissions
from combustion sources, and their atmospheric removal through physical and chemical
mechanisms. PAHs are distributed between the gas and particle phases due to their
intermediate vapor pressures (see Table 2.1). PAHs are distributed between the gas
and particle phases because their vapor pressures are high enough to allow a significant
gas phase component, but low enough that significant amounts are adsorbed on
particulate matter. The atmospheric transformation processes of PAH depend on their
distribution between the two phases (Atkinson, 1988, Bidlemen et al., 1986, Schuetzle,
1975),
Table 2.1
PAH Molecular Weight, PAB[ Vapor Pressure (torr) at 298K, (p. 124 Atkinson, 1988)
PAH Molecular Weight Vapor Pressure
(g/mole) (torr)
Naphthalene 128 8.0x10⁻²
Anthracene 178 6.0x10⁻⁶
Fluoranthene (Fl) 202 9.2x10⁻⁶
Pyrene 202 4.5x10⁻⁶
Benz(a)anthracene (BaA) 228 2.1x10⁻⁷
Benzo(a)pyrene (BaP) 252 5.6x10⁻⁹
attack occurs in the presence of NOx (Atkinson, 1988). Photo-induced processes of
particle-associated PAH are thought to be the major mechanism responsible for PAH
degradation (Kamens et al., 1988). Studies of PAH on particle surfaces show that the
rate of PAH photolysis is strongly dependent on the surface characteristics (Behymer
and Hites, 1985).Photolysis during transport of PAH on combustion particles can lead to a loss of
carcinogenic species (Nielsen, 1988) or an increase in mutagenic species concentration
(Finlayson-Pitts and Pitts, 1986). There is disagreement concerning PAH particle
phase reactivity in atmospheric systems (Behymer and Hites, 1988). Combustion
particles differ in chemical and physical properties, therefore attempts to characterize
PAH on all of them as being either stable or reactive may be misleading. Additionally,
careful interpretation of PAH reactivity from ambient sampling data requires
quantification of all factors which influence particle-associated PAH transformations as
a function of sampling time (i.e. PAH concentration depends on ambient particle concentration). The seasonal variation of ambient particle associated PAH concentrations suggest that either additional combustion particles are present the atmosphere in the winter, or that PAHs decay much faster in the summer
(Pistikopoulos and Mouvier, 1990; Pierce and Katz, 1975; Sawicki et al., 1960).
Studies which characterized both the total suspended particulate matter and extractable
organic matter concentrations found that the increase in PAHs and extractable organic
matter could not be accounted for due to an increase in particulate matter (Lioy, 1983;
Sawicki et al., 1960). Additionally quinones, known products of PAH
photodegradation, have also been found to vary with season, being highest in the
Rapid reactions of PAHs on combustion particles have been observed in smog chamber experiments. Sunlight is the primary determinant, with relative humidity, temperature, particle PAH loading, and combustion source (diesel, wood) also
influencing the photodegration rate (Kamens et al., 1988). PAH stability on stack
collected fly ash samples exposed to ultraviolet radiation suggests that surface
characteristics of this type of combustion particle stabilizes PAH reactivity relative to
other particle types (Fisher, 1983; Raabe 1979). Other determinants of PAH
degradation rates on combustion aerosols are being sought to help characterize the fate
and transport of these compounds.
A method needs to be developed for evaluating PAH reactivity on
heterogeneous combustion aerosol particles as a function of specific physical and
chemical properties which are representative of the character of the PAH environment.
Model irradiation conditions and model combustion aerosol generation systems have
been employed to reduce the complexity inherent in an atmospheric combustion aerosol
environment. The ability to infer PAH reactivity from model studies to real ambient organic particles is critically dependent on how well the physical and chemical properties of combustion particles are characterized and represented in the model systems. A systematic evaluation of the literature on ambient aerosol particles and characterization of combustion particles from different anthropogenic sources is given
below.
Analysis of size fractionated ambient aerosols collected next to a heavily
traveled highway indicate that the fraction less than 1 ^m consists of soot or
carbonaceous material, and that PAHs are concentrated in this size fraction (Butier and
size found in ambient air samples were reported by Miguel and Friedlander (1978). The BaP concentrations expected on each size fraction of particles generated during
dark chamber wood smoke experiments are listed in Table 2.2 (Kamens et al. 1986).
The measured particle size distribution in the chamber was fairly stable and did not
cause a change in the measured PAH concentration (Kamens et al., 1986),
Table 2.2
%BaP Expected in Each Particle Size Range
(Kamens etal., 1986) |
Particle size range (/im) % of total BaP in each size range
.056 - .1
.1-.178 .178-.316 .316-.562
1 .560 - 1
19
49
13 11
8 1
Combustion particles have been evaluated in terms of their percentage of
Table 2.3
Percentage Elemental to Organic Content for Combustion Particles
(Finlayson-Pitts & Pitts, 1986) |
Combustion Source Elemental Carbon/Organic Carbon
Coal furnaces 33%-95%
Automobiles, Diesel 75%-79%
Automobiles, Gasoline 26%-54%
Fireplace, Hardwood 32%
Fireplace, Softwood
1% 1
Table 2.4
Concentrations of Benzo(a)pyrene in Particulate Matter from Various Sources |
Source /ig/g BaP in particulate matter Reference Tunnel samples 66-500 Daisey, 1986 Coal Burning - Residential Anthracite 10-20 ft 1Coal Burning - Residential Bituminous 240-600 ti 1
Coal Burning - Power Plants 7 * 10-^ ft 1
Oil - Burning Power plants .005 " Residential wood burning - Fireplaces 3-141 ft 1
Wood Stoves 213-870 tt 1
Coke Plant 1400-5800 H 1
Soil .1-2.3 " 1
The organic composition of combustion particles may also vary widely as a fimction of combustion source. Automobile gasoline engine exhaust particulates were characterized as consisting of 50% saturated aliphatic, 5% PAH, and 30% oxygenated hydrocarbons (Boyer and Laitinen, 1975). Allegheny tunnel samples consisted of 50% aliphatics, 10% PAH, and 21% very polar compounds (Salmeen et al., 1985).
Analysis by fractionation of wood soot indicates that only 11-14% of the extractable organics were eluted in the neutral or semipolar fractions, probably aliphatic and PAHs, and 81-84% elutes in the most polar fraction, suggesting that most of the particle-bound organics in wood smoke are very polar in nature (Kamens et al., 1985).
Specific extractable organic compounds have been identified on combustion particles, primarily in an attempt to identify compounds unique to particular sources for use as tracers. Aliphatics, aza-arenes (heterocyclic nitrogen compounds), PAHs, nitto-PAH, aliphatic and aromatic carboxylic acids, dicarboxylic acids, aromatic acids, ketones, quinones, phenols, and halogenated halocarbons are compound classes which have been characterized in filter collected ambient air particles, although knowledge about relative source contributions is incomplete. Polar organic compounds have been difficult to identify using current gas chromatography (GC) or liquid chromatography (LC) techniques due to their thermal instability, or reactivity with the column support. However, a number of methoxyphenolic compounds similar to lignin structural units have been identified in unfractionated wood combustion particle extracts (Hawthorne et
al., 1989).
Polycyclic aromatic hydrocarbons absorb strongly in the utaaviolet radiation
region and are readily photooxidized by ultraviolet light transmitted through the
atmosphere. The rate of photoreactivity increases with increasing polarity of the solvent when PAH's are irradiated in liquids (Nielsen et al., 1983). PAH half-lives in
11
than in pure hexadecane (McDow et al., 1991). The relative importance of surface characteristics and organic layer composition in determining PAH reactivity on combustion particles remains to be determined.
Results of PAH reactivity experiments using model combustion particles are often difficult to interpret due to the different protocols used. Variations in the ultraviolet source, particle surface area, PAH concentration, and particle surface
Table 2.5
Review of Heterogeneous PAH Photodegradation Experiments
Investigator Reactor Irradiation Source Substrate Surface PAK PAK Kalf-Life of
Area concentratio coverage PAK (hrs)
(m^/g) «s/« liglm^
Behymer & Kites rotary cell Mercury lamp, Silica gel 637 450ftg/g of .706 4.7
(1985) 17.6W/m2 mixed PAK
1 Behymer & Kites »
-alumina 224 450 2.0 1.4
(1985)
Behymer & Kites m
•
fly ash 5.1 450 88 31
(1985)
Behymer & Kites m
"
carbon black 11.6 450 39 570
(1985)
Thomas & Tebbins tubular cell
-acetylene soot unknown 1800 Mg/g , BAP < 1 (58%
(1968) llftx6in loss 40min)
Daisey et al., fluidized 200W Hg vapor coal fly ash 2-9 570 Mg/g, 63 7
(1982) bed lamp,36W/m2 Pyrene
Korfinacher et al. rotary cell 150W Xenon Arc coal fly a^ 7 75 Mg/g BaP 10.1 > 76
(1980) Lamp
Daisey et al. fluidized bed 200W Hg Vapor carbon black. 860 80 .093 >23
(1982) lamp, 36W/m2 carbosieve S
Kamens et al. Smog Chamber Sunlight, .2- carbon black. 230 100 .44 >10
(1985) .3cal/cm2/min aerosolized
Fox & Olive filters Sunlight enriched unknown unknown unknown short
13
The influence of physical and chemical characteristics of combustion particles on the photo-reactivity of adsorbed PAH must be identified to accurately assess reaction mechanisms. PAH concentration on the particle surface is an example of one factor which influences the photodegradation rate, which might explain discrepancies which exist among reported half-lives of PAHs when the particle substrate is identical. Fly ash had been investigated as a surface which stabilizes PAHs. However, investigators have reported different reactivities for PAH on fly ash. Korfmacher et al.( 1980a,
1980b) found that only 11 % of BaP degraded upon exposure to 190 hours of radiation. Photodecomposition initially occurred rapidly but stopped after only a small fraction of BaP degraded. Daisey et al. (1982) found that pyrene adsorbed on fly ash degraded much faster when exposed to light, and had a half life of 7 hours. The systems employed to expose the particles to light are different but have been compared by
Behymer and Hites (1988) and shown to give equivalent results. Korfmacher employed
a rotary reactor where particles are rotated in a cell which is transversely irradiated by a light source (1980b). A fluidized bed photoreactor was designed by Daisey et
al.(1982) to enhance light exposure to particles by suspending them in a gas flow. The PAH concentrations adsorbed on the fly ash varied between 63/tg/g in Korfmacher's study and 570/ig/g in Daisey's study. Although different PAH were used in these studies, similar reactivity is expected for pyrene and BaP. The differences in the two studies is not likely to be due to differences in specific compounds. The vapor
deposition technique used by Korfmacher allowed monolayer adsorption of PAHs from
the vapor phase, to mimic the condensation processes undergone by PAHs in the stack
of coal furnaces (1980b). In Daisey's experiment, the PAHs were adsorbed onto fly
ash using a slurry coating technique, where the concentration adsorbed is determined by
varying the solution concentration applied. Different types of fly ash may also account
illustrate the importance of knowing what factors to control in experiments of PAH
photodegradation on model and real particles.
Adsorption of PAHs on fly ash has been studied by Eiceman and Vandiver
(1983), using elution analysis, showing that the adsorption isotherms are irreversible at
concentrations below 30^g/g concentration of PAH. Therefore, PAHs which are
chemisorbed or adsorbed in an irreversible manner to the surface of fly ash may not be
able to undergo photodecomposition. This could explain the discrepancy between
results of Daisey et al. (1982) and Korfmacher et al. (1980a). PAHs adsorbed on top
of previously sorbed PAHs or other organics would be able to undergo photochemical
reactions as is observed in solution. The concentrations of extractable organics found
on fly ash sampled from industrial stacks suggests that PAHs on fly ash in the
atmosphere are present as less than a monolayer. If the particle substrate and PAH
concentration are the controlling factors in the atmospheric system, then Korfmacher's
results of stability may be atmospherically relevant for fly ash particles emitted from
industrial stacks.
Considerable care must therefore be taken when designing a system to model particle associated organic compounds. The emphasis of this research was to model a heterogeneous two phase solid-liquid combustion particle so as to evaluate the
important physical and chemical factors of combustion particles which determine PAH
photoreactivity. The model combustion particle contained PAHs dissolved in an
organic layer surrounding a carbon core. The criteria for a model system was that
particles be consistently generated, that the organic composition could be easily
modified, and that the particles be readily accessible to exposure to ultraviolet
radiation. In the method developed, selected organics were coated onto carbon black
particles along with the PAHs.
The goal of this study was to develop a technique to model, in an
15
Distribution of a PAH in the environment depends on whether the PAH has a stronger affinity for the solid, liquid or gas phase, as is influenced by its vapor pressure, solubility, and adsorptive properties. The photoreactivity of a PAH varies depending on whether it is in a vapor, solution, or solid phase. PAHs primarily on the particle phase are in close proximity to other organic compounds also adsorbed on the particle
surface. This investigation of the particle associated PAH reactivity addresses the role of associated organic compounds in addition to the role of elemental carbon surface
3. Procedure
A method was developed using a liquid phase technique to prepare uniform
multicomponent organic coatings on carbon black particles, and to uniformly distribute the coated particles on supportive Teflon filters. This method permits the adjustment of the composition and amount of constituents in the organic coating, and the type of surfaces used, so that realistic PAH environments on combustion particles can be generated and studied. Particles were exposed to ultraviolet light and subsequently
analyzed for evidence of PAH photodegradation over time.
Figure 3.1 illustrates the methodology and apparatus used in this study.
Multicomponent organic coated carbon black particles were dispersed on Teflon filters. After coating and dispersing the multicomponent particles onto duplicate filters, the samples were supported on a turntable which encircled a water-cooled UV lamp. Samples were removed from the turntable reactor at different intervals during the exposure period. The samples were then extracted using a mini-Soxhlet extraction apparatus and prepared for analysis by reverse phase HPLC and GCMS.
Determination of the rate of photochemical transformation of PAHs was determined
from analysis of the filter samples.
3.A Buchner Funnel Liquid Particle Coating and Dispersion Technique The coating technique required specification of five components: 1) Target Compound for Photoreactivity analysis, 2) Co-reacting Organic Species, 3) Particle
17
the existing data base on liquid phase reactivity. The PAH spectra were obtained from Finlayson-Pitts and Pitts (1986). The isoeugenol spectrum was obtained with a HP
8451A Diode Array Spectrophotometer (UV-VIS). The absorption spectrum in Figure
3.2 plots the amount of light adsorbed by a compound, or log e, the log of the molar extinction coefficent as a function of wavelength. The molar extinction coefficent of a compound reflects its ability to absorb light and may be defined using the Beer-Lambert
absorption law (equation 3.1).
I/I„ =10""' eq. 3.1
Iq = incident light, I = transmitted light, e(l/mol*cm) = molar extinction coefficent, c = concentration of absorbing species, 1 = path length.
The concentrations chosen were in the same range as those found on
combustion-generated particles collected from the atmosphere. A number of PAHs
were chosen so that possible effects of differing vapor pressures or solubility on
reactivity within the matrices could be monitored. Constituents of the organic layer
were chosen which exhibited strong influences on PAH photodegradation in liquid
phase experiments (see Figure 3.4). Concentrations of these co-reactive constituents were chosen to be similar to concentrations observed on combustion particles
(Hawthorne et al., 1989). A model combustion surface which had surface areas, surface functional groups and carbon content similar to atmospheric combustion particles was chosen. Criteria for surfaces were that they be well characterized in addition to being similar to combustion-generated particle surfaces, such as is the case for carbon blacks. The dispersion solvent was to be easily evaporated from the
particles and the filter. Solvents and filters were selected which maximized the amount
of PAH adsorbed on the particles and minimized adsorption on the filters. Coating
components were to be miscible with the dispersion liquid yet the dispersion liquid was
not to compete with the PAH, isoeugenol or other coating components for adsorption to
was evenly dispersed was to be nonadsorptive to all of the constituents, so that the coating remained attached to the particle surface rather than to the filter surface.
The following procedure was used to obtain an evenly-distributed, thin layer of coated particle on Teflon filters. 1 mg Carbon Black (Development Carbon T10121
[Citco]) was syringe-spiked with 400/*! of the multicomponent coating dissolved in dichloromethane. The mixture was sonicated for one minute in a 2ml glass vial, then the dichloromethane was evaporated, leaving the coating on the particles. The coated particles were then deposited on a 2^m pore size, 47mm Zefluor filter. Zefluor filters are a tortuous path filter Teflon membrane with a chemically resistant Teflon backing. The particles were evenly dispersed on the filter using a Biichner funnel. 25ml of dichloromethane solvent was placed in the Biichner funnel over the Zefluor filter. The coated particles were scraped out of the glass vial using a spatula and washed with dichloromethane into the Biichner funnel. Particles which could not be retrieved off the glass vial with a spatula were sonicated briefly, as extensive sonication would extract the coating from the particles (Daisey et al., 1986). Once all the particles were
suspended and dispersed in the liquid above the Biichner funnel a vacuum was applied,
drawing the solvent through the filter, and leaving the particle/coating matrix
distributed evenly on the filter.
The Biichner Funnel Filtration Technique: The Buchner funnel filtration (BFF) technique first involved coating carbon black particles in a small vial and then
transferring the particles to the Biichner funnel. A variety of transfer techniques were evaluated. First, the coated particles were resuspended in a small volume of solvent.
Then the coated carbon black particles were scraped off the walls of the glass vial using
a spatula (spatula method) or removed from the walls using sonication (sonication
method), then transferred to the filter. The reference method for complete transfer of
19
clean the walls which then were placed in a thimble for extraction. This method was only used as a test for performance of the spatula and sonication methods.
An alternative method of adsorbing the compounds from a liquid phase onto the carbon black particles was investigated. Carbon black and the organic constituents were separately placed in the Biichner funnel, so the step of tiansferring coated particles from a vial to the liquid phase could be eliminated (no transfer method). Adsorption of the organic constituents from solution to the carbon black surface would be contioUed by their diffusion rates in solution, the number of collisions with the
surface, and the adsorption strength.
The Slurry Coating Technique; Other coating techniques were attempted before and during development of the Biichner funnel filtration (BFF) technique. Initial experiments measuring PAH reactivity on filter surfaces in the dark and exposed to light were performed with the PAH slurry coated on the filters. To initially
determine the effect of carbon black on PAH reactivity in the light and dark, PAHs were slurry coated on bare filters and filters containing carbon black. Using this method a slurry coating of carbon black, PAH, organics and dichloromethane are deposited on to a filter. The dichloromethane is allowed to evaporate. PAH and organics remain coated on to the carbon black on the filter. An initial experiment was performed to measure the influence of isoeugenol on PAH reactivity on particles. For this experiment, two slurry coatings were prepared in dichloromethane, one containing isoeugenol and PAH and one containing PAH for application to carbon black particles
on filters.
3.B Turntable Photoreactor
After coated particles were deposited on filters, the filters were then placed in a
Turn-table photoreactor illustiated in Figure 3.1. The turntable arrangement permitted
cylindrical lamp, minimizing any positional dependence in the exposure process. Use of a stable, consistent light source and specific exposure configuration helped reduce the variability in exposing these samples to light. The turntable was modified by making Teflon filter holders to occupy standard test-tube positions, to support 9 filters of 47 mm size. During the process of being rotated around the lamp the filters were vertical, therefore the method was sensitive to the particles' ability to remain on the filter during the exposure process. A 450 Watt high pressure quartz mercury vapor lamp was used to generate the UV radiation to which the samples were exposed. The spectral distribution of the lamp consisted of discrete emission lines in the UV region; Figure 3.3 illustrates the spectral distributions of the Hg lamp and the sun. The Mercury UV lamp was placed in either a quartz or a borosilicate water cooled
immersion well. The emmision wavelengths to which the samples were exposed was specified by choice of the immersion well and light filters placed around the lamp. The immersion well was cooled using a Little Giant Model 1-AA submersible pump (Little Giant Pump Co., Oklahoma City, OK), which cycled distilled deionized well water through the immersion well and an ice bath at 1 liter/min. The stability of the ultraviolet light intensity generated by the lamp was continuously monitored with an Eppley Ultra-Violet Radiometer (Eppley Laboratory, Inc., Newport, R.I.)
3.C Soxhlet Extraction
Before the samples were extracted, an internal standard of 5jwl or 10/il of 100ng//il of b-b'-binapthyl was added to the extraction flask along with 30 ml of dichloromethane. Filters were individually extracted using micro-soxhlet extractors for
12 hours. Dichloromethane was reduced to a volume of 1 ml using a Kudema-Danish column, and the entire sample was transferred to a tared vial. Next the sample was
blown down to almost dryness to exchange dichloromethane with acetonitrile, and to
21
Dichloromethane was chosen over tolutene to extract the organic constituents from the carbon black to avoid losses of compounds through volatization during the solvent
reduction steps (Daisey et al., 1986).
3.D HPLC
Analysis was performed using a Spectra Physics 8700 gradient elution HPLC, with a reverse phase column, ultraviolet excitation, and fluorescence detection. A manually packed precolumn was used to protect and prolong the lifetime of the
analytical column. LiChroprep RP-18 (a hydrocarbon phase C16 chemically bonded to silica gel), particle size 25-48/xm, catalog #9303 by EM Reagents was used to pack the precolumn. The analytical column (Supelcosil LC-PAH column with 5 mm packing,
15 cm X 4,6 mm, Supelco catalog number 5-8318M) was specifically designed for analysis of priority pollutants including PAH's. The mobile phase was water and acetonitrile of high purity grade, either Fisher Scientific's Optima or HPLC Grade. The SP 8700 HPLC was equipped with a helium degassing manifold. Degassing of the solvents was necessary to ensure that bubbles do not form on the low pressure side of the pump. The gradient elution solvent program for PAH analysis is listed in Table
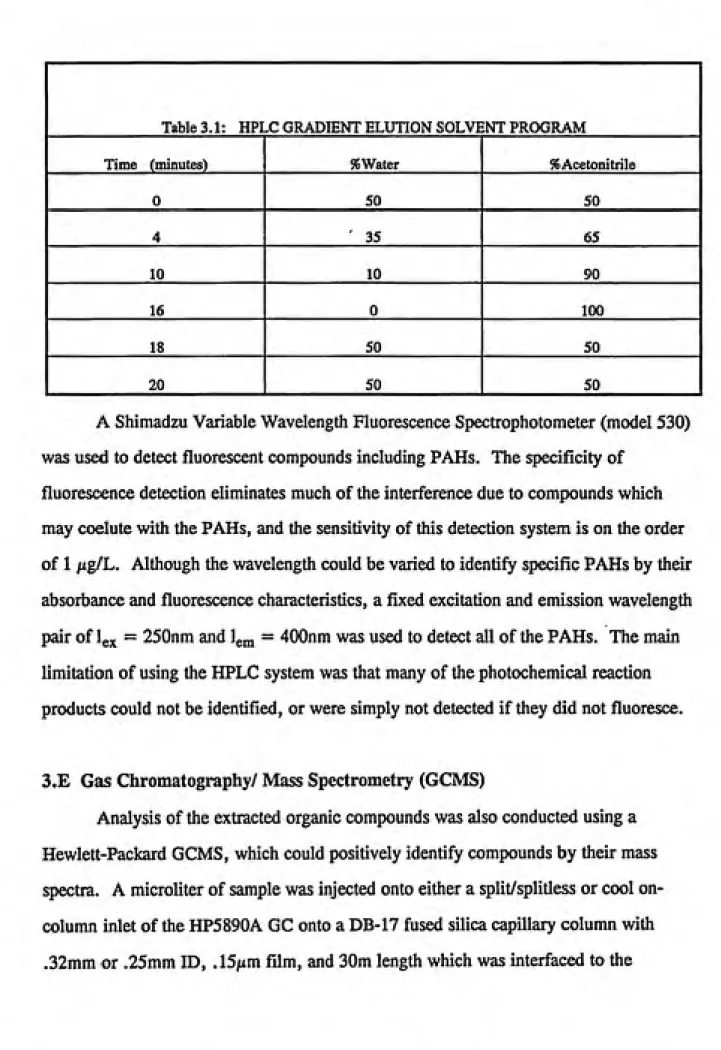
Table 3.1: HPLC GRADIENT ELUTION SOLVENT PROGRAM I
Time (minutes) %Water %Acetomtrile 1
0 50 50
4 35 65
10 10 90
16 0 100
18 50 50
1 20
5050 1
A Shimadzu Variable Wavelength Fluorescence Spectrophotometer (model 530)
was used to detect fluorescent compounds including PAHs. The specificity of
fluorescence detection eliminates much of the interference due to compounds which may coelute with the PAHs, and the sensitivity of this detection system is on the order
of 1 /tg/L. Although the wavelength could be varied to identify specific PAHs by their absorbance and fluorescence characteristics, a fixed excitation and emission wavelength pair of Igx = 250nm and Ig^ = 400nm was used to detect all of the PAHs. The main limitation of using the HPLC system was that many of the photochemical reaction products could not be identified, or were simply not detected if they did not fluoresce.
3.E Gas Chromatography/ Mass Spectrometry (GCMS)
Analysis of the extracted organic compounds was also conducted using a Hewlett-Packard GCMS, which could positively identify compounds by their mass
spectra. A microliter of sample was injected onto either a split/splitless or cool
23
HP5971A Mass Selective Detector (MSD). Helium was used as the carrier gas; the inlet temperature and oven temperature program varied depending on the injection inlet (split/splitless vs on-column, see Table 3.2a and 3.2b) and solvent used. MS
Chemstation for DOS on a Hewlett Packard 386 personal computer was used to control the GC and MSD parameters during a run and for subsequent data analysis. When analyzing for products full scan ion chromatograms were obtained of the filter sample extractions, which were injected directly on-column to the GCMS.
Table 3.2a
Temperature Program for the GC Oven for On-column injection 1
Oven initial T: 100 °C, oven maximum T: 350 °C
Detector: 300 °C, Iniector B(on col): 100 °C, Run time = 26.2 minutes |
Rate (°C/min) Oven Final Temp (°C) Final Time (min)
15 250 0
5 280
10 1
Table 3.2b
Temperature Program for the GC Oven for Split
Oven initial T: 100 °C, oven maximum Detector: 300 °C, Injector A(split-splitless): 300 °C,:
-Splitless injection 1
T: 350 °C
Run time = 30.3 minutes
Rate (°C/min) Oven Final Temp (°C)
1 Final Time (min) 1
10 250 0
3.F NBS Standards
Work up and analysis methods were tested, optimized, and then verified using NBS Standards. The NBS Diesel Soot 1650 was used to test extraction efficiency and reproducibility. The NBS 1647b mixture of the PAHs in acetonitrile was used to quantify the peak areas obtained from the chromatograms to the known concentrations. Three standard samples, each serial dilutions of NBS 1647b were typically analyzed for each experiment to generate a calibration curve relating the integrated area data and
concentrations.
3.G Calculation of Reaction Rates
A pseudo-first-order rate expression has been used to represent PAH
decomposition on wood combustion particles exposed to solar radiation in a smog
chamber (Kamens etal., 1985). In a first-order reaction the reactant concentration
decreases exponentially with time. This behavior has been observed for the
photodegradation of the PAH adsorbed on to the carbon black particles in many of the experiments performed. The first-order rate law for PAH disappearance may be expressed by equation 3.2a.
- d[PAH] ^j^jp^jj^ . p^jjj ^ [PAHJo at t=0 eq. 3.2a
dt
where [PAH] is the concentration of PAH and k is the rate constant. Equation 3.2a rearranges to equation 3.2b:
—^—d[PAH] =- kdt eq. 3.2b
[PAH]
and when integrated yields equation 3.2c:
Inl?^^ =- kt eq. 3.2c
25
[PAHJo is the initial concentration of PAH, [PAH]j is the concentration of PAH
rPAHi
measured at time t. If In--- is plotted against t, then a first order reaction will
[PAH].,
give a straight line. The rate constant k may be determined from the slope. A useful
indication of the rate of a chemical reaction is the time it takes for the concentration of
a substance to fall to half its value. This is the half-life, expressed as ti/2, and may be calculated for a first order reaction using equation 3.2c. This is illustrated in equation
3.3a, which may be solved to give equation 3.3b
kt, =-ln^—^ eq.3.3a
2 t^oJti =—— eq.3.3b
2 '^
For a true first order reaction the half-life of a reactant will be independent of the initial concentration. The results obtained for PAH photodegradation due to photolysis were expressed in terms of the PAH half-lives by applying a linear least
[PAH]
square regression for each plot of In---— versus t. The square of the sample
correlation coefficient r^ measures the strength of this linear relationship, but when no photodegradation occurs this measure is inadequate. This is also true for other cases when a straight line model is not appropriate.
3.H BET Surface Area
surface. The adsorption isotherm named after its authors, Brunauer, Emmett and Teller, can be used to calculate accurately the surface area from the plot of partial pressure of a gas versus isotherm parameters, and the surface area can be calculated from the slope and intercept (Castellan, 1983). The isotherm (equation 3.4a) assumes
multilayer adsorption may occur at high pressures.
V/Vmon=cz/((l-z)(l-(l-c)z)) cq. 3.4a
V is volume of adsorbed material, Vmon is the volume adsorbed for complete
monolayer coverage, c is a constant, z = p/p*, p is the equilibrium vapor pressure, p* is the bulk vapor pressure (temperature dependent). Equation 3.4a may be rewritten to
obtain equation 3.4b.
l/(z-l)V = 1/cVmon + (c-l)z/Vmon eq.3.4b
A plot of l/(z-l)V versus z will permit evaluation of (c-l)/Vmon as the slope and cVmon as the intercept, which combined will give c and Vmon. Once the volume of gas adsorbed on a monolayer is obtained, the number of N2 molecules in the monolayer on the surface may be calculated from the ideal gas law, n = PV/RT at T=273 K and p =
latm. From the number of nitrogen molecules on the surface, the surface area
available for monolayer adsorption may be determined using a Nj molecular
cross-section of. 162 nm.
3.1 Scanning Electron Microscopy (SEM)
27
interaction with the surface was also attempted by taking SEM photographs of the filter
supported carbon-organic layer matrices.
Scanning Electron Microscopy of particle surfaces generates an image which conveys more about the shape of particles, roughness, and roundness than optical microscopy. This is a result of the increased depth of field. The disadvantage of SEM is the necessity of examining the samples under vacuum, to generate a stable electron beam. The vacuum may cause volatile compounds which are present on particles to desorb from the particle surface, altering the particle characteristics during the process of analysis. The SEM is located in the electron microscopy laboratory in the Pathology Department of the UNC Medical School. Before placing samples in the SEM, the
surface of the sample was made electrically conductive so that current from the electric beam would not build up on the particles. This was accomplished by coating samples with a thin conductive material. To coat the particles 2 mm x 2 mm snips of the
filters, mounted on metal studs, were placed in a sputter coater chamber. The chamber was evacuated and argon was added to create an argon atmosphere. A tungsten
filament heated and vaporized a thin gold-palladium wire. This placed a thin layer a
few atoms thick on the sample and filter, which was not sufficient to affect the measurement of particles larger than .01i«m.
The filter samples were loaded into the Scanning Electron Microscope when the electron beam was off. The SEM diffusion pump was turned off, and nitrogen gas was added to vent the electron microscope chamber. A transfer arm was opened, and samples on metal studs were placed on the stage along with a standard. The chamber was pumped down to a vacuum, and then the electron beam was turned on. The electron beam scanning speed, magnification, focus, contrast and brightness were adjusted using the standard. The stage was rotated manually to place each sample
Pictures of SEM images were obtained with a split image, where the right frame gave 8 to 10 times the resolution of a small rectangular region of interest
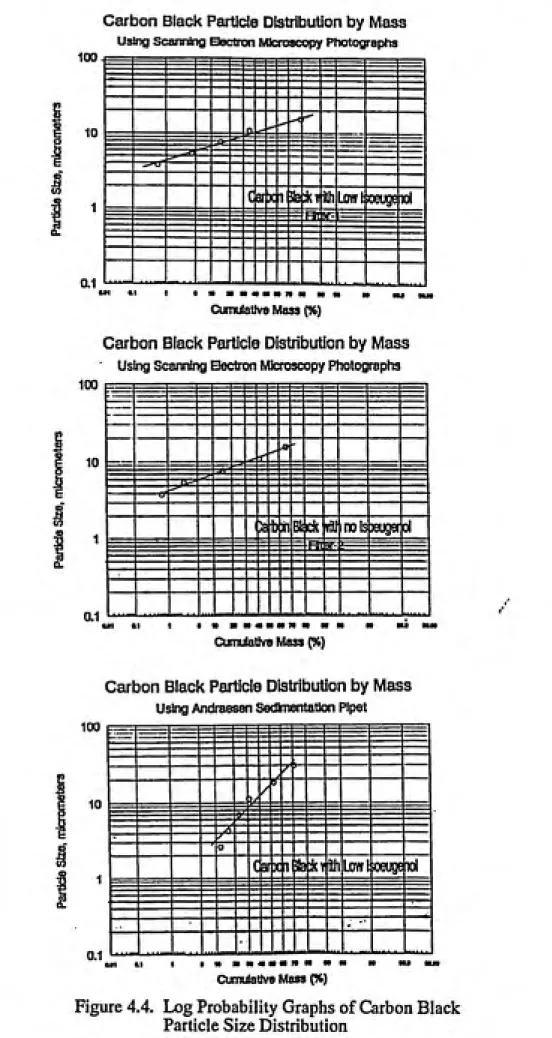
specified within the frame on the left. The scanning electron microscopy pictures were used to determine the particle size distribution using a transparency of the Porton eyepiece graticule, which was then calibrated using the line rule displayed on the SEM photograph. The results were plotted on cumulative log-probability paper, a count
median diameter was determined, and from this a mass median diameter by assuming
uniform density.
Zefluor filters were used to support the particles during the SEM analysis. A more homogeneous filter with smaller pore sizes would have been preferable; however, it was difficult to acquire filter material resistant to degradation from the solvent which was used to disperse the particles on the filter (Nucleopore no longer manufactures filters whose membranes were made of Polyester with a pore size of .2fim). The particles examined using Scanning Electron Microscopy were prepared in an identical fashion to the particles which were prepared for photodegradation experiments. Filters which contained particles coated with PAH and three different concentrations of
isoeugenol were prepared using the Biichner funnel filtration technique for SEM analysis. A filter containing carbon black with no coating, and filters which had coating but no carbon black, were also prepared using the BFF technique for SEM analysis. SEM photographs of a blank filter were also obtained to determine the
structure of the filter surface.
3.J Optical and Fluorescence Microscopy
29
which was equipped with both a tungsten and a mercury lamp and an Orthomat E camera was used to generate photographic images of particles and the PAHs in the sorbed liquid layer. A 25X phase contrast objective lens was used to magnify the particles, and color film was used to capture the image of the green fluorescence emitted by the benz(a)anthracene present in the coating surrounding the particles when illuminated with the mercury lamp. Thin Teflon sheets were cut out to support
particles which were coated with a variety of organics and mixtures of organics
including benz(a)anthracene dissolved in dichloromethane, isoeugenol, and hexadecane. Filter samples were also prepared using the Biichner funnel filtration technique. Filters which supported carbon black particles coated with benz(a)anthracene only, and
particles coated with both benz(a)anthracene and isoeugenol were prepared for analysis
using the Optical/Fluorescence Microscope.
3.J Carbon black particle sizing using an Andreasen Sedimentation Pipet
Stoke's law describes the settling of particles in a quiescent fluid, and it may be applied to predict the particle size distribution of particles using either air or liquid fluids. If no mixing occurs in the fluid so that the system is in equilibrium, then the force of gravity may be equated with the resistant forces on the particles due to the
fluid media as in equation 3.5a and 3.5b.
Fg=FR eq. 3.5a Fg is the force due to gravity, FrIs the resistant force of the fluid.
mg=2p^mud eq.3.5b
m is particle mass, g is acceleration due to gravity; /xm is fluid viscosity; u is velocity,
d is particle diameter. Equation 3.6 relates the mass of a particle to its diameter and the fluid and particle densities and when substituted into equation 3.5b for mass yields
equation 3.7.
m is the mass, d is the particle diameter, tp is the particle density, rm is the fluid or
medium density. Equation 3.7 has been developed to determine the particle diameter as a function of settling velocity, or at specific times with measured settling distance.
d=18mmH/((rp-rm)gt)»/2 eq 3.7
d is particle diameter, mm is fluid viscosity, H is distance particle has fallen in time t, r p is the particle density, rm is the fluid density, g is the acceleration due to gravity, t is
time.
A commercially available Andreasen Sedimentation Pipet (loaned to us by Dr. David Leith) was used to determine the particle size distribution of the organically coated particles generated by using the BFF technique. The Biichner funnel filtration technique is a liquid based technique, therefore a liquid based settling technique was preferred to determine the actual size of particles generated during particle preparation. The liquid used in the BFF technique to coat the particles was dichloromethane. The apparatus was placed in a hood, and the dichloromethane was allowed to equilibrate for several hours prior to use. Four grams of carbon black which were coated with
Buchner Funnel Filtration Apparatus
Turn TablePhoto—reactor
zobotmt
CCATED CAKBON BIACK ON ZEFLUOR FILIER
Micro Soxhlet
Extractor
Hgure 3.1. Apparatus used to prepare, expose to light, and extract organic coated carbon black particles
BaA
^
W3 4.6
Isoeugenol
250 300 350 400
Wavelength (nm)
33
Spectral Distribution of the Sun
S 2
3
u. 1
From Fini ayson-Pi tts ^' Pitts, 19B6 T----T---1
Blackbody, 6000K
Outside Earth's
Atmosphere
en
At Sea Level
! Vs b e
100 200 300 400 500 600 700 800
Wavelength (nm)
Spectral Distribution of Mercury Lamp
.08
a
;^ .06
rr -04
i .02
c
0
. Throuoh Borosilicate Immersion Well, Ace . Glass Incorporated
1
.Ai.100 200 300 400 500 600 700 800
Wavelength (nm)
a
a
o
•i-H
cd
o a
o
U
0
0
benz(a)anthracene
in methoxyphenols
J______L
200
Time (minutes)
400
Figure 3.4. Comparison of Benz(a)anthracene photodegradation in hiexadecane and in methoxyphenols from McDow et al., 1993
35
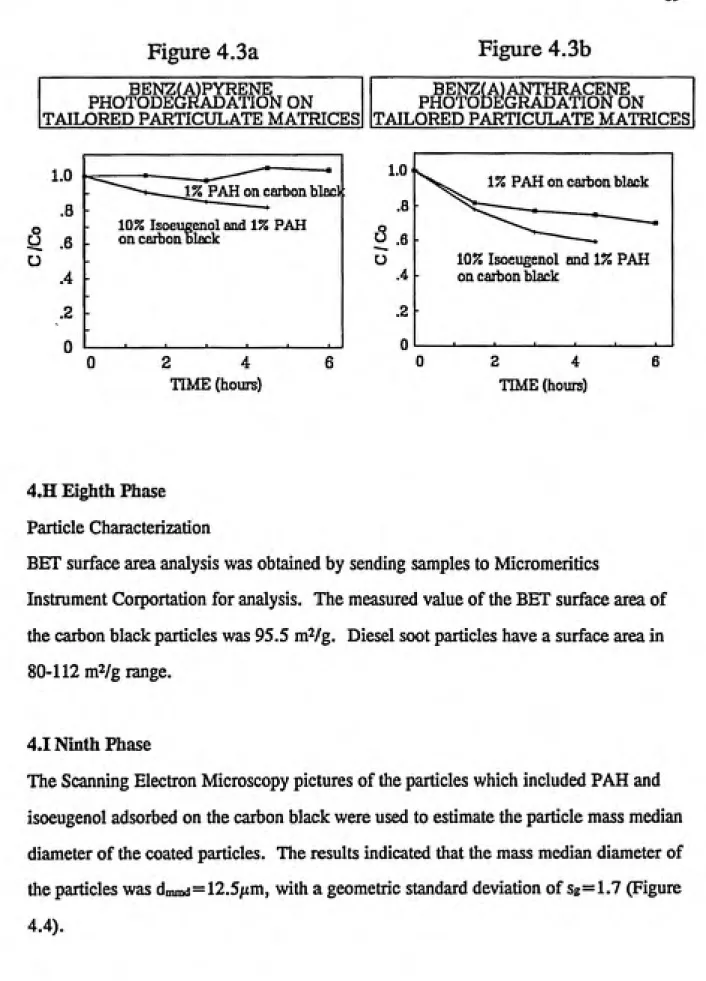
4. Results
Summary of Experiments
There were 11 phases to the experimental work. First, PAH reactivity on filter surfaces in the dark and exposed to light was determined. Second, reactivity of PAH when coated on bare carbon black surfaces supported by filters in the dark and exposed to light was determined. Third, the influence of isoeugenol's presence with PAH in the coating of the carbon black particles supported by filters on PAH stability in the dark and exposed to light was measured. Fourth, a technique was developed for the
preparation of uniform multicomponent organic coating on carbon black particles which minimized association of the coating with the filter, and maximized coating association with the carbon black surface. Fifth, PAH degradation rates on these multicomponent
organic coated carbon black particles in the dark and in the light were measured. The
sixth phase was geared towards product analysis of the photodegraded PAH samples as well as PAH degradation rate determination on multicomponent organic coated carbon black particles at higher isoeugenol concentrations than in the fifth phase. In the seventh phase different light filters were used including the borosilicate immersion well, and the light filters to cut out everything but 366nm wavelength. The particle surface area was measured using the BET method of analysis in phase 8. Scanning electron microscopy was performed on filter samples in phase 9. Optical and
fluorescence microscopy was performed in phase 10. In the eleventh phase the particle size distribution of the coated carbon black particles was determined using an
4.A First Phase
Sept 4, 1991
The purpose of this experiment was to evaluate PAH degradation in the dark for PAH deposited on Pallflex filters. The samples were placed in the turntable reactor for 3 hours, and removed for extraction and analysis at 1 hour increments. The PAH were slurry coated on to the filter (see section 3A). A syringe was used to transfer 50^1 of NBS 1647b solution containing PAH to the filter. The concentration of PAH in the solution was 114.5 ng/^1. The HPLC instrument was used to analyze the extracted
samples. Results are described in Table 4.1 for fluoranthene (Fl), benz(a)anthracene (BaA), benzo(k)fluoranthene(BkF) and benzo(a)pyrene (BaP). TT refers to the
turntable reactor.
Table 4.1a
PAH Dark Reactivity on Pallflex Filters
Compound Half-life
(his) in IT
R2
Fluoranthene (Fl) 1.8 .99
Benz(a)anthracene, 10 .65
(BaA)
Benzo(k)fluoranthene 27 .97
, (BkF)
Benz(a)pyrene (BaP) 8.7
.99 1
Table 4. lb
% PAH Remaining on Filter after
3hr in Dark
Compound % on Filter % on Filter
®31ir in IT @3hrinbox
Fl 32 77
BaA 79 90
BkF 92 90
BaP 79
88 1
The results are shown in Tables 4. la and 4. lb, and indicate that PAH are not reactive
on the filter in the dark, and there is some loss due to blow off when placed under a
37
September 14, 1991
The purpose of this experiment was to determine PAH photodegradation rates on
Pallflex quartz fiber filters. Filter samples were irradiated for 0, .5, 1, 1.5, and 3 hrs prior to extraction and subsequent analysis. One filter was kept in the dark for 3 hours
prior to extraction.
A PAH stock solution Standard #1, containing fluoranthene,
benzo(a)anthracene, benzo(k)fluoranthene, and benzo(a)pyrene was prepared.
Concentrations of PAH in this standard are reported in Table 5.1 (section 5B). 250^1 of Standard #1 solution was slurry coated on to each filter. The total PAH
concentration in the solution was 34.3ng/^l. HPLC was used to analyze the extracted
samples.
Table 4.2
PAH Photolysis Rates on Pallflex Filters -/|
and % PAK\ Remaining on Filter after Exposure to UV
Compound Half-life (hrs) R2 Half-life (hrs) r2 % on Filter % on Filter
till 1.5hr til3hr @1.5hr in IT @3hr in 1 r
Fl .48 .91 .75 .87 14 6
BaA .55 .91 .83 .88 16 7
BkF 3.2 .77 3.5 .62 110 54
BaP .90 .92 1.2 .94 34
16 1
Results in Table 4.2 suggest that Fl, BaA, and BaP are all reactive when exposed to UV light. BkF is less photoreactive then the other PAHs. PAHs were stable on the
4.B Second Phase September 27, 1991
The purpose of this experiment was to determine the reactivity of PAH in solution with
hexadecane adsorbed on filters containing Carbon Black, versus PAH adsorbed on bare filters in the dark. Filters were extracted for analysis at times equal to 0 hour, .5 hour,
1 hour, and 3 hours after preparation. The filters were slurry coated using 250/il of Standard #1 solution syringe spike, total concentration of the PAH solution was
n.5ng/fil, 250^1 was applied per filter. The weight of carbon black applied to one set of the filters was 1.5mg, The mass percentage of PAH on the carbon black (CB)
particles was .33%. The HPLC instrument was used to analyze the extracted samples.
Table 4.3a
PAH Dark Reactivity on CB versus Filter
Compound Half-life (hrs), Half-life (hrs) on
on CB in TT filter in TT
Fl 10 stable
BaA 5.9 32
BkF 3 stable
39
Table 4.3b Table 4.3c
%PAK[ Remaining after 3 Hours Recovery of PAH from CB
Compound % on CB+Filter % on Filter ^
@3hr @3hr
Fl 76 103 106
BaA 69 95 51
BkF 50 98 "31
BaP 39 107
29 1
The results indicate that PAH coated on the filter are very stable, more stable than was
observed in the first experiment. Reactions are referred to as stable in Table 4.3 if half-lives were much longer than the experimental duration. The results indicate that
PAH have significantly shorter half-life in the dark when CB is present, but the data are more variable. Initial concentrations of PAH were much higher on the filter without CB. Recovery is the amount of PAH extracted from the carbon black divided by the amount placed on the carbon black. Even though thimbles were used in the soxhlet extractor the recovery of PAH from carbon black was low. This led to an extraction
method improvement of using glass wool above and below the filter in the thimbles.
October 20, 1991
The purpose of this experiment was to measure the PAH photodegradation rates for PAH and hexadecane coated on carbon black versus coated on filters. The goal was to determine the effect of carbon black surface on the photodegradation rate of PAH. Filters were removed for extraction and analysis at .5 hour intervals for CB, Ihr intervals for hexadecane samples, with the total exposure of 3 hours for the last pair of filters. The PAH were slurry coated on the filters using a syringe to apply 250^x1 of
mass of carbon black applied to one set of filters was l.Omg on each filter. The mass percentage of PAH adsorbed on the carbon black was 7.8%. The HPLC instrument was used to analyze the extracted samples. Results are presented in Table 4.4.
Table 4.4a
PAH Photolysis Rates on Carbon Black Versus Zefluor Filter
Compound Half-life(hr) on CB
+Hexadecane+Zefluor
r2 Half-life - on Hexadecane + Zefluor
Fl
BaA BkF
BaP
.86 .66 1.3 .81
.93 .92 .97 .96
<.5 <.5 <.5
<.5 1
Table 4.4b
% PAH Remaining After Exposure to UV Light
Compound % remaining % remaining % remaining % remaining
onCB + on Zefluor onCB + on Zefluor
Zefluor @lhr Zefluor @3hr
@lhr @3hr
Fl 45 19 18 5.5
BaA 26 3.4 14 5.6
BkF 64 8.6 28 8.0
BaP 41 4.5 19
7.0 1
PAH initially degrade quickly upon exposure, and then appear stable under continued
exposure to light. PAH in hexadecane on the filter has a faster initial rate and
41
filters. More data are needed for PAH reactivity on hexadecane + filter at earlier times to calculate their half-lives. The presence of carbon black caused a decrease in
the photoreactivity of PAH. PAHs photodegrade quickly on the filter. The observed photodegradation rate for PAH on Zefluor filters was faster than that previously
observed for PAH on Pallflex filters.
November 2, 1991
The purpose of this experiment was to evaluate PAH Photodegradation on
CB+Pallflex filter, CB+Zefluor filter to determine if PAH reactivity on carbon black is influenced by the filter media. Filters were analyzed at 0.5 hr intervals for a total duration of 2.5 hours for both systems. The PAH were slurry coated on to the filter,
using a syringe to apply 250/il of Standard #1 solution to each filter. The concentration
of PAH in solution was 184ng//il. The weight of carbon black applied to each filter was 1.0 mg. The mass percentage of PAH on CB on Pallflex filters was 4.6%. The initial unexposed filter (t=0) was lost for the set with PAH adsorbed to carbon black on the Zelfuor filter. HPLC was used to analyze the extracted samples. Results are
given in Table 4.5.
Table 4.5a
PAHPlotolysis Rates when Acsorbed on CB on Different Filters
Compound Half-life(hrs)
CB + Pallflex
R2 Half-life(hrs)
CB + Zefluor
r2
Fl 12 .41 1.8 .90
BaA 2.3 .90 1.8 .86
BkF 1.7 .94 2.1 .98
Table 4.5b
%PAH
Remaining after Exposure to UV light |
1 Compound % remaining on CB % remaining on CB
+ Pallflex @1.5hr + Zefluor @1.5hr.
using t=.5 as t=0 usingt=.5 as t=0
1 Fl 96 53
BaA 69 52
BkF 7S 72
1 BaP 42
47 1
Fl and BaA have longer half-lives on carbon black -I- Pallflex filters than carbon black
+ Zefluor filters, indicating that there is an effect on PAH reactivity due to the type of
filter material used. The BaP and BkF half-lives observed on Zefluor and Pallflex
filters with carbon black are similar. BkF and BaP may be preferentially adsorbed by
the carbon black and not present as much on the filter surface. Thus, there is no effect
due to using different filter surfaces to support carbon black particles for BkF and BaP
adsorption. The concentration of PAH in hexadecane in this experiment is the same for
the Oct 20, 1991 experiment. PAH half-lives when coated on carbon black on Zefluor
filters are similar for the two experiments of Oct 20, and Nov 2, indicating
reproducibility of the measurement.
4.C Third Phase
November 28, 1991
In this and subsequent experiments Zefluor Teflon membrane filters were used instead
of Pallflex quartz fiber filters to support the coated carbon black. The purpose of this
43
Isoeugenol on CB and Zelfuor filters. Exposed filter samples were removed for
extraction and analysis at 0.25hr intervals for a total exposure duration of 1 hour.
The goal was to adsorb organic compounds onto the carbon black particle to achieve
particle composition similar to atmospheric combustion particles. The composition was
targeted to be 50% elemental carbon, 45% organic carbon, 1% PAH, and 4%
Isoeugenol. Carbon black was used to represent elemental carbon. Hexadecane was
used to represent organic carbon. The organic compounds were slurry coated on to the
carbon black which was supported by a filter. A syringe was used to transfer 50^1 of
Standard #1 solution. The PAH concentration in the solution was 125ng//il. The
weight of carbon black used per filter was .8mg. The mass percentage of PAH
adsorbed on the carbon black was 0.79%. The half-lives were calculated by
performing a regression out to .75 hour, as the concentration of PAH remained stable
between the 0.75 hour and 1 hour filter samples. HPLC was used to analyze the
extracted samples. Results are given in Table 4.6.
Table 4.6a
PAH Photolysis Rates when Adsorbed on CB with and without Isoeugenol |
Compound HaIf-life(hour) R2 Half-life(hour)
(w/ isoeugenol)
r2
BaA
BkF BaP
0.35
0.21
0.5
0.23
0.93 0.87
0.63
0.9
0.29
0.27
0.31
0.31
0.85 0.76
0.96
Table 4.6b
% PAH Remaining on Carbon Black after Exposure |
Compound % Remain® % Remain % Remain® %Remain
.25hr @.25hr w/
isoeugenol
Ihr @lhr w/
isoeugenol
Fl 61 25 19 5
BaA 22 22 17 5
m^ 57 42 43 12
\ BaP
27 24 225 1
There was an observed difference in PAH reactivity due to isoeugenol for Fl, both the
magnitude and shape of the photodegradation curve changes. No difference is observed
between the photodegradation rates for BkF with isoeugenol and without isoeugenol.
The photodegradation rates for BaA and BaP could not be determined because they are
too reactive and mostly degraded within 15 min.
The question of why the degradation rates were faster than those observed in the
Oct 20 experiment needs to be addressed. The PAH concentration may be 1.6 times
that of Oct 20 and Nov 2. The change in photodegradation rate might be due to the use
of less CB and more PAH. In previous experiments with slight differences in PAH and
particle concentrations large differences in the photodegradation rates are not observed.
It was determined subsequent to this experiment that the water immersion well
may have been unknowingly changed prior to this experiment. A quartz well was
unknowlingly used as a replacement after an accidental breakage of the borosilicate
immersion well. The increase in PAH photodegratation rates could then be attributed
to a reduced filtration of the light emmitted from the mercury lamp caused by using a
45
Another factor which may inhibit an observable difference in photodegradation
rates due to isoeugenol is the distribution of PAH and isoeugenol between the carbon
black and filter surfaces. PAH may be preferentially adsorbed to the carbon black
surface, while isoeugenol may adsorb equally to the filter and carbon black surfaces.
On the basis of this experiment it was concluded that an improved technique of
applying the organic constituents to the carbon black surface was needed. This
technique should ensure that the organic constituents are adsorbed to the particle
surface and not to the filter.
4.D Fourth Phase Jan 8, 1992
Development of a technique to adsorb organic constituents from a liquid phase onto
carbon black particles was the goal of this experiment. The adsorptive ability of the
carbon black was measured by determining the sorbate concentration on carbon black
after coated particles were suspended into solvent, dispersed, and deposited on filter
relative to the concentration in the original coating. Dependence of this recovery
measurement on different methods of transferring the coated carbon black particles to
the liquid phase in the Biichner funnel was also measured. Three transfer methods are
compared in Table 4.7, These are referred to as the "spatula method", the "sonication
method" and the "reference method". All three are described in detail in Section 3A.
Dichloromethane was used as the dispersion liquid. The weight of the carbon black
Table 4.7
Recovery using methods of Transferring Coated Carbon Black Particles from
beaker toliquid in Biichner Funnel
Compound % Recovery % Recovery % Recovery % Recovery
Sonication Sonication Spatula- Reference
Scraped Method
Isoeugenol 0 0.02 1 0.3
Fl 1.8 1.7 2.7 5.7
BaA 7.6 7.5 9.1 12.8
BkF 21.8 23 26 26
1 BaP 22.3 23 27
27 1
Recoveries were poor but consistent. The recovery of PAH on the carbon black is
greater for the higher molecular weight compounds, indicating stronger adsorption of
BkF and BaP to the carbon black surface.
Jan 18, 1992
The purpose of this experiment was to measure the recovery of PAH on the carbon
black as a function of the solvent chosen to disperse the coated carbon black. The PAH
solubility in pentane is lower than PAH solubility in dichloromethane, therefore
adsorption onto the carbon black surface should be greater in pentane. The recovery of
PAH due to adsorption of PAH on the filter with no carbon black present was also
measured. The technique for tiansferring the coated particles was to use a spatula to
transfer the majority of the particles, then to sonicate and transfer any remaining
particles from the walls of the glass beaker. HPLC was used to perform analysis of the
47
Table 4.8
Recovery of PAH on Carbon Black using different solvents for the Liquid
Dispersion Phase |
Compound
%Rec. on
CB in MeCb
%Rec on CB in Pentane
% Rec in
MeCb
% Rec in Pentane Isoeugenol m BaA BkF BaP .04 3.4 8.9 16 21 .57 5.4 24 49 54 0 0 .45 .54 .55 0 0 .34 .50
.53 1
Pentane is a better dispersion liquid for PAH than dichloromethane (MeCl2). The
observed recovery for PAH dispersed with no carbon black to adsorb is less than 1 %
indicating that little adsorption on the filter occurs. The observed recovery for PAH when adsorbed on carbon black is much higher, indicating that most of the PAH remains adsorbed on the carbon black. On further study it was observed that pentane
was a poor solvent for dissolution of isoeugenol at concentrations typically used in
these experiments.
Jan 26, 1992
The purpose of this experiment was to determine whether the coating technique was
improved if carbon black and organics were seperately placed in the Buchner funnel
using the "no transfer method" of Section 3A. It was hypothesized that this would
obviate the step of transferring particles from the beaker where the organics were
coated to the liquid phase in the Buchner funnel. The proposed ratio of constituents
mass of carbon black used for this experiment was 1.5 mg. HPLC was used to perform analysis of the extracted filter samples. Results are given in Table 4.9.
Table 4.9
% Recovery for Coating in a Vial + Transferring or
Adsorbing PAH in Liquid Phase |
Compound % Recovered % Recovered
no transfer BFT
Isoeugenol .21 .16
Fl .83 .80
BaA 3.5 5.5
BkF 27 21
BaP 24
20 1
70-80% of the carbon black particles were transferred successfully when the technique of coating the particles in a vial then transferring them to the Biichner funnel was used. Only 50-70% of the carbon black particles were transferred successfully when carbon
black was transferred dry to the Biichner funnel.
Feb. 1, 1992
The purpose of this experiment was to determine the reproducibility in PAH
concentration observed on the coated particles using the BFT described in Section 3A,
and to determine if filters were adsorbing PAH from the liquid phase. Six identical