Sharif University of Technology
Scientia IranicaTransactions E: Industrial Engineering http://scientiairanica.sharif.edu
An optimization framework for risk response actions
selection using hybrid ACO and FTOPSIS
Sh. Shoar
a;and A. Nazari
ba. Department of Project & Construction Management, Mehralborz Institute of Higher Education, No. 109, Shokrollah Street, Jalal-e Al-e Ahmad Crossroad, North Kargar Avenue, Tehran, Iran.
b. Department of Construction, Faculty of Architecture and Urban Design, Shahid Beheshti University, Tehran, Iran. Received 27 July 2016; received in revised form 28 October 2017; accepted 5 March 2018
KEYWORDS Project risk management; Risk response action selection;
ACO;
Risk interactions; FTOPSIS; Fuzzy set theory.
Abstract. This paper presents a framework for solving a risk response action selection problem by considering: 1) the impact of risk events on the project objectives, 2) the interactions between risk events, 3) management criteria and preferences. To fulll these purposes, a framework is developed by combining an optimization-based model with a Multi-Criteria Decision Making (MCDM) approach. First, in the optimization-based model, Ant Colony Optimization (ACO) is used to nd the best combination of response actions with greater eects on time, cost, and quality. In addition, in this model, to overcome the imprecision situation resulting from lack of knowledge or insucient data, risk parameters are determined using the fuzzy set theory. Moreover, the Design Structure Matrix (DSM) is used to capture the eect of interactions between risk events. Second, the Fuzzy Technique for Order Preference by Similarity to Ideal Solution (FTOPSIS) method is used to analyze the obtained solutions by ACO based on other management criteria. Finally, the eciency of the proposed framework is examined by its implementation in a real building construction project. Discussions concerning the case study show that decision-makers can evaluate more aspects of response actions by using the proposed framework. © 2019 Sharif University of Technology. All rights reserved.
1. Introduction
Risk is a complex phenomenon that has physical, mon-etary, cultural, and social dimensions [1]. Project Man-agement Institute (PMI) dened risk as an uncertain event or condition that, in case it occurs, has a positive or negative eect on one or more project objectives such as scope, schedule, cost, and quality [2]. The construc-tion industry is subjected to more risk and uncertainty than perhaps any other industrial sector [3]. As a
*. Corresponding author. Fax: +98 21 22531864
E-mail addresses: [email protected] (Sh. Shoar); a [email protected] (A. Nazari)
doi: 10.24200/sci.2018.20225
result, in the construction industry, we can see many projects around the world that were completed with considerable time and cost overruns [4]. Therefore, risk management in construction projects has been recognized as an inherent and strictly recommended process in order to achieve project objectives [5,6]. Risk management consists of risk management planning, risk identication, qualitative risk analysis, quantita-tive risk analysis, risk response planning, and risk monitoring and control processes [2]. Among these processes, despite the signicance of the risk response planning in minimizing the probability and/or negative impact of project risks, it has rarely been addressed in the studies relating to risk management [7]. However, for reducing global risk exposure, appropriate response actions should be selected. Accordingly, a few specic
tools and systematic solutions were developed in the area of risk response selection [7]. Regardless of the response selection approach, factors including total expected risk loss, risk interactions, budget constraints, response costs, response eects, and uncertainty in the risk parameters should be considered within the risk response planning process. Ignoring each one of these items can cause an inappropriate selection of response actions and the waste of human and nancial resources. Based on the conducted previous researches, the main approaches for generating risk response actions can be classied into ve categories as follows: the zonal-based approach [8,9], the trade-o approach [10,11], the Work Breakdown Structure (WBS)-based approach [7,12], the optimization-model approach [13], and the Case-Based Reasoning (CBR) approach [14].
Neither of the mentioned approaches is complete, and they are subject to some limitations. For example, only two criteria can be considered in the zonal-based and trade-o approaches [15], and some required in-formation, such as the individual risks, involved in the target case may not exist in the surveyed cases in the CBR approach [14]. In the WBS-based approach, risks are identied for an analyzed activity; then, strategies can be formulated in direct association with the corre-sponding activity or can be selected among candidate ones by an index of the scope expected deviation [7]. However, there is not any way to make sure that the selected strategies on the basis of this approach are the optimal solutions. In the optimization-model ap-proach, by constructing a mathematical model whose variables are project objectives such as time, cost, or quality, the optimal risk response actions can be cho-sen. Generally, in this model, the objective function is to minimize the cost of implementing actions. Despite other mentioned methods, the optimization model ap-proach has shown its practicability in previous studies for evaluating and selecting risk response actions to achieve the project objectives [15]. For example, Kayis et al. (2007) developed ve computational algorithms including least-cost-rst, highest-risk-rst, minimum-cost-risk-ratio-rst, random-search, and a genetic algo-rithm to nd feasible solutions for mitigating risks [16]. Fan et al. (2008) developed a conceptual model to describe the quantitative relationships among risk re-sponse strategies and project characteristics. The optimization analysis was then performed to derive a minimum-cost risk-handling strategy for a particular risk event [13]. Ben-David and Raz (2001) presented a model that integrated work contents of projects, risk events, risk reduction actions, and their eects. Then, the optimization techniques were used to solve the model in order to generate the most cost-eective combinations of risk reduction actions [17]. Zhang and Fan (2014) developed an optimization model, which integrated three critical elements: the project cost,
project schedule, and project quality. By solving the model, the most desirable risk response strategies to cope with the risk events could be determined [15]. Nik et al. (2011) proposed an optimization model that integrated the project work breakdown structure, risk events, risk responses, and their eects on the project's time, cost, and quality. The eects on these three objectives were changed into a single one by assigning a weight factor to each objective [18]. Fang et al. (2013) developed a quantitative framework of analysis to sup-port decision-making in project risk response planning. They used the design structure matrix representation to capture risk interactions and, also, used a genetic algorithm for choosing response actions and allocating budget reserves [19]. Soofard and Khakzar Bafruei (2016) proposed a mathematical model, in which work structure breakdown, risk occurrences, risk reduction measures, and their eects were clearly related to each other to evaluate and select the project risk responses. They also considered the relationship between risk responses during model implementation [20]. Soofard and Gharib (2017) proposed a model for proper risk response selection from the responses portfolio with the aim of optimizing dened criteria for projects. They also considered the relationships between risk responses, especially relationships between risks [21]. Zhang (2016) constructed an optimization model for selecting risk response strategies considering the ex-pected risk loss, risk interdependence, and its two direc-tions. Further, the eects of the risk interdependence on risk response were also investigated [22].
However, despite these numerous research eorts, there are some deciencies in the previous researches in this eld that are presented as follows:
1. In most of the previous researches includ-ing [13,17,15,18,20,22], the integer programminclud-ing model was used to determine the optimum project risk response actions. However, it is so hard to nd the exact solution in a reasonable amount of time with the number of variables or increasing constraints. Therefore, for the large-sized problem, some techniques and heuristic algorithms need to be developed [15];
2. In all of the previous researches except [19,21,22], the interactions between risk events were not taken into account for selecting risk response actions. However, engineering projects are becoming com-plex in both structure and context due to the involvement of many interrelated elements [23]. This situation makes it necessary to consider the interrelated structures among the risks and how the risks can have an impact on each other [24], particularly when estimating the eectiveness of risk response actions;
impacts of the risk response actions were considered only on time, cost, and quality. However, mostly, it is also necessary to take into account other project objectives and management preferences (such as stakeholders' satisfaction), some project features (such as its technical complexity), and some project success factors (such as executive support) to evaluate the risk response action sets. Previous studies discussed the applications of various risk response strategies, yet oered scant guidelines for choosing a strategy that matches the characteristics of projects and risks [13]. In other words, it is not clear how management should align risk response strategies with unique risk situations and project characteristics;
4. In all of the previous researches, the exact values of the probability and/or impact of the risk events were used to estimate the eects of the risk response planning. However, because of the unique nature of projects, having sucient data to derive exact values for the probability or impact of the risk events is often dicult in the construction industry. Since output depends on the reliability of the input data in optimization-model approaches, the gap between the proposed solution and its neighbors should be analyzed [19]. Therefore, it is necessary to utilize the fuzzy set theory to evaluate the eectiveness of the risk response actions.
Considering the above explanation, in order to ll the existing gap and solve the mentioned problems, this paper presents a framework comprised of an optimization-based model and an MCDM approach to select the most eective risk response actions on project objectives. To overcome the imprecision resulting from lack of knowledge or insucient data, the fuzzy set theory is used for determining risk parameters (refer to the fourth mentioned deciency). The response actions that are selected for mitigating the exposure of some risks may aect other risks. Therefore, the DSM method is also used to capture the eect of interactions between risk events when selecting response actions (re-fer to the second mentioned deciency). The proposed model is solved using ACO to nd the best combination of response actions with higher eects on the project's time, cost, and quality (refer to the rst mentioned deciency). For evaluating the obtained response set alternatives by ACO, based on the other criteria, the FTOPSIS method is used (refer to the third mentioned deciency).
The eciency of the proposed framework is demonstrated by implementing it in a real building construction project. The computation results and discussions concerning a case study show that decision-makers can evaluate more aspects of obtained results by an optimization-based model using the proposed
framework. Furthermore, by considering interactions between risk events and uncertainty in the risk param-eters, further data for decision-making can be achieved. The remainder of this paper is organized as follows. Section 2 describes the research methodology including the proposed framework and the fundamental concepts of ACO and FTOPSIS. The parameters of the optimization-based model for selecting risk response actions and minimizing the cost of implementation of them using ACO are also given in this section. In Section 3, the proposed framework is utilized for selecting risk response actions through surveying a real building construction project. The outcome results are also presented in this section. Finally, we conclude this paper in Section 4.
2. Research methodology
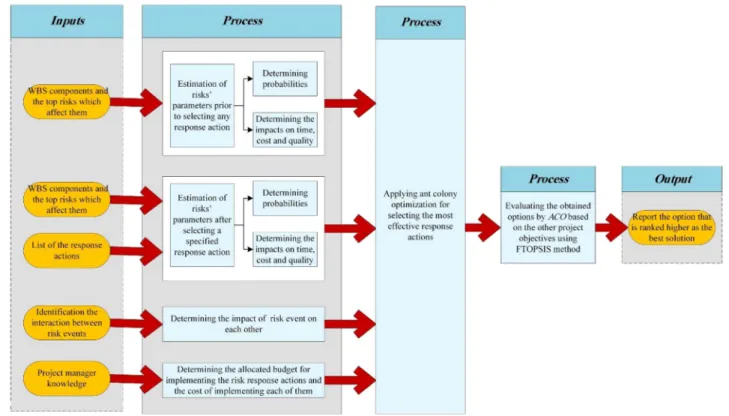
In this section, the fundamental concepts of ACO and FTOPSIS as components of the proposed framework are described. The owchart diagram of the dierent steps of the proposed framework is depicted in Figure 1. As shown in Figure 1, the components of the WBS and the top risk events that aect them are determined in the rst step. The risk parameters including probability and impact on time, cost, and quality for each risk after and before applying response actions are determined in the second step. In the third step, the interactions between risk events and the eect of each risk on other risks are determined using the DSM method. The constraints of the model including the maximum allocated budget for implementing the response actions and also the list of proper response actions which can be selected; in addition, their costs are determined in the fourth step. By using the data obtained from the previous steps, the ACO is applied in the fth step. In the sixth step, the FTOPSIS method is used to evaluate the response sets obtained by ACO based on the other criteria. Finally, the solution that ranked higher in the evaluation process is reported as the best solution.
2.1. Ant Colony Optimization (ACO)
ACO is one of the swarm intelligence algorithms based on the behavior of ants that cooperate through self-organization without any central control to nd an optimal path between their colony and a source of food [25]. They communicate with each other by means of a chemical substance called Pheromone, which is deposited on their trail [26]. The pheromone will evaporate over time. Thus, when an ant starts to nd a food source, it is likely not to keep traveling at random. It selects a trail with high pheromone density. The highest pheromone density on a trail shows that more ants select this trail to nd food. The pheromone density becomes higher on shorter paths
Figure 1. The owchart diagrams of dierent steps of the proposed framework.
over time, because the duration of traveling a shorter path is less than longer paths. Thus, when one ant nds a good path from the colony to a food source, other trails with little pheromone will eventually be abandoned; nally, all the ants will converge to the same trail [27]. In ACO algorithms, an individual ant constructs candidate solutions to a combinatorial optimization problem by starting with an empty solu-tion and, then, iteratively adding solusolu-tion components until a complete candidate solution is generated [26]. The ants make use of the information that reects the experience accumulated by previous ants, called pheromone information, and of problem-dependent information, called heuristic information, in order to decide which solution component to add to its current partial solution by means of a stochastic construction policy [28]. Dorigo postulated that the rst ACO algorithm is the ant system [29]. The ant system has inspired a number of further extensions that aim to improve the performance of the basic ACO algorithms in problem-solving. These extensions include the Ant Colony System (ACS), elitist ant system, maximum-minimum (max-min) ant system, rank-based version of that ant system, etc. The main dierence between the ant system and its extensions lies in the ways in which the pheromone is updated as well as some additional details in managing the pheromone trails. Generally, the ACO can be formulated as follows [30,31]:
Articial ants construct solutions from the sequence
of solution components taken from a nite set of N available solution components C = fcijg;
A solution construction starts with an empty partial solution Sp= ;
In each construction step, the current partial solu-tion Sp is extended by adding a feasible solution
component from the set N(Sp) C, which is dened
by the solution construction mechanism;
The choice of a solution component from N(Sp) is
done probabilistically in each construction step. The exact rules for the probabilistic choice of solution components vary across dierent variants of ACO:
p (CijjSp) =
ij (Cij)
P
Cil2N(Sp)il (Cil)
;
8 Cij 2 N(Sp); (1)
where ij is the pheromone value associated with
component Cij, and (Cij) is a weighting function
that assigns, in each construction step, a heuristic value to each feasible solution component Cij 2
N(Sp). In addition, and are positive
param-eters; their values determine the relation between pheromone information and heuristic information;
The next step is to update the pheromone, which is increasing the value of pheromone in a good solution and decreasing it in a bad one. This step is done based on Eq. (2):
ij
(
(1 )ij+ ; if ij 2 Sch
(1 )ij; Otherwise (2)
where is a positive value for increasing the value of pheromone in a good solution. 2 [0; 1) is the rate of pheromone evaporation that prevents the algorithm from converging rapidly. Sch is the set
of good solutions.
2.2. Fuzzy TOPSIS approach
MCDM methods are common approaches to structure information and decision evaluation in various prob-lems with multiple and conicting goals [32]. A fuzzy TOPSIS technique is extended to solve the MCDM problem under a fuzzy environment in a systematic process. TOPSIS oers the point as the solution, that is, simultaneously, the farthest distance from the negative ideal and the nearest distance to the positive ideal [33]. The TOPSIS method is considered as a major MCDM technique in comparison with other related techniques because [33]:
It can include an unrestricted range of criteria and performance attributes;
Changes in one attribute can be neutralized by other attributes in a direct or indirect manner;
It not only provides us with the preferential ranking of alternatives, but also calculates a numerical value for each alternative for a better understanding of the dierences and similarities between alternatives, while other techniques only determine the rank of alternatives;
It provides us with a systematic procedure stream-lined with a relatively simple computation process. For these reasons, in this study, in order to rank the obtained risk response actions sets from ACO and determine a compromise solution for the decision-making problem with conicting criteria, the TOPSIS approach is utilized. The fuzzy TOPSIS procedure consists of the following steps [34]:
Step 1: Inputs are expressed in the decision matrix format as follows:
D =
C1 C2 C3 Cn
A1
... Am
2 6 4
y11
... ym1
y12
ym2
y13
... ym3
y1n
... ymn
3 7 5;
i = 1; 2; ; m; j = 1; 2; ; n; (3) W = [w1; w2; w3j; ; wn] ; (4)
where yij is the rating of alternative Ai with respect
to criterion Cj, and Wjis the importance weight with
respect to Cj;
Step 2: Calculate the normalized fuzzy decision matrix, R:
R=[rij]mn i=1; 2; 3; ; m; j =1; 2; 3; ; n:
(5) For the benet criterion, normalized value rij is
calculated as follows:
rij = ulij+ j ;
mij
u+ j ;
uij
u+ j
!
; (6)
where: u+
j = maxi uij:
Similarly, normalized value rij for cost criterion is
calculated as follows:
rij = ulj ij;
lj mij;
lj lij
!
; (7)
where: lj = min
i lij;
where l, m, and u are the parameters of a triangular membership function;
Step 3: Calculate the weighted normalized fuzzy decision matrix, V ;
V =[Vij]mn i=1; 2; 3; ; m; j =1; 2; 3; ; n:
(8) Considering dierent weights of each criterion, the weighted normalized decision matrix can be com-puted by multiplying the importance weights of the evaluation criteria and the values in the normalized fuzzy decision matrix. The weighted normalized fuzzy value, Vij, is calculated as follows:
vij = rij wj; i = 1; 2; 3; ; m;
j = 1; 2; 3; ; n; (9) where wj is the fuzzy weight of the jth criterion;
Step 4: Identify the Fuzzy Positive Ideal Solution (FPIS) and Fuzzy Negative Ideal Solution (FNIS):
A+=v+
1; v+2; ; v+n ;
A =v1; v2; ; vn ; (10) where v+
j = (1; 1; 1) and vj = (0; 0; 0), j =
1; 2; 3; ; n;
to FPIS and FNIS using: d+ i = n X j=1
d vij; vj+
; i = 1; 2; 3; ; m;
j = 1; 2; 3; ; n;
di =
n
X
j=1
d vij; vj
; i = 1; 2; 3; ; m;
j = 1; 2; 3; ; n; (11) where d(va:vb) denotes the distance measurement
between two fuzzy numbers;
Step 6: Calculate the relative closeness to the ideal solution. The relative closeness of alternative Ai is
calculated as follows:
CCi= d + i
d+
i + di ; i = 1; 2; 3; ; m; (12)
where 0 CCi 1, that is, alternative i is closer
to the fuzzy positive ideal reference point and far from the fuzzy negative ideal reference point as CCi
approaches 1 [35];
Step 7: Rank the preference order. Choose an alternative with maximum CCi or rank alternatives
according to CCi in descending order.
It is worth mentioning that this approach has many applications in engineering and management elds and has a simple computation process and high exibility [36].
2.3. Constructing the optimization model To optimize the selection of risk response actions, ACO is used to maximize the positive eects of the selected risk response actions on project objectives including time, cost, and quality. For considering the interactions between the risk events, the DSM method is also used. The DSM was introduced by Steward in 1981 [37], and it provides a simple and visual way to perform both the analysis and the management of complex systems, especially to represent the interrelated structure of system elements. The DSM is a square matrix. In our case, the risk events are placed in the rst row and the rst column in the same order. Diagonal cells of the DSM are blacked out because reexive relation is ignored, and o-diagonal cells indicate the interactions between risk events. The marks in the DSM below the diagonal indicate feed-forward information, while the marks above the diagonal are feedback informa-tion [38]. In the probability assessment, a spontaneous probability can be interpreted as the likelihood of a risk whose eect is dierent from those of other activated risks inside the system. On the other hand,
the transition probability measures the likelihood of a direct cause-eect relationship between two risks [19].
Therefore, according to Fang et al. (2013), the global probability of each risk event (P ) can be deter-mined using Eq. (13) [19]:
P = D:s; D = (I T ) 1; (13)
where T is the risk transition probability matrix which is constructed using DSM, S is the spontaneous proba-bilities, I is the identied matrix, and P represents the new values of the risk probabilities.
The impact of the risks on the project's time, cost, and quality prior to selecting any risk response actions can be calculated as follows. In order to relate the risk response action selection to work packages of the project, the WBS is used.
ET L =
n X i=1 m X j=1 l X k=1 wtime
i xij PkIktimeDjk; (14)
ECL =Xn
i=1 m X j=1 l X k=1 wcost
i xij PkIkcostDjk; (15)
EQL =Xn
i=1 m X j=1 l X k=1
wqualityi xij
PkIkqualityDjk
; (16) where ET L, ECL, and EQL are the expected time loss, expected cost loss, and expected quality loss, respectively. In addition, wi represents the
time/cost/quality weight factor of the ith work pack-age. As mentioned by Seyedhoseini et al. (2009), each work activity in the WBS has its own scope, similar to that of the project, which can be split into three key aspects: quality, schedule, and cost [7]. For example, wcost
i can be calculated by dividing the cost of the ith
work package by the total cost of the project. However, the quality of an activity can usually be measured subjectively by managers' judgment [7]. xij is a binary
variable. It is equal to 1 if the jth risk event inuences the ith work package. Otherwise, it is equal to 0. Ik
is the impact of the kth risk event on the project's time/cost/quality. Pk is the probability of the kth risk
event. Djk is the impact of the jth risk event on the
kth risk event which is obtained from the DSM method. The response action list may include dierent types of risk response actions in terms of avoidance, transference, mitigation, and acceptance [39]. Poten-tial response actions can be identied based on the historical data of similar cases and lessons learned. Risk response actions always consume time, money, and other resources and aect the changing values of the risk parameters such as probability or impact. The impact of the risks on the project's time, cost, and
quality after implementing risk response strategies can be calculated as follows:
ET LAR=Xn i=1 m X j=1 l X k=1 wtime i xij
PAR
k IkAR;timeDjk
; (17)
ECLAR=Xn i=1 m X j=1 l X k=1 wcost i xij
PAR
k IkAR;costDjk
; (18)
EQLAR=Xn i=1 m X j=1 l X k=1
wqualityi xij
PAR
k IkAR;qualityDjk
; (19)
where ET LAR, ECLAR, and EQLARare the expected
time loss, expected cost loss, and expected quality loss after implementing risk response strategies, respec-tively. IAR
k is the impact of the kth risk event on
the project's objectives, and PAR
k is the probability
of the kth risk event after implementing risk response strategies. In this study, the risk's parameters are determined using fuzzy membership functions.
Based on the dened parameters, the Objective Function (OF) of the ACO can be formulated as follows:
min OF = Wt
ET L ET LAR
ET L
+ Wc
ECL ECLAR
ECL
+ Wq
EQL EQLAR
EQL
; (20)
where Wt, Wc, Wq are the time, cost, and quality
weight factors that can be calculated subjectively by managers' judgment using the Analytic Hierarchy Process (AHP) method.
The cost of implementing the risk response plan should meet the budget requirements. Therefore, the following constraint should be considered in OF .
0
@R:C =Xm
j=1
Cj
1
A B; (21)
where Cj is the cost of the response strategy which is
selected for the jth risk event, and B is the maximum
allocated budget by managers for implementing the risk response plan.
The budget constraint in the OF (tness) of the optimization problem is investigated, aiming to maximize the value. Therefore, the OF is revised as follows:
Fitness f = OF Violation;
Violation = alpha max
R:C B 1; 0
; (22) where R:C is the total cost of response actions. Alpha is a variable more than \1000". Violation is a penalty value and signicantly increases if the response actions' costs exceed B and, thus, signicantly decrease f value. Therefore, exceeding the constraint is penalized by the decrease of the tness.
After generating the best response action sets by considering the numerical eects of the response actions on project's cost, time, and quality, the fuzzy TOPSIS method is used to evaluate the obtained solutions by ACO based on the other criteria.
3. Case study
To verify the validity of the proposed framework for risk response selection, it is implemented in a real building construction project. The project scope of this case should be determined rst; the project cost is $5.6 million, and the allocated budget by the project manager for implementing risk response actions is $225.000. This case is a commercial oce building and includes 12 oors on ground and 7 oors underground. The WBS of the entire project and critical risk events with respect to the identied work packages are shown in Figure 2.
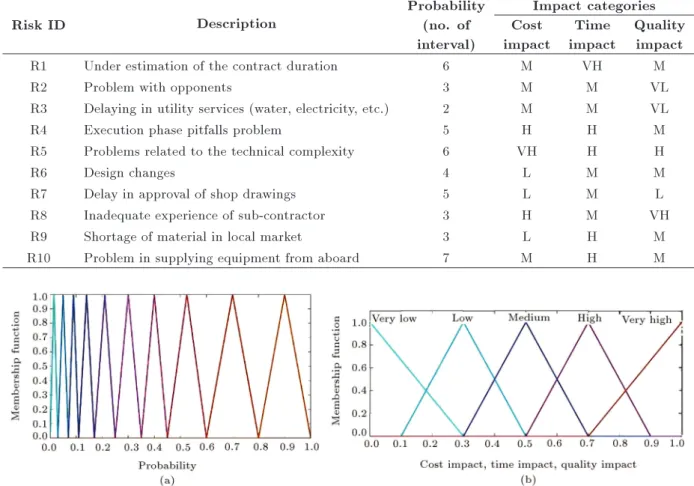
The critical risk events were identied by con-ducting a brainstorming session among a total of 34 identied risk events. By using the DSM method introduced in Section 2.3, the interactions between the top 10 risk events have been identied with the help of the project manager and the team of experts, including 5 risk owners. For this purpose, each expert is asked to show a level that reects the impact of the one risk on another risk. The scale of scores ranged from 0 to 4. Then, by using Eq. (13), the inuences of risks on each other are determined. The exposure of risks is assessed in terms of a qualitative scale of impact and probability. For this purpose, the project manager is asked to dene ve membership functions that aect time, cost, and quality according to the denition shown in Table 1. The direct method with one expert [40] was used to elicit the ranges of each membership function. To determine the probability of dierent risk events, the variations in the probability of risk events were divided into 10 fuzzy intervals. To achieve highly precise results
Figure 2. The WBS of the project.
and obtain a smaller probability span, this number of divisions were considered. More division depends on the extent of risk events' uncertainty and experts' opinions. Then, the experts were asked to choose the probability of risks events from one of the 10 given intervals, as shown in Figure 3. The exposure of the identied risks before and after implementing response actions is shown in Tables 2 and 3, respectively. The limitation of experts' knowledge and experiences may result in proposing dierent response actions by experts. Therefore, response actions are obtained by using the Delphi technique and are intended to reduce the risk probability or risk impact. The Delphi method is a forecasting method based on the results of ques-tionnaires sent to a group of experts. Several rounds
of questionnaires are sent out, and the anonymous responses are aggregated and shared with the group after each round. The experts are allowed to adjust their answers in subsequent rounds. Since multiple rounds of questions are asked and the panel is told what the group thinks as a whole, the Delphi method seeks to reach the correct response through a consensus [41]. In order to determine Wc, Wt, and Wqparameters
of Eq. (20), AHP method was used. The AHP was rst established by Saaty [42] to aid decision-making for problems that involve multiple criteria. The AHP method is generally implemented in four following stages [43]:
con-Table 1. Linguistic denition of impact.
Terms Impact categories
Cost Time Quality
Very High (VH) >15% cost increase >15% project duration increase Project end item is eectively useless
High (H) 10-15% cost increase 10-15% project duration increase Quality is unacceptable to a project sponsor
Medium (M) 5-10% cost increase 5-10% project duration increase A major area of quality is aected
Low (L) <5% cost increase <5% project duration increase Few areas of quality is aected Very Low (VL) Insignicant cost increase Insignicant project duration increase Quality degradation barely
noticeable Table 2. Exposure of the critical risks before implementing response actions.
Risk ID Description
Probability (no. of interval)
Impact categories Cost
impact
Time impact
Quality impact
R1 Under estimation of the contract duration 6 M VH M
R2 Problem with opponents 3 M M VL
R3 Delaying in utility services (water, electricity, etc.) 2 M M VL
R4 Execution phase pitfalls problem 5 H H M
R5 Problems related to the technical complexity 6 VH H H
R6 Design changes 4 L M M
R7 Delay in approval of shop drawings 5 L M L
R8 Inadequate experience of sub-contractor 3 H M VH
R9 Shortage of material in local market 3 L H M
R10 Problem in supplying equipment from aboard 7 M H M
Figure 3. Membership functions for: (a) Probability and (b) time, cost, and quality impact.
struction of a hierarchical model of criteria and de-cision variants aecting the solution of the problem;
Pairwise comparison of the criteria and generation of the vector of weights for individual criteria;
Pairwise comparison of decision variants in relation
to individual criteria and generation of the local weight vectors for those variants in relation to those criteria;
Determination of the vector of global preferences of decision variants arranged in relation to the
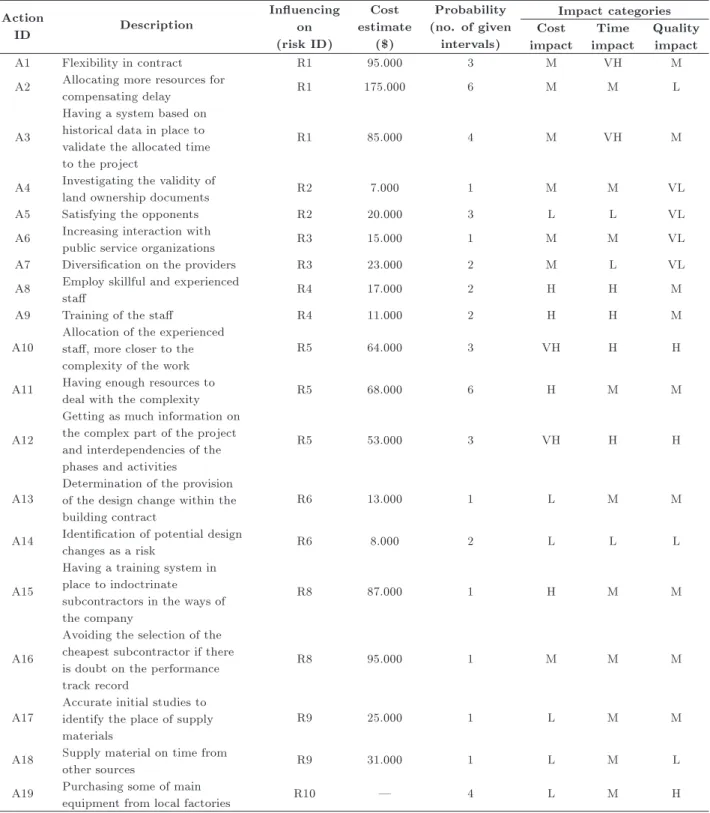
Table 3. Exposure of the critical risks after implementing response actions.
Action
ID Description
Inuencing on (risk ID)
Cost estimate
($)
Probability (no. of given
intervals)
Impact categories Cost
impact
Time impact
Quality impact
A1 Flexibility in contract R1 95.000 3 M VH M
A2 Allocating more resources for
compensating delay R1 175.000 6 M M L
A3
Having a system based on historical data in place to validate the allocated time to the project
R1 85.000 4 M VH M
A4 Investigating the validity of
land ownership documents R2 7.000 1 M M VL
A5 Satisfying the opponents R2 20.000 3 L L VL
A6 Increasing interaction with
public service organizations R3 15.000 1 M M VL
A7 Diversication on the providers R3 23.000 2 M L VL
A8 Employ skillful and experienced
sta R4 17.000 2 H H M
A9 Training of the sta R4 11.000 2 H H M
A10 Allocation of the experiencedsta, more closer to the complexity of the work
R5 64.000 3 VH H H
A11 Having enough resources to
deal with the complexity R5 68.000 6 H M M
A12
Getting as much information on the complex part of the project and interdependencies of the phases and activities
R5 53.000 3 VH H H
A13 Determination of the provisionof the design change within the building contract
R6 13.000 1 L M M
A14 Identication of potential design
changes as a risk R6 8.000 2 L L L
A15
Having a training system in place to indoctrinate subcontractors in the ways of the company
R8 87.000 1 H M M
A16
Avoiding the selection of the cheapest subcontractor if there is doubt on the performance track record
R8 95.000 1 M M M
A17 Accurate initial studies toidentify the place of supply materials
R9 25.000 1 L M M
A18 Supply material on time from
other sources R9 31.000 1 L M L
A19 Purchasing some of main
equipment from local factories R10 | 4 L M H
contribution of variants in achieving the objective of the ultimate decision problem.
According to the AHP results, the mentioned parame-ters are calculated, as shown in Eq. (23):
Wt= 0:46; Wc= 0:40; Wq = 0:14: (23)
3.1. Computational results 3.1.1. ACO results
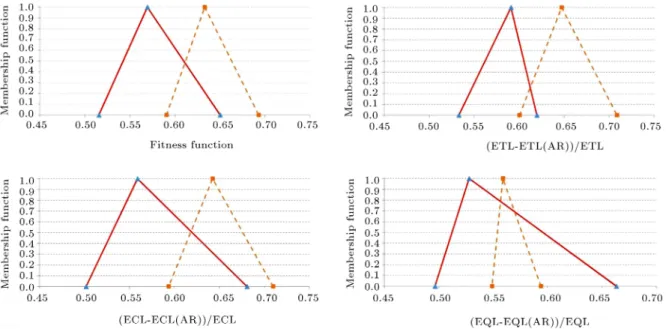
The proposed ACO for the risk response action selec-tion is performed for the minimum, most likely, and maximum values of risk parameters, separately. The obtained results are shown in Figure 4. The parameters of the proposed ACO are determined through experi-ence and testing. The number of ants in each iteration
Figure 4. The tness parameters results of the minimum, most likely, and maximum values of risk parameters. Table 4. Fuzzy-decision matrix of alternatives and deterministic weights of each criterion.
Alternatives (optimal selected response actions)
Fitness function Weight = 56%
Executive support Weight = 14%
Stakeholders' satisfaction Weight = 18%
Technical complexity Weight = 12% DM1 DM2 DM3 DM1 DM2 DM3 DM1 DM2 DM3
[A1,A4,A9,A12,A13,A18,A19] (0.5131,0.56710.6471) M M M H H M M M M
[A4,A6,A8,A10,A13,A18,A19] (0.4587,0.50160.5733) H H M H VH VH L L L [A1,A4,A6,A9,A12,A13,A18,A19] (0.5154,0.5693,0.6502) M H M H H H M L L [A1,A4,A6,A8,A12,A13,A17,A19] (0.5126,0.5669, 0.6494) M M H H H H L L M
is set to 10. The Roulette Wheel method is used for selecting the next node (response action in this study) by an ant in its tour. Roulette Wheel is a selection method in which a proportion of the wheel is assigned to each of the possible selections based on their tness value. Then, a random selection is made similar to how the roulette wheel rotates. The termination condition is set as the maximum number of 300 iterations. The value of alpha is set to 0.05 and the value of to 0.05 by testing. The optimal selected response actions obtained by performing the ACO are shown in Table 4. The best tness value for the minimum, most likely, and maximum values of risk parameters is equal to (0.5154, 0.5693, and 0.6502), as shown in Figure 4. The optimal total cost of implementing the action plan is $225,000. The application of the proposed method shows some promising results as OF reduces by 56.93%, expected time loss by 59.07%, expected cost loss by 55.91%, and expected quality loss by 52.79%. Therefore, the impact of response actions on time, cost, and quality can be analyzed simultaneously. It is worth mentioning that, unlike previous researches, these results have been achieved with regard to the
interaction between risk events. The obtained results without considering the risk interactions are also shown in Figure 4 with a dashed line. Further research should be done to investigate the sensitivity of the optimal response action set and OF value to these interactions. Moreover, unlike previous approaches, since the results are obtained in a fuzzy environment, further analysis using possibility and necessity measures, which are widely used in fuzzy literature, can also be carried out to provide valuable data for decision-making. For details, readers can refer to [44]. For example, let us assume that the value of expected cost loss after apply-ing response actions to the necessity measure of 90% is 20%. Therefore, if the risk tolerance is set to 10%, a risk-averse project manager may request additional budget for the risk response planning process;
3.1.2. FTOPSIS results
it is possible to assign a weight factor in terms of time, cost, or quality to a work package and, subsequently, determine the expected time, cost, or quality eects of a particular risk event on that work package. However, there are other criteria that are susceptible to the
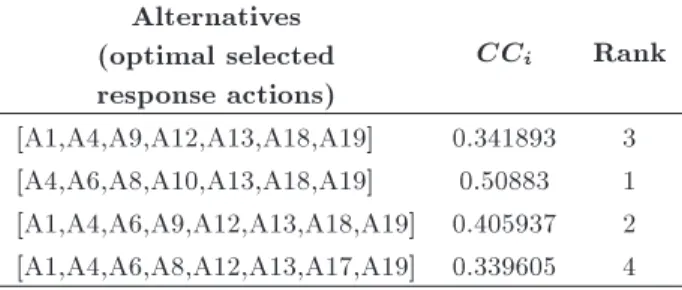
risks. These criteria cannot be quantied in this way. Therefore, it is required to utilize subjective judgment of the management team to consider them. For this purpose, in this stage, an MCDM model using the FTOPSIS method is employed to evaluate and select the most satisfying or the best combination of response actions in accordance with the pre-determined criteria. These criteria can be dened by surveying the man-agement team of a specic contractor. In this study, executive support, stakeholders' satisfaction, and tech-nical complexity criteria along with tness function are used to determine the most satisfying solution. These criteria have been proposed by the management team. The main factor for choosing criteria is the unique characteristics of the project. Therefore, these criteria could dier from project to project on the basis of the project's unique features and management's attitudes. The linguistic opinions of three persons associated with the contractor management team are aggregated and used for this purpose. Since these experts have the same qualication, the importance of experts against each other is not considered. However, in another situation, it is worthwhile to consider the importance weight of each expert. The decision matrix and the computational results of the proposed fuzzy TOPSIS are shown in Tables 4 and 5, respectively. The deterministic weights of the attributes are obtained by the AHP method. The linguistic variables in Figure 3(b) are also used to evaluate alternatives based on the pre-determined criteria in Table 4.
The obtained results of the proposed FTOPSIS indicate that the most satisfying response actions for the identied risks in this case can be selected as follows:
Investigate the validity of land ownership docu-ments;
Increase the interaction of public service organiza-tions;
Employ skillful and highly experienced sta;
Allocate the experienced sta acquainted with the complexity of the work;
Determine the provision of the design change within the building contract;
Table 5. Closeness coecient of each optimal selected response action set and its ranking.
Alternatives (optimal selected response actions)
CCi Rank
[A1,A4,A9,A12,A13,A18,A19] 0.341893 3 [A4,A6,A8,A10,A13,A18,A19] 0.50883 1 [A1,A4,A6,A9,A12,A13,A18,A19] 0.405937 2 [A1,A4,A6,A8,A12,A13,A17,A19] 0.339605 4
Supply material on time from other sources;
Purchase some of the main equipment from local factories.
As shown in Table 4, the best optimal selected response actions, obtained from the ACO, were used in the TOPSIS procedure. Utilizing the TOPSIS, the authors believe that more aspects of the obtained solutions by ACO can be evaluated. In the studied case, all alternatives in Table 4, except the second one, acquired an almost similar tness value in ACO. However, the second one, with a lower tness value, was selected as the best solution using the TOPSIS. The main dierence between these optimally selected response actions lies in the response actions, which were selected for R4 and R5. As shown in Table 4, response actions A8 and A10 achieve more executive support and stakeholders' satisfaction in comparison to response actions A9 and A12. In other words, although providing training for sta and supervision measures can prevent the occurrence of R4 and R5, even with a lower cost, the stakeholders prefer to em-ploy experienced and skillful personnel and sta. This action prevents accidents during the implementation. Moreover, it can also reduce the technical complexity of the execution phase and achieve more executive support. The mentioned aspects of the response actions cannot be quantied using ACO. Therefore, applying an MCDM technique, such as TOPSIS, is recommended for evaluating the obtained solutions by ACO in accordance with other criteria.
In order to evaluate the validity of the proposed framework, its results were also discussed with the project manager and his team in some common meet-ings. Based on their judgments, the results of this methodology proved more appealing in comparison with traditional approaches. The participants nally acknowledged that the model indeed could provide a quantitative decision support for their practical work.
4. Conclusion and remarks
This paper presented an integrated framework that consists of an optimization-based model and an MCDM approach to select the most eective risk response ac-tions considering the expected risk loss and interacac-tions between risk events. In the optimization-based model, to overcome the imprecision resulting from lack of knowledge or insucient data, the fuzzy set theory was used for determining the parameters of the risk events. Furthermore, the DSM method was used to capture the eect of interactions between the risk events when selecting response actions. Then, the proposed model was solved using ant colony optimization to nd the best combination of response actions that have high eects on time, cost, and quality. In the MCDM model,
for evaluating the solutions obtained by ACO, based on the other criteria, the FTOPSIS method was used. The eciency of the proposed framework was demonstrated by its implementation in a real building construction project. In the studied case, the impact of the optimal response action sets on project objectives, including time, cost, and quality, unlike previous approaches, can be represented in a fuzzy environment. Therefore, further analysis using possibility and necessity mea-sures, which are widely used in the fuzzy literature, can be carried out to provide valuable data for decision-making. The case-study results also show that the evaluation of the obtained alternatives by ACO on the basis of other criteria, which could not be considered in the optimization-based model, may lead to changes in the optimal solution. Generally, the advantages of the proposed framework can be summarized as follows:
Providing a new framework in a fuzzy environment, unlike the previous researches, in which insucient information and uncertain project environment in the construction industry domain are considered. In other words, by using the proposed method, the impact of uncertainty in risk parameters on the eciency of risk response actions can be analyzed;
Considering multiple criteria for evaluating response actions, including time, quality, executive support, stakeholders' satisfaction, etc., for risk response action selection besides the cost criterion existing in the literature. Therefore, decision-makers can evaluate the candidate response actions set and make a decision more eciently;
Considering the interactions between risk events in the process of evaluating the eects of selected response actions on project objectives. It was shown that the nal results could be dierent by taking into account these relations;
By using ACO as a heuristic algorithm, the proposed framework can also be used for more complex and large-sized problems.
The results demonstrated that the proposed framework could assist the project manager and professional ex-perts to identify and evaluate risk response actions more eciently. Therefore, the proposed framework is expected to be applicable to a wide set of engineering projects for the risk response actions selection problem. Of note, there exist limitations of applying the pro-posed approach in practice presented in the following:
1. In the studied case, the optimally selected response actions varied for dierent uncertainty levels; there-fore, it was necessary to investigate the sensitivity of the optimally selected response actions with respect to the level of uncertainty in the probability or impact of the risk events;
2. The diculties and uncertainties, which are un-avoidable in identifying and quantifying the risk interactions using the DSM methods, should be considered;
3. The probability and impacts of the secondary risks (risks that did not exist before and were created by the risk response actions) should be dened and considered;
4. The sensitivity of the optimal response action set and OF value to risk interactions should be ana-lyzed. For further research, the application of the proposed framework in more complex environments with respect to the mentioned limitations should be investigated.
References
1. Loosemore, M., Raftery, J., Reilly, C., and Higgon, D., Risk Management in Projects, London: Taylor & Francis (2006).
2. PMI (Project Management Institute), A Guide to the Project Management Body of Knowledge, 5th Ed., PMI (2012).
3. Flanagan, R. and Norman, G., Risk Management and Construction, Victoria, Australia.: Blackwell Science Pty Ltd (1993).
4. Amehl, O., Soyingbe, A., and Odusami, K. \Signicant factors causing cost overruns in telecommunication projects in Nigeria", Journal of Construction in De-veloping Countries, 15(2), pp. 49-67 (2010).
5. Olateru-Olagbegi, M., Investigating Key Risk Factors and Risk Management Methods in the Information and Communications Technology Industry in Nigeria, Lille, France: SKEMA Business School (2016).
6. Zou, P.X.W., Zhang, G., and Wang, J. \Understanding the key risks in construction projects in China", International Journal of Project Management, 25(6), pp. 601-614 (2007).
7. Seyedhoseini, S.M., Noori, S., and Hate, M.A. \An integrated methodology for assessment and selection of the project risk response actions", Risk Analysis, 29(5), pp. 752-763 (2009).
8. Miller, R. and Lessard, D. \Understanding and manag-ing risks in large engineermanag-ing projects", International Journal of Project Management, 19(8), pp. 437-443 (2001).
9. Piney, C. \Risk response planning: select the right strategy", In Fifth Project Management Conference, France (2002).
10. Kujawski, E. \Selection of technical risk responses for ecient contingencies", Systems Engineering, 5(3), pp. 194-212 (2002).
11. Pipattanapiwong, J. and Watanabe, T. \Multi-party risk management process (MRMP) for a construction project nanced by an international lender", In Pro-ceedings of the 16th ARCOM conference, pp. 219-228 (2000).
12. Klein, J.H., Powell, P.L., and Chapman, C.B. \Project risk analysis based on prototype activities.", Journal of the Operational Research Society, 45(7), pp.749-757 (1994).
13. Fan, M., Lin, N.-P., and Sheu, C. \Choosing a project risk-handling strategy: an analytical model", Interna-tional Journal of Production Economics, 112(2), pp. 700-713 (2008).
14. Fan, Z.P., Li, Y.H., and Zhang, Y. \Generating project risk response strategies based on CBR: A case study", Expert Systems with Applications, 42(6), pp. 2870-2883 (2015).
15. Zhang, Y. and Fan, Z.P. \An optimization method for selecting project risk response strategies", Inter-national Journal of Project Management, 32(3), pp. 412-422 (2014).
16. Kayis, B., Arndt, G., Zhou, M., and Amornsawad-watana, S. \A risk mitigation methodology for new product and process design in concurrent engineering projects", Annals of the CIRP, 56(1), pp. 167-170 (2007).
17. Ben-David, I. and Raz, T. \An integrated approach for risk response development in project planning", Journal of the Operational Research Society, 52(1), pp. 14-25 (2001).
18. Nik, E.R., Zegordi, S.H., and Nazari, A. \A multi-objective optimization and fuzzy prioritization ap-proach for project risk responses selection", In In-dustrial Engineering and Engineering Management (IEEM). 2011 IEEE International Conference on IEEE, Singapore (2011).
19. Fang, C., Marle, F., Xie, M., and Zio, E. \An inte-grated framework for risk response planning under re-source constraints in large engineering projects", IEEE Transactions on Engineering Management, 60(3), pp. 627-639 (2013).
20. Soofard, R. and Khakzar Bafruei, M. \An optimal model for Project Risk Response Portfolio Selection (P2RPS) (Case study: Research institute of petroleum industry)", Iranian Journal of Management Studies, 9(4), pp. 741-765 (2016).
21. Soofard, R. and Gharib, M. \A new approach to project risk responses selection with inter-dependent risks", International Journal of Engineering Transac-tions B: ApplicaTransac-tions, 30(5), pp. 720-728 (2017).
22. Zhang, Y. \Selecting risk response strategies con-sidering project risk interdependence", International Journal of Project Management, 34(5), pp. 819-830 (2016).
23. Tiwana, A. and Keil, M. \Functionality risk in infor-mation systems development: An empirical investiga-tion", IEEE Transaction on Engineering Management, 53(3), pp. 412-425 (2006).
24. Parchami Jalal, M. and Shoar, S. \A hybrid SD-DEMATEL approach to develop a delay model for construction projects", Engineering, Construction and Architectural Management, 24(4), pp. 629-651 (2017).
25. Duan, Q. and Warren, L.T. \Improved ant colony op-timization algorithms for determining project critical paths", Automation in Construction, 19(6), pp. 676-693 (2010).
26. Mueller, C. \Multi-objective optimization of software architectures using ant colony optimization", Lecture Notes on Software Engineering, 2(4), pp. 371-374 (2014).
27. Dorigo, M. and Gambardella, L.M., Ant Colonies for the Traveling Salesman Problem, Belgium: TR/IRIDIA/1996-3, Universite Libre de Bruxelles (1996).
28. Lopez-Ibanez, M., Multi-objective Ant Colony Opti-mization, Universidad de Granada (2004).
29. Dorigo, M. \Optimization, learning and natural al-gorithms", Italy, Ph.D. Thesis, Politecnico di Milano (1992).
30. Abbasianjahromi, H., Rajaie, H., Shakeri, E., and Chokan, F. \A new decision making model for sub-contractor selection and its order allocation", Project Management Journal, 45(1), pp. 55-66 (2014).
31. Dorigo, M. and Stutzle, T. \The ant colony opti-mization metaheuristic: Algorithms, applications and advances", In Handbook of Metaheuristics, volume 57 of International Series in Operations Research & Management Science, F. Glover and G. Kochenberger, Eds., Norwell: MA: Kluwer Academic Publishers, pp. 251-285 (2003).
32. Hatami-Marbini, A. and Kangi, F. \An extension of fuzzy TOPSIS for a group decision making with an application to Tehran stock exchange", Applied Soft Computing, 52, pp. 1084-1097 (2017).
33. Jafarian, A., Shaei, M., and Amiri, M. \Framework for prioritizing and allocating six sigma projects using fuzzy TOPSIS and fuzzy expert system", Scientia Iranica, 21(6), pp. 2281-2294 (2014).
34. Wang, T.C. and Chang, T.H. \Application of TOPSIS in evaluating initial training aircraft under a fuzzy en-vironment", Expert Systems with Applications, 33(4), pp. 870-880 (2007).
35. Gupta, R., Sachdeva, A., and Bhardwaj, A. \Selection of 3pl service provider using integrated fuzzy delphi and fuzzy TOPSIS", In Proceedings of the World Congress on Engineering and Computer Science, San Francisco, USA (2010).
36. Behzadian, M., Khanmohammadi Otaghsara, S., Yaz-dani, M., and Ignatius, J. \A state-of the-art survey of TOPSIS applications", Expert Systems with Appli-cations, 39(17), pp. 13051-13069 (2012).
37. Steward, D.V. \The design structure system: a method for managing the design of complex systems", IEEE Transactions on Engineering Management, 28(3), pp. 71-74 (1981).
38. Fu, Y., Li, M., and Chen, F. \Impact propagation and risk assessment of requirement changes for software de-velopment projects based on design structure matrix", International Journal of Project Management, 30(3), pp. 363-373 (2012).
39. California Department of Transportation (Caltrans), Project Risk Management Handbook, 4th Ed., Sacra-mento: CA: Caltrans, Oce of Project Management Process Improvement (2007).
40. Klir, G. and Yuan, B., Fuzzy Sets and Fuzzy Logic: Theory and Applications, Chapter. 10, Englewood Clis, N.J.: Prentice-Hall PTR, pp. 280-301 (1995).
41. Dalkey, N. and Helmer, O. \An experimental appli-cation of the delphi method to the use of experts", Management Science, 9(3) , pp. 458-467 (1963).
42. Saaty, T.L., Decision Making for Leaders: The An-alytical Hierarchy Process for Decision in a Complex World, Chapter 5, Belmont, California: Lifetime Learning, pp. 75-92 (1982).
43. Podgorski, D. \Measuring operational performance of OSH management system - A demonstration of AHP-based selection of leading key performance indicators", Safety Science, 73, pp. 146-166 (2015).
44. Guyonnet, D., C^ome, B., Perrochet, P., and Parriaux, A. \Comparing two methods for addressing uncer-tainty in risk assessments", Journal of Environmental Engineering, 125(7), pp. 660-666 (1999).
Biographies
Shahab Shoar received the BSc degree in Architec-tural Design from Kashan University, Iran in 2012. He received the MSc degree in Construction Engineering and Management from Mehralborz Institute of Higher Education, Tehran, Iran in 2015. His research interests include project management, risk management, com-plex system modeling, and simulation.
Ahad Nazari, PhD, is an Assistant Professor at Shahid Beheshti University, Tehran, Iran. He is a scientic secretary and a scientic board member of the International Project Management Conference, which takes place annually in Tehran, Iran. Dr. Nazari is also a member of Iran PMA Board of directors. He is the author and translator of 5 books and more than 50 papers on project management, risk management, and value engineering subjects. In addition to the academic activities, he has more than 15 years of experience in dierent industrial sectors such as oil and gas, energy, road, and transportation.