A BIBLIOMETRIC ANALYSIS OF RESEARCH PUBLICATIONS THAT
ADOPTED THE MEDICAL EXPENDITURE PANEL SURVEY (MEPS) DATA
Jiacheng “Coco” Liu Undergraduate Honor’s Thesis School of Information and Library Science The University of North Carolina at Chapel Hill
Thesis advisor: Dr. Fei Yu Committee members: Dr. Fei Yu Dr. Lixin Song Dr. Ryan Shaw
Approved by:
Thesis advisor: _________________ Second reader: __________________
ACKNOWLEDGEMENT
ABSTRACT
Table of Contents
Acknowledgement ... 2
Abstract ... 3
1. Introduction ... 6
1.1 Background ... 6
1.2 The Medical Expenditure Panel Survey Dataset ... 6
1.3 Purposes of the study ... 8
1.4 Research questions ... 9
2. Literature Review ... 9
2.1 The Emergence and Development of Healthcare Databases ... 9
2.2 Bibliometric Analysis ... 11
2.3 Bibliometric Analysis on Healthcare-Related Databases... 12
3. Methodology ... 13
3.1 Study procedure ... 13
3.2 Search Strategy ... 13
3.3 Bibliometric tools ... 15
3.3.1 PubMed... 15
3.3.2 Covidence ... 16
3.3.3 Web of Science ... 16
3.3.4 Excel ... 16
3.3.5 VosViewer ... 16
3.4 Data analysis ... 17
4. Findings ... 17
4.1 Productivity ... 17
4.1.1 Number of publications over time ... 17
4.1.2 Number of articles that cited the 1953 publications... 18
4.2 Usage Pattern... 19
4.2.1 Category/topic summary ... 19
4.2.2 Journals Source ... 20
4.2.5 Topic Analysis ... 24
4.3 Co-authorship and collaboration ... 28
4.3.1 Countries and international collaboration ... 28
4.3.2 Institutional contribution and collaboration ... 29
5. Summary and Discussion ... 32
Implications ... 33
Limitations ... 34
Future directions ... 34
6. Conclusion... 35
1. INTRODUCTION
1.1 Background
The US government currently invests approximately $3.5 trillion a year on healthcare, and more than $30 billion on biomedical research (“National Health Expenditure Data” 2018). Despite the importance of healthcare practice and research, the healthcare related databases and datasets have been heavily undervalued (“Want Reliable Medical Information? The Trump Administration Doesn’t.” 2018). Therefore, the relationship between basic biomedical research and healthcare practice are not well recorded and established. Furthermore, the current administration claimed to have a constricted financial resource and shut down the National Guideline Clearinghouse, an important database that stores treatments and evidences for each disease and disorder in 2018 (“Want Reliable Medical Information? The Trump Administration Doesn’t.” 2018), further undervaluing healthcare related databases. This study, thus, aimed to provide evidence about the importance of healthcare related database, especially the databases that collect information about the relations between patients, hospitals, and insurance companies. We conducted a bibliometric analysis on the publications that have utilized data from one of these datasets. We analyzed the scopes and depth of the studies, as well as their institutional and international impact.
1.2 The Medical Expenditure Panel Survey Dataset
datasets by conducting a bibliometric analysis. The findings meant to provide insights to grant agencies and healthcare researchers in terms of data collection and organization, funding, journal sources, and collaborations.
1.3 Purposes of the study
We chose to analyze the MEPS dataset to achieve two research aims. At a national level, AHRQ has been running the MEPS for several decades and has undergone multiple modifications and improvement. This study thus aimed in part to provide feedback to AHRQ of the data being used in the publications for better further modification advise. More specifically, we hope to provide analyses of the type of studies conducted using the data, the area of studies using some specific data, the keywords obtained from the dataset, as well as the outcome of the publications. These results may provide useful information for AHRQ, in order to grasp a more comprehensive understanding of data usage to improve the data quality and accessibility.
1.4 Research questions
We hope to examine the usage of MEPS dataset in publications and explore the following questions:
RQ1.What is the productivity of publications that have used the MEPS data? RQ2. What aspects of the MEPS dataset can be found in publications?
RQ3. What are the patterns of co-authorship and collaboration in the publications that have used MEPS data?
2. LITERATURE REVIEW
2.1 The Emergence and Development of Healthcare Databases
A database is a type of data structure which facilitates the entry, update, organization, and retrieval of a group of related data (Institute of Medicine (US) Committee on Regional Health Data Network 1994). As society becomes more dependent on information storage and retrieval from database systems, current society, most of the fields including but not limited to healthcare, science, and politics rely heavily on the usage of databases.
started as early as the 1970s (Jones and Ould 1974), where most of the data stored and provided were simply patient conditions and their medicinal usage. As time progressed, database became computerized, and its functions expanded due to the increasing variety of needs and usages from users, evolving the overall reasons of database utilization over time (Dahlen 1997). Due to the rapidly improving quality and usability of medical related databases, the user population has expanded to policy makers, insurance companies, as well as patients, evolving from just physicians and medical practitioners. As for now, multiple healthcare system featured database exists under Agency for Healthcare Research and Quality, such as Medical Expenditure Panel Survey (MEPS) (“Medical Expenditure Panel Survey” 2019) and Healthcare Cost and Utilization Project (HCUP) (“Healthcare Cost and Utilization Project” 2019). These types of healthcare databases have significant contributions to the macro (at a national level) and micro (at a patient-doctor interaction level) medical environment.
stay and insurance policy, and healthcare expense on the nation and family level (Kirkland et al. 2018). Although the data and methods being used in each study are different, the methods are comparable and can be classified into several categories.
2.2 Bibliometric Analysis
First coined by Pritchard in 1969, the term bibliometric analysis refers to the methods that utilize statistical approach to study various aspects of a chosen pool of publications (Pritchard 1969; Ellegaard and Wallin 2015). Using diverse metrics to track each publications’ citation network as well as content interrelation, this method can draw a big picture of the development and trend of a particular topic (Raina and Gupta 1998; Youngblood and Lahti 2018). Two major elements made bibliometric analysis a very useful approach for studying literatures. First, bibliometric analysis methods utilize multiple citation indexes collected in most journals to measure productivity, efficiency, geographical distribution (Liao et al. 2018) and impact of the publications (Whitepaper Using Bibliometrics: A Guide to Evaluating Research Performance with Citation Data
(Falagas, Karavasiou, and Bliziotis 2006), research in cultural evolution (Youngblood and Lahti 2018), and even other healthcare related database (Chen et al. 2011). Therefore, it has been demonstrated that bibliometrics is a powerful practice for understanding the big picture of a category of studies.
2.3 Bibliometric Analysis on Healthcare-Related Databases
Multiple bibliometric analyses have been done on local healthcare related records collected and published in other countries. For example, a study conducted in Canada systematically compared the different usage patterns with two healthcare utilization databases (Tricco, Pham, and Rawson 2008). A bibliometric analysis was also done by German researchers to study epidemiological research using a health insurance medication database (Hoffmann 2009). More recently, a group of British researchers studied the research output from their hospital record database (Chaudhry et al. 2017). Multiple examples indicated that the potential for bibliometric analysis to further understand productivity and usage pattern is valuable for prediction of future research. For the MEPS database, although more than 1900 articles have been identified in related databases such as PubMed and Web of Science, the actual usage patterns and dynamics between different research remained to be studied. Successfully conducting a bibliometric analysis on this dataset will not only grasp the essence of existing studies, but also predict and identify future research trends using the database.
3. METHODOLOGY
3.1 Study procedure
3.2 Search Strategy
This study systematically searched research articles published between 1996 to 2018, which have used the Medical Expenditure Panel Survey (MEPS). Two research databases, PubMed and Web of Science (WoS) were adopted for this study (Table 1). The search terms were connected with Boolean operators to construct search queries, which included variations of how MEPS dataset were spelled in research articles, such as “meps” and “medical expenditure panel surveys”. In addition, to exclude potential irrelevant articles, the terms, “cost” and “insurance” were also added to the search
Analyze the collaboration patterns
VosViewerAnalyze the topic and keywords network from titles and abstracts
Web of Science VosViewer
Analyze various aspects of data usage from the publications
Web of Science Microsoft Excel Microsoft Word
Analyze the productivity of publications
Web of Science Microsoft Excel
Deduplicate results and clean up data
Microsoft ExcelScreen the articles collected
CovidenceSearch and collect articles from various databases
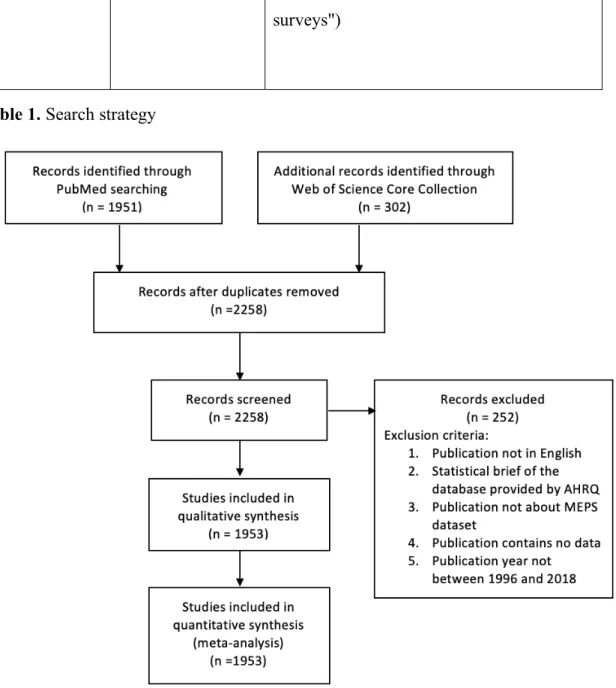
queries. PubMed search returned 1951 results and an additional 302 articles from WoS were found and added for further screening. After deduplication, Covidence was used to facilitate manual screening of the retrieved publications. JL and FY independently screened the title and abstract fields of each publication in Covidence and excluded articles based on the following inclusion and exclusion criteria. To meet the inclusion criteria, the publications have to 1) be published in English; 2) be a primary research paper published in journals between 1996 and 2018; and 3) use data from the MEPS dataset. Publications were excluded from the analysis if they have missing citation fields (i.e., abstract and author) or are AHRQ statistical briefs.
Database Date, # Results Query
PubMed 10/21/18, N=1951 (meps*[tiab] AND (cost OR costs OR insurance*)) OR medical expenditure panel survey OR medical expenditure panel surveys OR medical expenditures panel survey OR medical expenditures panel surveys
survey" OR "medical expenditure panel surveys" OR "medical expenditures panel survey" OR "medical expenditures panel surveys")
Table 1. Search strategy
Figure 1. PRISMA flow diagram (Moher et al. 2009) of study screening and inclusion.
3.3 Bibliometric tools
3.3.1 PubMed
authors, publish date, abstract, PMID, Mesh terms) were transferred to Excel for deduplication and data clean-up.
3.3.2 Covidence
Covidence ("Covidence Systematic Review Software" 2019) was used to screen the articles retrieved from two sources (PubMed and WoS). Deduplicated data were loaded into Covidence for manual title and abstract screening by JL and FY, respectively.
3.3.3 Web of Science
WoS was used in two ways in our study. First, we conduct a search of related articles on WoS and combined the results with those from PubMed. Second, articles that passed the screening were reloaded to WoS (N=1953) using PubMed ID, DOI, WoS accession number, or titles. The analytics function on WoS provides the following statistics: # of publications by years, research categories, top ten journals, authors, author-affiliated institutions, and countries of the authors.
3.3.4 Excel
The raw numeric data from WoS were transferred to Excel for better visualization and comparison. Funding sources of the publication, if provided, were manually sorted and categorized. The titles and abstracts of each publication were extracted for database co-occurrence and topic analyses. Publications with authors from North Carolina institutes were also manually sorted for analyses of local usage.
3.3.5 VosViewer
analysis and keyword relationships were also mapped by VosViewer.
3.4 Data analysis
In order to answer our research questions, we conducted a series of analysis using the bibliometric tools. To examine the productivity of research using MEPS, we analyzed the numbers of publications and the cited articles by year. We obtained the WoS publication analysis and citation report, which were subsequently modified with Excel. To analyze the number of publications under each category by year, research areas categorized by WoS were used, and the publications under each area were summarized by year. We also analyzed the journal sources that have published the studies using MEPS using the statitics provided by WoS. In order to find the databases that researchers used along with the MEPS for data complementation or comparison, abstracts with the keyword “database*” were manually screened out, and the databases mentioned were identified and summarized. We also extracted and analyze the funding source if available in the dataset,. The titles and abstracts of all included articles were extracted for topic analysis via VosViewer; we extracted 392 key terms which has more than 26 occurrences. Contributions by country were summarized by Excel, in which the appearance of each country was counted and analyzed. At last, the collaborations between institutions and countries were mapped and the network was analyzed using VosViewer.
4. FINDINGS
4.1 Productivity
4.1.1 Number of publications over time
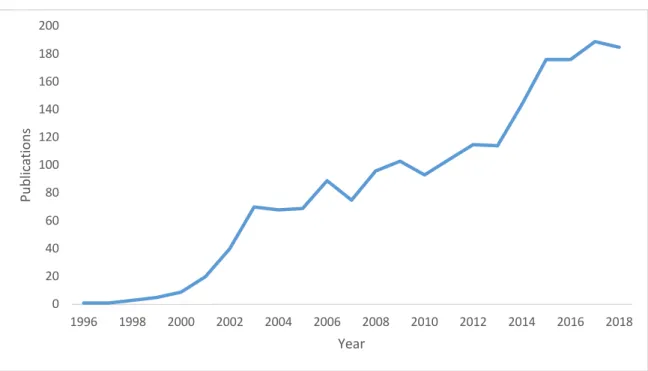
between 1996 and October 2018 (Figure 2). Overall, the number of publications has increased steadily, and reached its peak in 2017. The numbers of publication accelerated the most from 2014 to 2016, reaching almost 70 publications per year. The average numbers of publications during the past five years almost tripled, which shows that the dataset gained an uprising interest.
Figure 2. The number of publications by year (1996-2018)
4.1.2 Number of articles that cited the 1953 publications
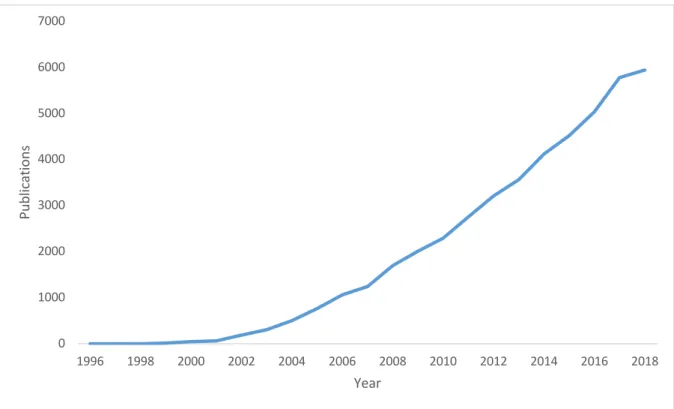
According to WoS statistics, the 1953 included publications included in this study were
cited by 44,432 articles over the years, and the number of citation has accelerated since
2008 (Figure 3). The growth of citation shows the growing impact of these publications
as well as the MEPS dataset itself. The top ten most cited papers were studies on costs
or expenditures of certain diseases; the paper about the cost of fall among older adults
has been cited 769 times (Burns, Stevens, and Lee 2006), exceeding all published
0 20 40 60 80 100 120 140 160 180 200
1996 1998 2000 2002 2004 2006 2008 2010 2012 2014 2016 2018
papers using MEPS.
Figure 3. The number of citations by year (1996-2018)
4.2 Usage Pattern
4.2.1 Category/topic summary
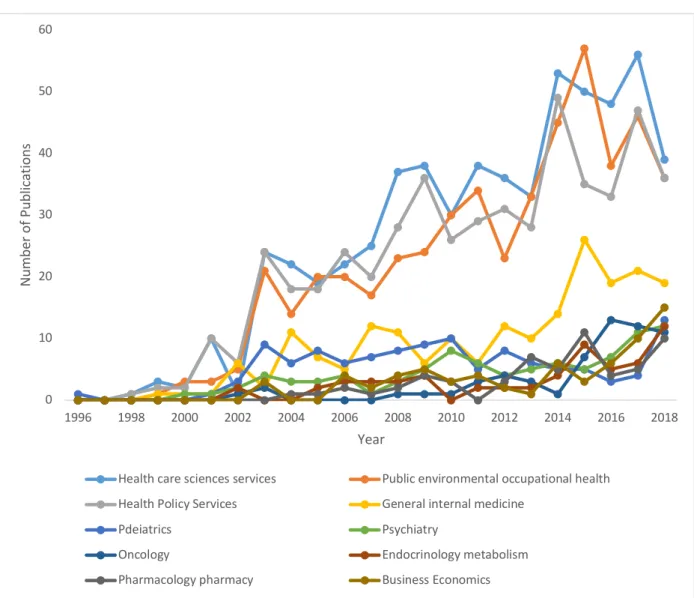
Eight of the top ten topics were in the field of public health and medicine, and the remaining two of the topics were in the field of business and industry. The number of publications about each topic has increased steadily; the number of the top four topics (i.e, healthcare sciences services, public environmental occupational health, health policy services, and general internal medicine) has increased more drastically. Public environmental occupational health and general internal medicine has peaked in 2015, whereas the number of publications about healthcare science and health policy services peaked between 2014 and 2017.
0 1000 2000 3000 4000 5000 6000 7000
1996 1998 2000 2002 2004 2006 2008 2010 2012 2014 2016 2018
Pu
bl
ic
at
io
ns
Figure 4. The number of publications by topics and by year (1996-2018)
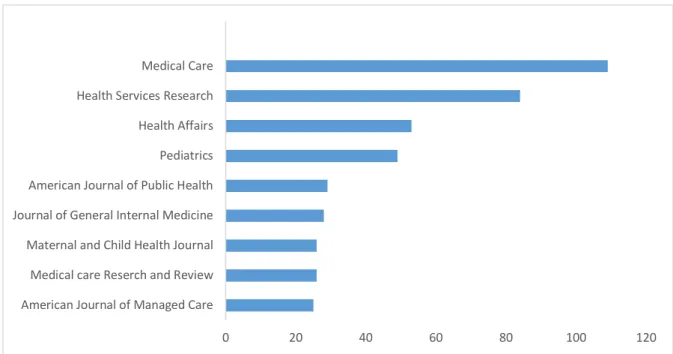
4.2.2 Journals Source
The top ten journals that have published research papers using MEPS are in medicine and healthcare research. Specifically, six journals are in general public health research, whereas four are in specialty areas, such as pediatric care and internal medicine. The types of journals where the research papers have published are corresponding to the topics analyzed above and match the purpose of MEPS.
0 10 20 30 40 50 60
1996 1998 2000 2002 2004 2006 2008 2010 2012 2014 2016 2018
Nu m be r o f P ub lic at io ns Year
Health care sciences services Public environmental occupational health Health Policy Services General internal medicine
Pdeiatrics Psychiatry
Oncology Endocrinology metabolism
Figure 5. The top ten journals that accepted MEPS related articles (stacked bar chart)
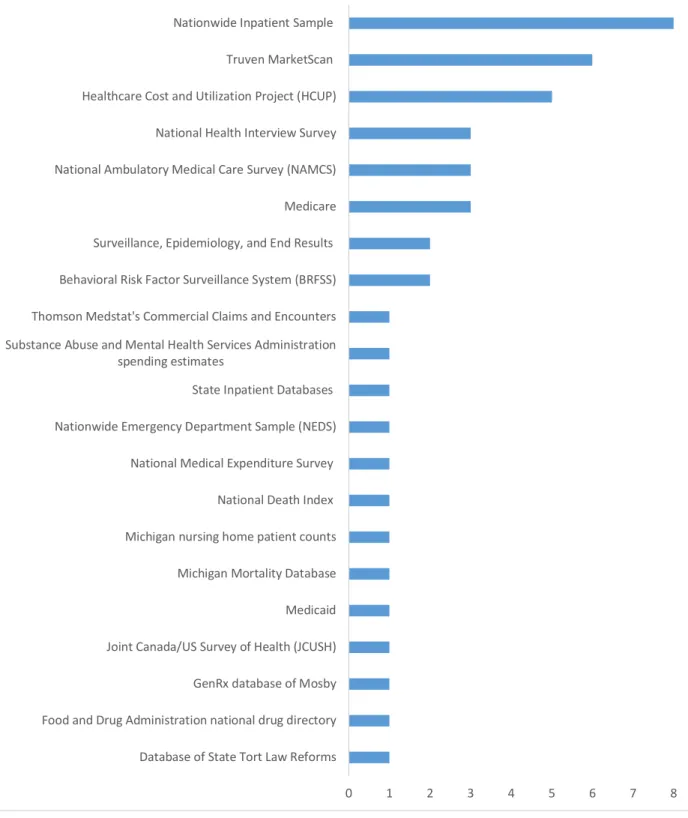
4.2.3 Database co-occurrence
A total of 24 databases have been used simultaneously in conjunction with MEPS in the research papers under review (i.e., co-occurrence). All but one of the co-occurred databases were within the medical and healthcare realm, some focused mainly on medical or life record (such as Nationwide Inpatient Sample), while others included a wide range of medicine pricing, insurance, and payment data (such as Truven MarketScan). In this database pool, both local and international databases were recognized. The presence of both local (two Michigan healthcare databases were scrutinized), and international databases (Joint Canada/US Survey of Health (JCUSH) was used) suggested that researchers have been comparing the average American data to either a more zoomed-in state database or to a more general international database, in addition to parallel comparison.
0 20 40 60 80 100 120
Figure 6. The frequency of co-occurred databases identified from the abstracts
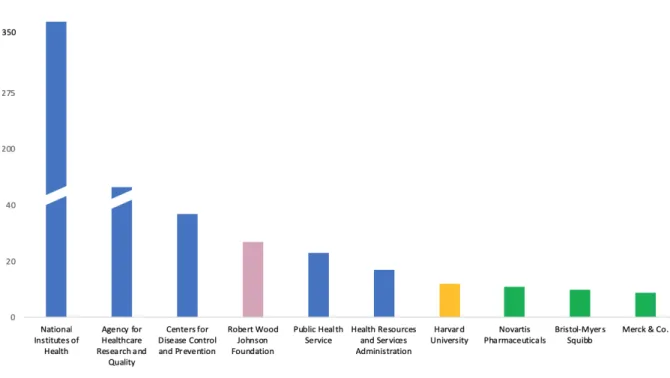
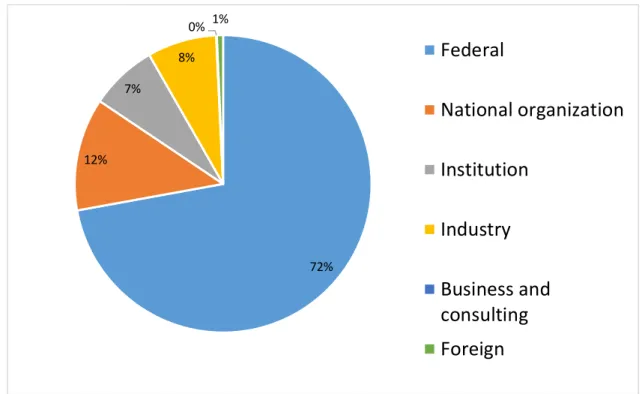
4.2.4 Funding sources
The top ten funding sources included a mix of federal, national organization, institutional funding, and pharmaceutical companies, with 54% of publications funded
0 1 2 3 4 5 6 7 8 9
Database of State Tort Law Reforms Food and Drug Administration national drug directory GenRx database of Mosby Joint Canada/US Survey of Health (JCUSH) Medicaid Michigan Mortality Database Michigan nursing home patient counts National Death Index National Medical Expenditure Survey Nationwide Emergency Department Sample (NEDS)
State Inpatient Databases Substance Abuse and Mental Health Services Administration
spending estimates
Thomson Medstat's Commercial Claims and Encounters Behavioral Risk Factor Surveillance System (BRFSS) Surveillance, Epidemiology, and End Results
by NIH institutions. The mixture of funding sources indicated interest from diverse fields, including pharmaceutical industry and consulting. We also found that federal and private organizations from foreign countries, such as China, South Korea, and Japan have also provided funding support for related research.
Figure 8. Distribution of funding sources
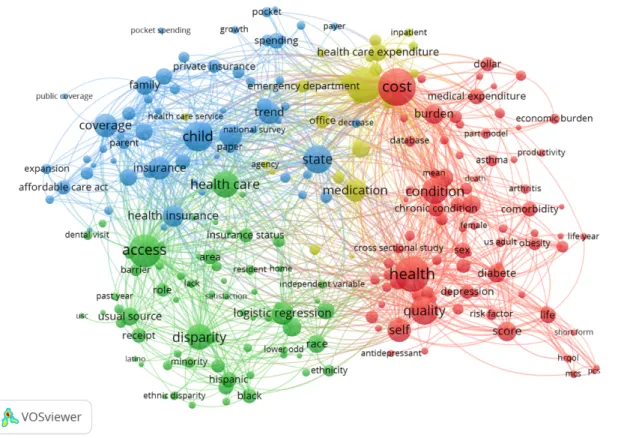
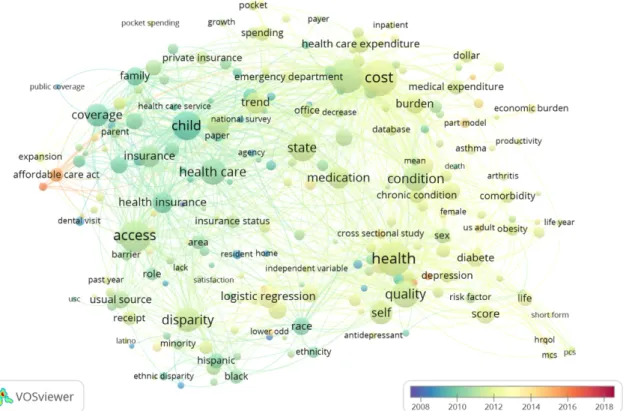
4.2.5 Topic Analysis
We identified 392 words that appeared more than 26 times from the abstracts of 1953 articles, among which 235 words had the strongest association with the bag of words extracted from the abstracts(Figure 9). The words with densest relationship (figure 10) showed researchers’ interest (health, cost, child, access, and disparity), the data content (e.g., condition, medication, coverage, and state), and study methods (score, logistic regression, and trend). The overlay figure (figure 11) showed a pool of long-lasting topics along with some newly appeared topics. In the overlay visualization of the most recent decade, the most popular words started to populate between 2010 and 2014. The publications in earlier years have focused more on child and family related data, whereas the more recent publications have shifted to focusing on health accessibility and equality. The Affordable Care Act (ACA) became a heavily mentioned topic in
72% 12%
7%
8% 0% 1%
Federal
National organization
Institution
Industry
2014, which corresponded to the changes in publication topics and research intersests.
Figure 10. Topic heat map for MEPS publications, 1996-2018
We also conducted a topic analysis on the articles that are first authored by non-US
researchers (figure 12). Comparing the two heat maps (figure 10 and figure 12), most
of the highly associated words, such as cost, child, disparity and health status, which
indicated that non-US researchers have focused on similar topics as the US researchers.
However, there are some difference in the highly associated words. For example,
insurance and association are more associated in the foreign articles. This may be a sign
that more foreign papers studied the interrelation between different factors of healthcare,
which includes insurance.
4.3 Co-authorship and collaboration
4.3.1 Countries and international collaboration
We identified a total of 25 countries where the authors are affiliated; countries that contributed to more than two publications are shown in figure 13. Approximately 92.5% of the authors are from the USA, followed by South Korea, England, China, and Canada within the top five. There are 102 publications whose reprint/primary authors are not in the United States. The collaboration patterns between countries and areas were analyzed by VosViewer (figure 14). The network indicates that some countries had a sole collaboration with the USA, such as South Korea and Saudi Arabia, while others had multiple co-authorship with other countries, such as England and Canada.
Figure 14. International collaboration map, 1996-2018
4.3.2 Institutional contribution and collaboration
Carolina System formed individual research hubs. Between clusters, there were high levels of collaboration. This indicates that research using MEPS data were usually the interest of multiple institutions.
Figure 15. Top ten institutions contributed to MEPS data research, 1996-2018
0 50 100 150 200 250 300 University Of California System National Institutes Of Health NIH USA Agency For Healthcare Research Quality Harvard
Figure 16. Institutional collaboration network, 1996-2018. Red dots represent federal
research agency, blue dots represent universities or research institutions, and green dots
Figure 17. Density map for institutional contributions, 1996-2018
5. SUMMARY AND DISCUSSION
sfrequency of database co-occurrences, and funding sources from different backgrounds. The various features of dataset usage indicates a joint interest from multiple areas and industries.
At last, our study also demonstrated that the MEPS dataset reached international impact to some extent. everal foreign agencies were identified to be the funding sources for publications using MEPS data, such as the Chinese National Social Science Foundation which furthermore is funded directly from the federal level. Looking from author-affiliated countries, 25 countries conducted research using this dataset, 102 papers primary authored by foreign researchers, and multiple international co-authorship links were identified. Considering the MEPS dataset surveyed samples were only within the United States, it was surprising to find the attention it could gain from foreign countries.
Implications
Moreoever, our topic analysis provided networks of keywords extracted from those of previous publications, and these words/word relationships can guide researchers to identify research gaps and future research directions. For example, researchers can find interesting relationships between keywords and study the rationale behind the relationship. Our topic heat map provides the development and direction of focus, which also helps researchers predict future research areas.
Limitations
Although the results we found from our analysis were promising, there were several limitations to our study. First, our bibliometric analysis was based on the bibliometric data available on PubMed and Web of Science, which may not have extracted complete records of each publication when the self-reported information was lacking. For example, only 789 publications out of 1950 provided funding source information for their research, so there may be significant funding sources not reflected in our analysis due to the lack of data. Second, only publications in English language were included in our analysis. However, based on the amount of international funding and foreign publications available, there may be articles published in other languages, such as Chinese and Korean, that were not included in t his study. However, these literaure may potentially provide more or relevant insights to this study.
Future directions
we can have a more comprehensive understanding of how the data from the MEPS dataset were utilized, and what types of conclusions can be extrapolated from the data available. These aspects will be very helpful for AHRQ in organizing and structuring their data as well as for local researchers to index useful data more quickly. Second, we can expand our inquiry into full-text analysis of the publications included in this study. By conducting text-mining on the discussion section of these articles, we may identify the short-comings or limitations of the data provided in the database. By identifying the type of limitation, we can provide feedback to AHRQ for better modifying their questionnairs and data collection.
6. CONCLUSION
7. BILIOGRAPHY
Burns, Elizabeth R, Judy A Stevens, and Robin Lee. 2016. “The Direct Costs of Fatal and Non-Fatal Falls among Older Adults - United States.” Journal of Safety Research 58 (September): 99–103. https://doi.org/10.1016/j.jsr.2016.05.001. Chaudhry, Zain, Fahmida Mannan, Angela Gibson-White, Usama Syed, Shirin Ahmed,
and Azeem Majeed. 2017. “Research Outputs of England’s Hospital Episode Statistics (HES) Database: Bibliometric Analysis.” Journal of Innovation in Health Informatics 24 (4): 949. https://doi.org/10.14236/jhi.v24i4.949.
Chen, Yu-Chun, Hsiao-Yun Yeh, Jau-Ching Wu, Ingo Haschler, Tzeng-Ji Chen, and Thomas Wetter. 2011. “Taiwan’s National Health Insurance Research Database: Administrative Health Care Database as Study Object in Bibliometrics.”
Scientometrics 86 (2): 365–80. https://doi.org/10.1007/s11192-010-0289-2. “Covidence Systematic Review Software, Veritas Health Innovation, Melbourne,
Australia. Available at Www.Covidence.Org.” n.d.
Dahlen, Roger W. 1997. “A History of Medical Informatics in the United States: 1950 to 1990.” Bulletin of the Medical Library Association 85 (4): 443. https://www.ncbi.nlm.nih.gov/pmc/articles/PMC226307/.
Donaldson, Molla S., and Kathleen N. Lohr. 1994. Health Data in the Information Age: Use, Disclosure, and Privacy. National Academy Press.
https://doi.org/10.1007/s11192-015-1645-z.
Falagas, Matthew E, Antonia I Karavasiou, and Ioannis A Bliziotis. 2006. “A Bibliometric Analysis of Global Trends of Research Productivity in Tropical
Medicine.” Acta Tropica 99 (2): 155–59.
https://doi.org/https://doi.org/10.1016/j.actatropica.2006.07.011.
Garcia, Sandra P, Anne Haddix, and Kevin Barnett. 2018. “Incremental Health Care Costs Associated With Food Insecurity and Chronic Conditions Among Older Adults.” Preventing Chronic Disease 15 (August): E108. https://doi.org/10.5888/pcd15.180058.
Harrison, Jordan M, Pooja Lagisetty, Brian D Sites, Cui Guo, and Matthew A Davis. 2018. “Trends in Prescription Pain Medication Use by Race/Ethnicity Among US Adults With Noncancer Pain, 2000-2015.” American Journal of Public Health 108 (6): 788–90. https://doi.org/10.2105/AJPH.2018.304349.
“Healthcare Cost and Utilization Project.” 2019. 2019.
Hoffmann, Falk. 2009. “Review on Use of German Health Insurance Medication Claims Data for Epidemiological Research.” Pharmacoepidemiology and Drug Safety 18 (5): 349–56. https://doi.org/10.1002/pds.1721.
Institute of Medicine (US) Committee on Regional Health Data Network. 1994. Health Data in the Information Age: Use, Disclosure, and Privacy. Edited by Molla S Donaldson and Kathleen N Lohr. Washington (DC). https://doi.org/10.17226/2312. Jones, B E, and M A Ould. 1974. “The Patient Medical Record as a Database.” The
Kirkland, Elizabeth B, Marc Heincelman, Kinfe G Bishu, Samuel O Schumann, Andrew Schreiner, R Neal Axon, Patrick D Mauldin, and William P Moran. 2018. “Trends in Healthcare Expenditures Among US Adults With Hypertension: National Estimates, 2003-2014.” Journal of the American Heart Association 7 (11). https://doi.org/10.1161/JAHA.118.008731.
Liao, Huchang, Ming Tang, Li Luo, Chunyang Li, Francisco Chiclana, and Xiao-Jun Zeng. 2018. A Bibliometric Analysis and Visualization of Medical Big Data Research. Sustainability. Vol. 10. https://doi.org/10.3390/su10010166.
“Medical Expenditure Panel Survey.” 2019. Medical Expenditure Panel Survey Home. 2019.
Moher, David, Alessandro Liberati, Jennifer Tetzlaff, Douglas G Altman, and The PRISMA Group. 2009. “Preferred Reporting Items for Systematic Reviews and Meta-Analyses: The PRISMA Statement.” PLOS Medicine 6 (7): e1000097. https://doi.org/10.1371/journal.pmed.1000097.
Nafade, Vaidehi, Madlen Nash, Sophie Huddart, Tripti Pande, Nebiat Gebreselassie, Christian Lienhardt, and Madhukar Pai. 2018. “A Bibliometric Analysis of Tuberculosis Research, 2007–2016.” PLOS ONE 13 (6): e0199706. https://doi.org/10.1371/journal.pone.0199706.
“National Health Expenditure Data.” 2018. CMS.Gov Centers for Medicare & Medicaid Services. 2018.
Counting.” Journal of Informetrics 10 (4): 1178–95. https://doi.org/https://doi.org/10.1016/j.joi.2016.10.006.
Pritchard, A. 1969. “STATISTICAL BIBLIOGRAPHY OR BIBLIOMETRICS.”
JOURNAL OF DOCUMENTATION 25 (4): 348–+.
Raan, Ton van. 2014. “Advances in Bibliometric Analysis: Research Performance Assessment and Science Mapping.” In , 87:17–28.
Raina, Dhruv, and B M Gupta. 1998. “Four Aspects of the Institutionalization of Physics Research in India (1990–1950): Substantiating the Claims of Histortical Sociology through Bibliometrics.” Scientometrics 42 (1): 17–40. https://doi.org/10.1007/BF02465010.
Rezaee, Michael E, Heather A Johnson, Ricardo M Munarriz, and Martin S Gross. 2018. “Bibliometric Analysis of Erectile Dysfunction Publications in Urology and Sexual Medicine Journals.” The Journal of Sexual Medicine 15 (10): 1426–33. https://doi.org/10.1016/j.jsxm.2018.08.004.
Sweileh, Waleed M. 2018. “Bibliometric Analysis of Literature in AIDS-Related Stigma and Discrimination,” July. https://doi.org/10.1093/tbm/iby072.
Tricco, Andrea C, Ba’ Pham, and Nigel S B Rawson. 2008. “Manitoba and Saskatchewan Administrative Health Care Utilization Databases Are Used Differently to Answer Epidemiologic Research Questions.” Journal of Clinical Epidemiology 61 (2): 192–197.e12. https://doi.org/https://doi.org/10.1016/j.jclinepi.2007.03.009.
New York Times. 2018.
Whitepaper Using Bibliometrics: A Guide to Evaluating Research Performance with Citation Data. 2008. Thomson Reuters. https://books.google.com/books?id=fqDKXwAACAAJ.
Wilensky, GAIL R, and DANIEL C Walden. 1982. “National Medical Care Expenditure Survey*.” Annals of the New York Academy of Sciences 387 (1): 115–23. https://doi.org/10.1111/j.1749-6632.1982.tb17167.x.