ii
Abstract
Poor mental health in childhood can be chronic and have lasting effects on one’s life prospects. Despite its significant impact, many depressed adolescents underutilize healthcare resources. Recently, more research has been done looking at ways in which vocational education policies can provide students with a greater sense of self-efficacy, and therefore better mental health. This study adds to this current research by utilizing data from the National Longitudinal Survey of Youth 1997 (NLSY97) in multivariate regression analyses to examine whether participating in career and technical education (CTE) in secondary education may act as a protective measure against adolescent depression. Participation in CTE was defined by classifying secondary school students as either occupational investors, explorers, or
iii
Acknowledgements
I would like to thank Dr. Christine Durrance, my thesis advisor, for her constant support and guidance. She has taught me that it is normal and okay to make mistakes in research and that the important thing is to correct them. I will remember the skills that I have learned from Dr. Durrance as I move forward in the field of research. I would also like to think my second reader, Kristina Patterson-Marcinkevich, for advising me on how to understand and better analyze my data and providing me with great resources and feedback. Both of these individuals gave me the support and tools I needed to produce this thesis.
iv
TABLE OF CONTENTS
SIGNIFICANCE ... 1
LITERATURE REVIEW ... 4
Background ... 4
Demographics and Predictors of CTE Course-Taking ... 8
CTE Student Outcomes... 10
Adolescent Depression and School-Related Factors ... 12
DATA AND METHODS ... 15
Data Set and Procedures ... 15
Analytic Sample ... 16
Variables of Study... 17
Empirical Approach ... 20
RESULTS ... 22
Descriptive Results ... 22
The Relationship between Occupational Investing and Student Depression ... 24
The Relationship between Occupational Exploring and Student Depression ... 25
The Relationship between Occupational Concentrating and Student Depression ... 25
DISCUSSION ... 26
Discussion of Results ... 26
Policy Implications ... 29
v
LIST OF TABLES AND FIGURES
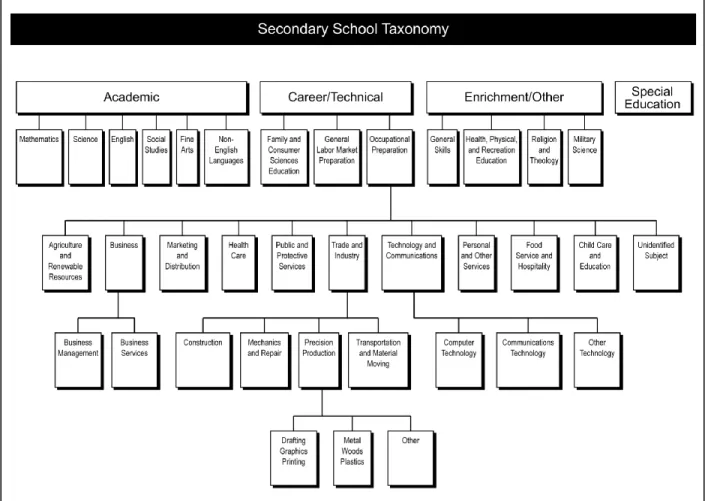
Figure 1 Secondary School Taxonomy of Single Labor Market Programs ...41 Table 1 Descriptive Statistics of Demographics of Students ...42
Table 2 Descriptive Statistics of the Mental Health of Students Classified by School and Student Characteristics...43 Table 3 Results of Multivariate Regression Analysis of the Effect of Being an Occupational Investor on Depression Scores ...44 Table 4 Results of Multivariate Regression Analysis of the Effect of Being an Occupational Investor on Depression Scores for Males and Females ...45 Table 5 Results of Multivariate Regression Analysis of the Effect of Being an Occupational Investor on Depression Scores for Juniors and Seniors ...46
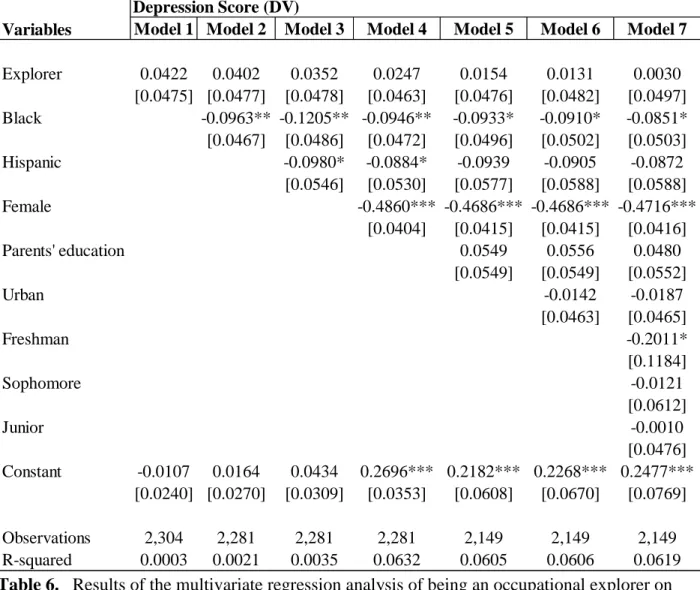
Table 6 Results of Multivariate Regression Analysis of the Effect of Being an Occupational Explorer on Depression Scores ...47
vi
1
Significance
Mental health policy in the United States permeates many policy issues because the effects of mental illness are so pervasive in citizens’ daily lives. Mental illness is often talked about with respect to crime and gun control, but it is also relevant to issues such as homelessness, economic productivity, health insurance, and overall public wellbeing. Depression is one of the most common types of mental illness among the United States population, with major depressive disorder (MDD) being the second largest contributor to the burden of disease (U.S. Burden of Disease Collaborators, 2013). Approximately 6.6 percent of adults experience at least one major depressive episode (MDE) per year (Hedden et al., 2015). Furthermore, depression affects people of all ages, with the rate of depression for people aged 12-17 being 5.7 percent, only 1.9 percentage points below the average for all ages (Pratt & Brody, 2014). In many cases, depression in adolescence can predict future depression as adults. Adolescents who show significant depressive symptoms are two to three times more likely to suffer from a major depressive episode in adulthood (Pine, Cohen, Cohen, & Brook, 1999). Additionally, major depression among adolescents has a 70% lifetime recurrence rate (Birmaher, Ryan, Williamson, & Brent, 1996).
2
& Bhatia, 2007). This has been shown to lead to lower economic prospects and an increased chance of being convicted of a crime (Trzesniewski et al., 2006). Adolescents suffering from depression may also turn to substance abuse as a way of self-medicating (Bhatia & Bhatia, 2007; Salom et al., 2016). Substance abuse and the possible poor school performance can contribute to an increased likelihood of dropping out of high school (Stoep, Weiss, Kuo, Cheney, & Cohen, 2003). Low self-esteem and depression can also have negative physical health effects in terms of poor cardiorespiratory health, being underweight, and poor self-perceived health (Trzesniewski et al., 2006).
The functional impairment that depression has on those who suffer from it creates a burden on the United States economy as a whole. Considering factors such as healthcare expenditures, loss of earnings, and disability benefits, the economic burden of serious mental illnesses has been estimated to be approximately $317 billion a year (Insel, 2008). This is not including things such as the cost of incarceration, homelessness, and early mortality. An earlier study found that depression alone contributes to a cost of almost $70 billion a year in direct healthcare costs, mortality costs associated with suicide, and workplace costs (Greenberg, Leong, Birnbaum, & Robinson, 2003). Over 60% of this economic burden was the result of missing work or being less productive at work because of depression.
3
cost, and stigma (Meredith et al., 2009). Adolescents, however, also have unique barriers such as the value placed on gaining independence and being autonomous as well as a more acute pressure to fit in with peers and to appear “normal” (Wisdom et al., 2006). Because of these unique barriers that often cause teenagers to minimize depressive symptoms and avoid seeking help, a more integrative systematic approach may help fill the gaps.
Because adolescents spend a majority of their weekday time in class settings, what courses students take and their success in them is a primary factor in their wellbeing. This importance of secondary course-taking is reflected in education policy that regulates how many and what type of classes students need in order to graduate. Recently, education policymakers have focused more on the potential benefits of Career and Technical Education (CTE). CTE is seen as a type of secondary education that gives students workforce skills to help them better succeed post-graduation whether they continue on to higher education or go straight into the labor market. This increased focus on CTE can be seen in legislation such as the Carl D. Perkins Career and Technical Education Improvements Act of 2006 (Perkins IV), the fourth and most recent revision of the original Vocational Education Act (Dortch, 2012). Along with reauthorizing many accountability measures put in place by prior versions, this law also authorized the Basic State Grants program. This program provides grants to states specifically to develop, implement, and improve CTE programs, services, and activities (Dortch, 2012). While past education policy such as this has typically focused on the future success of students in the workforce, secondary education has classically also been used to focus on the health of students, which impacts future outcomes as well.
4
than direct healthcare options, which in many cases seem underutilized. Therefore, using data from the National Longitudinal Survey of Youth 1997 (NLSY97) this study hopes to identify potential secondary education policy that may have positive impacts on adolescent mental health. This study adds to the literature by examining the relationships between career and technical education (CTE) and self-reported depression levels of high school students. Specifically, this study will address the research question: Is participation in CTE in high school associated with lower measures of depression in these students?
This paper will begin by reviewing the relevant literature in this area. There is little prior research on the focus of this study, but I will review the related literature on CTE and school effects on adolescent mental health. Second, this paper will describe the NLSY97 data set and relevant measures, as well as the methods that will be used to analyze the relationship between the independent and dependent variables. Next, the results will be presented with relevant tables and figures. Finally, this paper will conclude with recommendations for education and mental healthcare policy.
Literature Review
Background
5
urban communities. Through this type of education students are able to learn skills while also engaging in practical knowledge by contributing to the needs of the communities. Other, more non-traditional types, of CTE include Tech Prep (the integration of the last two years of secondary school and the first two years of postsecondary education, resulting in a degree or certificate), career academies, and career magnet schools. Career academies are described as schools-within-a-school, fostering tight-knit learning communities that create “a more
personalized and supportive learning environment for students and teachers” (Kemple & Snipes, 2000, p. vii). While career magnets are similar to career academies, magnets are typically larger and while they may be housed within another school they may also be free-standing (Castellano et al., 2003). Magnet schools also originated as a desegregation effort to encourage suburban students to attend schools in urban districts, whereas career academies began as a dropout prevention strategy (Castellano et al., 2003). These types of CTE are the most common, but as a broad category, CTE includes many unique types of learning that integrate academic and
technical education.
6
Comprehensive high schools, the most common secondary schools in the United States, have traditionally grouped students (either intentionally or unintentionally) into these four course tracks (Heck, Price, & Thomas, 2004). Lewis and Cheng (2006) framed tracking as assigning students social positions, based on academic performance, in which members of particular positions share similar relations with other actors or groups within the school. Students grouped into the “vocational” track have typically been viewed as having a social position that has signified lower expectations (Feinberg & Horowitz, 1990; Lewis & Cheng, 2006) and tended to include those who were at a higher risk of dropping out of high school and assumed to not be pursuing postsecondary education (Silverberg, Warner, Fong, & Goodwin, 2004). The traditional view of student grouping, however, has undergone reform in the past few decades, with a
growing emphasis on integration between tracks. With the rise in economic globalization, work such as manufacturing and farming that does not require postsecondary education is much more limited for high school graduates in the United States, and this has changed how we as a society value education (Castellano et al., 2003). Students today are now largely encouraged to have strong academic foundations and an ability to apply this knowledge in a career context (Fletcher, 2012). In addition to this increased focus on academic skills, there have been efforts to erase the stigma often attached to vocational education, seen in the urging of experts to use the term
career and technical education (CTE) in place of vocational education (Lynch, 2000). There has also been a greater focus on accountability measures for students to meet higher standards, following the pattern of comprehensive school reform where federal funding was for the first time being tied to student performance (Castellano et al., 2003).
7
general reforms to the school structure. Two notable pieces of CTE legislation were the Carl D. Perkins Vocational and Applied Technology Education Act of 1990 and its reauthorization in 1998. These acts mandated that federally-funded CTE programs must include “curricula that integrate vocational and academic methodologies and curricula that provide a coherent sequence of courses through which academic and occupational skills may be measured,” as well as the assessment of programs with the development of “performance standards and measures and program improvement and accountability” ("Carl D. Perkins Vocational and Applied Act," 1990). While these statutes encouraged the implementation of new vocationalism, the program requirements were very broad and much discretion was left to districts and schools. Lewis and Cheng (2006) found that the sentiment of higher levels of government in accepting a more integral approach to CTE is mirrored in school principals, who are pivotal in affecting curriculum change. However, as of 1997, only 45% of high schools had implemented the
curriculum integration described in the Perkins legislation (Levesque, Lauen, Teitelbaum, Alt, & Librera, 2000). This demonstrates the state of CTE-academic integration during the time period of interest for my present study.
Other CTE reforms were not driven by federal mandates, but still worked to restructure high schools. Included in these reforms was the shift in career academies from dropout
8
tracks. These pathways are intended to provide a rigorous program of study with high-level academics, technology applications, and work-based learning (Castellano et al., 2003). Demographics and Predictors of CTE Course-Taking
Course-taking patterns of high school students are a result of complex interactions between student interests, parental pressure and influence, prior academic achievement, workforce needs, cultural preconceptions, structural characteristics of high schools, and other underlying mechanisms (Friedkin & Thomas, 1997; Heck et al., 2004; Lewis & Cheng, 2006; Oakes & Guiton, 1995). In general, Black students are more likely to participate in CTE than non-Black and non-Hispanic individuals (Friedkin & Thomas, 1997; Heck et al., 2004; Zirkle & Fletcher, 2009). The research results on CTE participation by Hispanic students is mixed, where some findings suggest that Hispanic students tend to have a greater emphasis on CTE courses (Friedkin & Thomas, 1997; Heck et al., 2004) and others suggest that they have a more general course framework (Zirkle & Fletcher, 2009).
Using data from a nationally representative sample of high school students (High School and Beyond), Friedkin and Thomas (1997), analyzed the course-taking patterns of 10,786
students and found that there are eight general pathways that students follow, which are made up of four categories each containing a regular and technical form: trade, vocational-business, academic-Spanish, and academic-French. The researchers found a relationship between sex, socioeconomic status (SES), and race/ethnicity and student course-taking patterns. Females were overrepresented in the business pathways and were least represented in the most
9
students were overrepresented in the academic-French positions and in the regular vocational-business position, and they were underrepresented in the lower vocational position (trade). The authors found that Black students were evenly distributed across the course pathways. However, Hispanic students’ distribution was inversely related to White students, where they were
underrepresented in the academic-French and the regular vocation business positions and overrepresented in the vocational-trade position (Friedkin & Thomas, 1997).
In a smaller, more recent study of one urban Hawaiian school made up of 1,500 students, Heck et al. (2004) found similar course-taking patterns in terms of racial and ethnic minority students and those of lower SES taking less academically rigorous classes. Their course profiles were similarly defined by the emphasis on Tech-Prep courses. Interestingly, they also found that the business-oriented profile (which had average academic rigor) contained an overrepresented majority of female students. The authors also found that students in the less academically rigorous profiles had lower SAT scores and GPAs and were much less likely to plan to participate in postsecondary education than those in the more rigorous profiles.
The two previous studies purposefully disregarded formal tracking in consideration to what classes students take. They make the argument that most high schools no longer track students as strictly as they had in the past, and many track-oriented models are limiting because students’ course work is most often not restricted to one track (Heck et al., 2004). In
10
free and reduced-price lunch were more likely to have a CTE-focused track as the dominant curriculum. This also translated into principals’ expectations of work as the dominant post-graduate destination in schools that had lower income students. These expectations and other opinions of faculty, in combination with achievement scores, signal to students what they are capable of and what type of curriculum for which they are best suited. Therefore, while their choice may in fact be the most important factor in track assignment, this is often biased by school-level influences.
CTE Student Outcomes
In general, the greater focus on CTE in secondary schools has seemed to have a positive impact in a number of aspects of students’ lives. Students who earn three or more credits in CTE are more likely than general track graduates to enter science, technology, engineering, and math (STEM) career fields (Fletcher, 2012) and their short-term income returns (4-8 years after graduation) are higher than all other education tracks (Hughes, Bailey, & Karp, 2002; Zirkle & Fletcher, 2009). By observing the occupational earnings of 22- to 26-year-olds, Zirkle and Fletcher (2009) found that on average, CTE graduates made $3,279 more annually that their general track counterparts. In a systematic review on the impact of school-to-work initiatives (comprised of career-related academies, career development activities, and work experience linked to school), Hughes et al. (2002) concluded that in addition to higher wages, these students were more likely to gain employment. In a follow-up evaluation of one North Carolina school-to-work program, employers reported that former participants required less training and had better work ethic than other new hires (Metis Associates Inc., 1999).
11
participate in these programs (Hughes et al., 2002). Looking at the impact of career academies, specifically, Maxwell and Rubin (2002) found that these students have educational outcomes similar to those of students participating in academic college-prep tracks, despite the fact that career academies draw a disproportionate number of students who have academic difficulties. Racial and ethnic minority students may especially benefit from these initiatives, as Rivera-Batiz (2003) demonstrated by looking at data from a national longitudinal survey. He concluded that for black and Hispanic students in particular, participation in school-to-work initiatives
motivated future course-taking in more rigorous courses in math and science.
Finally, participation in CTE has been demonstrated to positively affect students’ overall development. Maxwell and Rubin (2002) found that participating in career academies and CTE significantly affected the extent to which students felt that they had gained confidence about their abilities. In their systematic review of prior research, Hughes et al. (2002) also found that school-to-work initiatives increased students’ self-confidence in their skills and their interest in school through better understanding its importance. They also noted that career academies in particular provided a supportive school environment, providing motivation for positive student behavior.
Although these studies give insight into some important positive student outcomes of CTE, no studies have attempted to address the direct impact that these programs have on student mental health and adolescent mental illnesses. As noted by Zirkle and Fletcher (2009), tracking can lead to lower self-esteem. However, when done effectively CTE programs can help
12
provides that affects students’ sense of self and overall mental health. The goal of this paper is to attempt to understand this complex relationship in the context of adolescent depression.
Adolescent Depression and School-Related Factors
The causes of depression are still largely a mystery to the psychological world. While many have been proposed, researchers often recognize that it is the interaction of multiple factors, rather than one explanation alone, that lead to the onset of depression (Hilsman & Garber, 1995; Nevid, Rathus, & Greene, 2018). This is best modeled in terms of the diathesis-stress model, which recognizes that those who present symptoms of depression most often have a susceptibility (Nevid et al., 2018). This susceptibility has been attributed to biological (Dalton, Hammen, Najman, & Brennan, 2014; Lacerda-Pinheiro et al., 2014; Maciejewski et al., 2017; Michalek et al., 2017) and cognitive (Braet, Vlierberghe, Vandevivere, Theuwis, & Bosmans, 2013; Hyland, 2010; Morris, Ciesla, & Garber, 2008) factors. Depending on the amount of diathesis an individual has, they may be more or less likely to develop depression in the face of stressors (Nevid et al., 2018). The stressors can range from daily life stressors or traumatic events, and the likelihood that they will lead to a development of depression is dependent, again, on the strength of the predisposition of the individual. So, although the exact causes of
depression are weakly understood, it is widely acknowledged that these two variables, diathesis and stress, interact with each other to manifest into mental illnesses such as depression.
self-13
reported depression among adolescents. Additionally, these researchers found that subjective performance measures such as high perceived loading of schoolwork and difficulties in self-reliant school performance also significantly predicted self-reported depression. However, this is more so the case for girls, than boys. This sex difference is somewhat unsurprising given the findings that depressive symptoms in girls tend to result from more ‘internalizing’ factors, such as low self-esteem, perceived poor academic achievement, and school stress (Pelkonen,
Marttunen, & Aro, 2003; Undheim & Sund, 2005). In contrast, adolescent boys’ depressive symptoms stem more from ‘external’ factors such as lack of peer relationships (Pelkonen et al., 2003). Objective performance measures can also interact with cognitive diatheses and subjective measures to result in a greater likelihood of developing depression. Preadolescent children who tend to attribute the causes of negative events to global, stable, and internal factors or perceive a lack of academic control and competence express more distress for a longer period than those without such cognitions (Hilsman & Garber, 1995). This finding suggests that this same
cognitive diathesis-stress model in relation to school stressors may continue into adolescence to eventually manifest into depressive symptoms.
14
that 57% of depressed students and 74% of students who were co-experiencing the illnesses had low school commitment. While causality could not be inferred in this cross-sectional study, it demonstrates the important bidirectional relationship of school on adolescent mental health and mental health on students’ feelings towards academics.
Negative school factors do not just predict depression in adolescents, but certain positive factors can be protective. High GPA and GPA improvement can serve as a protective factor for severe depression in adolescent boys (Fröjd et al., 2008). Additionally, high perceived social support from teachers and classmates can help protect students against stress (Dubow, Tisak, Causey, Hryshko, & Reid, 1991). The current study hopes to add more to this limited collection of literature on the protective factor of school-related characteristics for adolescent depression.
No studies to date have attempted to look at how student course-taking can act as a possible protective factor against adolescent depression, especially among CTE students. There is, however, prior research investigating the influence of career pathways on student self-efficacy. Self-efficacy is described as an individual’s “beliefs about his or her capacity to
achieve” (Chang & Edwards, 2015, p. 36). This belief in one’s abilities is important in emotional regulation and academic self-efficacy plays a particularly important role in adolescent
depression. This was demonstrated by an analysis done by Muris (2002) who found that academic self-efficacy – in comparison to social or emotional self-efficacy – was the only domain related to depression in adolescents.
In a qualitative study, Stipanovic, Stringfield, and Witherell (2017) looked into the effects of career pathways on students’ self-efficacy. They found that career pathways, in combination with career counseling, increase students’ sense of career and academic
15
major – and wished to be challenged more academically. These students also wanted to take more challenging courses with the purpose of preparing themselves for college. The authors concluded that career pathways encourage overall higher drive in students to succeed and a greater belief in their ability to meet challenges. This study provides an important model of the positive relationship between CTE and career pathways and self-efficacy. Because of the protective effects that high self-efficacy has on depression, this could provide support for a further protective link between CTE and levels of depression among students by providing students with a greater sense of self-efficacy in academics and career skills.
I hope to build on the model presented above and consider the relationship (if any) between CTE and adolescent depression. My hypothesis, then, is grounded in the findings of this qualitative research on the association between CTE and self-efficacy. I theorize that
participating in career pathways has a protective effect on the development of depression in adolescence because it will lead to a higher sense of academic and career self-efficacy in students. In this study, I use quantitative, multivariate regression analysis in order test the relationship between CTE and adolescent depression. I also use a population-representative sample to in order to have greater external validity than prior studies.
Data and Methods
Data Set and Procedures
16
of this study were 12 to 18 years old at the time of the first interview in 1997. The interviews were conducted using a computer-assisted personal interview (CAPI) instrument, which guided the interviewer through an electronic questionnaire. For most of the interview, the interviewer entered the respondent’s answers. During sensitive portions of the interview, however, respondents entered their answers directly into the computer. NLSY97 has focused on gathering information in a number of areas including demographics, education and employment, family, health, crime, and beliefs, and attitudes.
At two points in time, NLSY97 sought high school transcripts for respondents who had either graduated from high school or were 18 years or older and no longer enrolled in high school and for whom interviewers had secured consent for transcript release. Transcripts were first collected in 1999-2000 and then again in 2004 for a combined total of 6,232 respondents. 2,752 transcripts were not obtained for reasons such as refusal by the school or district, student records not found, unsecured permission, and school not identified. Using the available transcript data, survey staff constructed histories of courses taken and coded these courses using the Revised Secondary School Taxonomy (SST-R; Figure 1) (Bradby, 2007).
Analytic Sample
17
freshmen or sophomores who met the criteria for CTE participation per according to my measures, I focused primarily on juniors and seniors in my analysis.
Variables of Study
Outcome Variable: Student Depression Score. The dependent variable in this study seeks to measure depression in adolescents. This standardized measure was developed based on the questions that the NLSY began asking participants in the fourth round of interviewing. These questions are a five-item abbreviated version of the Mental Health Inventory (MHI-5), shown to have a Cronbach’s alpha of 0.82 (Ritvo et al., 1997). Using a four-point Likert scale (1=All of the time, 4=None of the time), respondents answered the following questions:
How much of the time during the last month have you been a very nervous person? How much of the time during the last month have you felt calm and peaceful? How much of the time during the last month have you felt downhearted and blue? How much of the time during the last month have you been a happy person?
How much of the time during the last month have you felt so down in the dumps that nothing could cheer you up?
In order to develop the measure used in this study, the “happy” and “calm” measures were reversed so that 1=none of the time and 4=all of the time. This ensured that a higher score would represent less depressed and a lower score would represent more depressed. These five variables were then aggregated:
Da = nervous + calm + blue + happy + down
where Da is the aggregated depression score that ranged from 1-20. Then, the aggregated scores
were standardized on a 100-point scale:
Ds = ((Da – 5)/15) * 100
The standardized depression score, Ds, was then transformed into a z-score:
𝐷𝑧 =
18
where 𝐷𝑧is the standardized z-score of the depression index, 𝐷̅𝑆 is the mean depression score for
the sample (68.82), and 𝑆𝐷 is the standard deviation of the depression score (16.98). Therefore,
the final outcome measure, 𝐷𝑧, represents standard deviations from the mean.
19
used this source to define my CTE participation variables because their definition of occupational concentrators reflects the most commonly used standard in prior research, and they provide ways to categorize students as CTE participants other than only concentrating in a SLMP.
This study specifically defined students by the number of CTE credits that they had earned by Fall of 2000 (when the dependent variable, depression score, began being measured). Because of the nature of the NLSY97 data, I used information about the term in which each course took place, in order to limit the cumulative retrospective data in this way. For each course, I classified which term (1-27) the course was taken in and the academic year of that respective term, which varied for each student. For example, if a student’s fifth course on their transcript was taken during term 2 and term 2 was during the academic year of 1999, that course would have been classified as having been taken in 1999. Any courses that students took whose academic year was later than 2000 were then excluded. The courses that were taken before Fall of 2000 were converted into their Carnegie Unit equivalent, and this data is what I then used to characterize students’ CTE participation based on the following definition.
20
Occupational Explorer. One sub-group of occupational investors is occupational explorers, which are defined by the U.S. Department of Education as students who “graduate earning three or more occupational credits in more than one program area” (Silverberg et al., 2004, p. 24). Therefore, this variable was created by including students who were classified as investors but did not specialized in a single occupational concentrator category (N=598).
Occupational Concentrator. The final characterization of CTE course taking,
occupational concentrators, is defined by the U.S. Department of Education as students who have earned three or more credits in a SLMP area (Figure 1) (Silverberg et al., 2004). Occupational concentrators could concentrate in the career pathways defined by the SST-R, the method by which the NLSY97 chose to categorize students’ courses. While the original 1998 taxonomy divided occupational preparation courses into nineteen categories, this study condensed these into fifteen (Table 2). Students were defined as occupational concentrators if they earned three or more credits in a program by Fall 2000 (N=139). The career clusters were not mutually exclusive and so theoretically students could have concentrated in multiple programs.
Empirical Approach
This study aims to isolate the relationship between student participation in CTE and depression. Due to the limited prior research on this topic, I began with a descriptive analysis of the data. I looked at the student and school composition of the multiple forms of CTE course participation as well as summary statistics (mean, standard deviation, minimum, and maximum) of the depression measures for student, school, and course-taking characteristics.
In order to further investigate the relationship between participation in CTE and depression, I ran cross-sectional, multivariate regressions for each independent variable of interest:
21
where Y is a student i’s depression z-score, X1 is a dummy variable defining students as either 1
(met the criteria for the respective CTE student definition) or 0 (if they did not meet the criteria), and Xn represents the various individual-level or school-level control variables added to the
regression. ei is the error term.
22
For each independent variable of interest, I first ran standard cross-sectional, multivariate regressions that included my full analytic sample of students who were enrolled in public high school during the 4th round of interviewing (November 2000 – May 2001). Because of large differences between male and female depression incidence, I then analyzed male and female students separately. I also analyzed juniors and seniors separately to consider if there might be an effect on one group that was not evident in analyzing the whole analytic sample.
Results
Descriptive Results
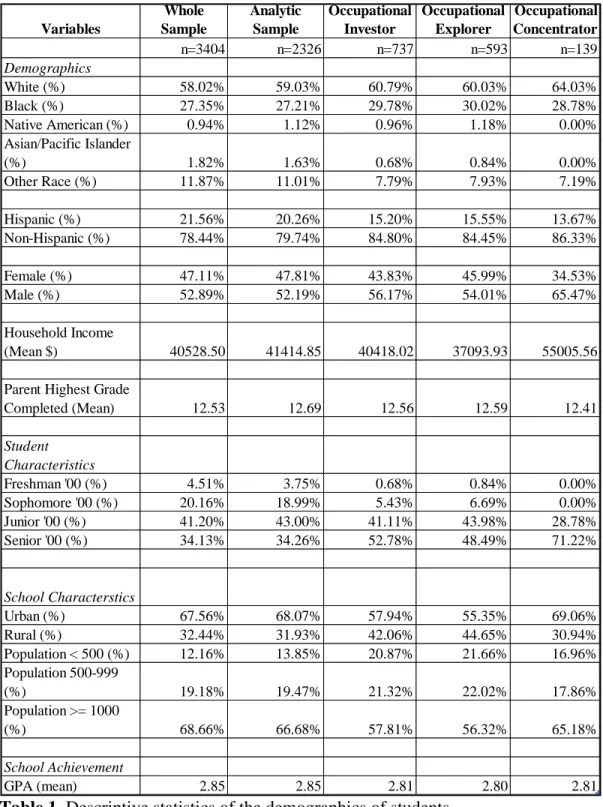
I first looked at descriptive statistics to better understand what kind of students were investing, exploring, and concentrating in CTE (Table 1). For most of the demographics, the occupational investor and explorer categories seemed similar to the whole sample. The main differences appeared for students that were characterized as occupational concentrators. White students were overrepresented in the concentrator category (64.03%), and no concentrators were Asian/Pacific Islander or Native American students – though the small overall proportion of these groups may account for this. Female students were also greatly underrepresented as occupational concentrators (34.53%). Students in the “other race” category and Hispanic students were underrepresented in CTE as a whole. These demographics seem to show that while many minority students (Native Americans and Asian/Pacific Islanders, and females) are participating in CTE, they may not be focusing on one career pathway. In contrast, white and male students were more frequently focusing their CTE course-taking in one career cluster.
23
schools. With this in mind, urban students are actually underrepresented as investors and explorers and rural students are overrepresented in these categories compared to their respective proportions of the whole samples. This is also reflected in school size; whereas, students attending smaller schools made up a much higher proportion of investors (20.87%) and explorers (21.66%) than they did the whole sample (13.83%). While students attending schools with a population of 500-999 people were similar to the whole sample, schools with over 1000 students made up a smaller proportion of investors (57.81%) and explorers (56.32%) than the whole sample (66.68%). These results seem to show that small schools – typically in rural areas – seem to have more students involved in CTE, in general. However, very large and urban schools seemed to have fewer students participating in CTE, but those that were preferred focusing in a single program area rather than exploring multiple SLMP.
In general, there were relatively few occupational concentrators (n=139), demonstrating that this type of classification is difficult to attain because of the time and dedication that is required to earn three credits in a single SLMP. By nature, very few students who were freshmen during the fourth round of interviewing had participated in CTE by Fall of 2000, making up only 0.68% of investors. While there were slightly more sophomores as investors (5.43%) and explorers (6.69%), there were still no sophomore concentrators. The proportions of junior and senior explorers between investor and explorer were about equal (43.98% and 48.49%, respectively), but many more occupational concentrators were seniors (71.22%) than there were juniors (28.78%).
24
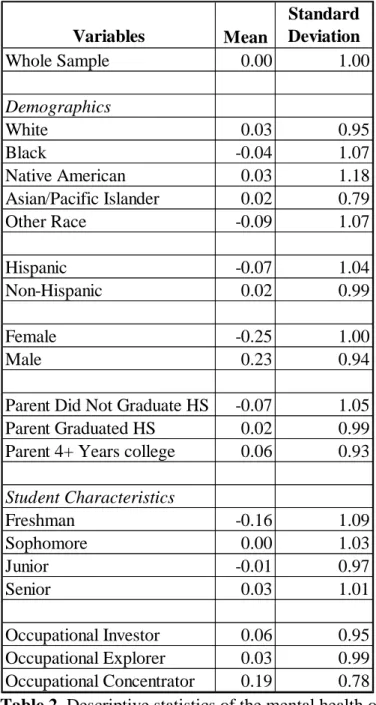
average, indicating that females seem much more depressed than males. While the mental health of occupational investors and explorers did not seem too far from average, occupational concentrators had much better mental health scores (0.19). Freshmen appear to have worse depression scores than the average student (-0.16). The other characteristics did not have much variation. Students in the “other race” category, Hispanic students, and students whose parents had not graduated high school also had slightly lower depression scores. Rural students and students from small schools had higher-than-average depression scores, though the difference was small. The final thing that was interesting was that while students with average GPAs had slightly better depression scores, students that fell both below and above the average GPA range tended to have worse depression scores.
The Relationship between Occupational Investing and Student Depression
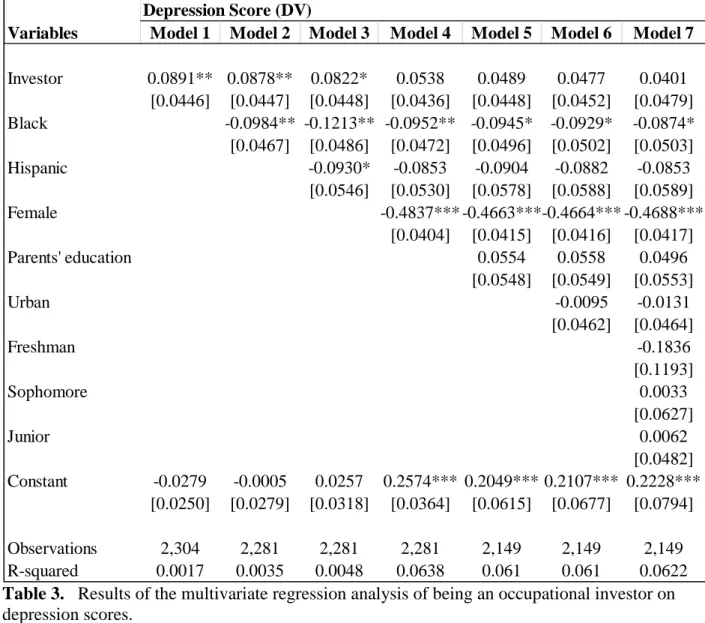
Table 3 shows the relationship between being an occupational investor and student depression. In Column (1), there seems to be a statistically significant positive, but small effect on adolescents’ depression scores for a student who is an occupational investor having on average a depression score 0.089 higher than a student who is not an occupational investor (p<0.05). However, this relationship decreases in significance when race and ethnicity are included (p<0.1) and becomes statistically insignificant when adding sex (columns (2) and (3)). Because of the importance that sex, specifically, had in this analysis (p<0.01), I ran a second analysis that stratifies the sample by sex (Table 4). However, I did not identify a relationship between being an occupational investor and depression score for either the male or female subsample.
25
year of secondary education than others. There was a significantly positive and relatively large effect size for senior investors (β=0.173, p<0.05), but no significant results for juniors. This means that being an investor as a senior is associated with a 0.173 increase in a students’ depression score. Therefore, seniors who are investors are, on average, likely to have a depression score that is 0.172 standard deviation above non-investors. Furthermore, the relationship of occupational investing in respect to depression remains significant for seniors even when controlling for the full set of covariates (column (6)).
The Relationship between Occupational Exploring and Student Depression
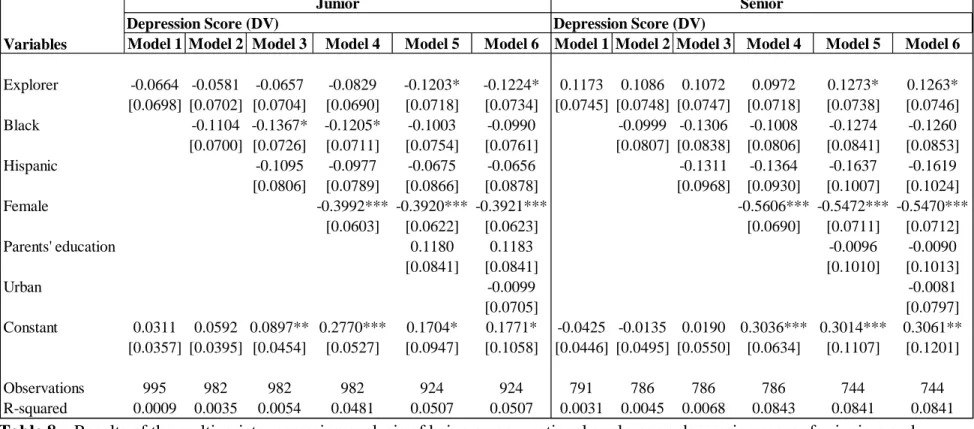
Table 6 shows the relationship between being an occupational explorer on depression for the whole sample. I fail to identify a statistically significant relationship between occupational exploring and depression score (Table 6). This finding persists even when I stratify by sex (Table 7). However, what continues to be important in respect to depression is being an occupational explorer when I stratify by grade level (Table 8). This type of CTE participation has an impactful relationship on depression for juniors and seniors. What is interesting is that these significant effects are in opposite directions so that being an occupational explorer has a positive impact on mental health for seniors (β=0.1263, p<0.1) but it has negative effects for juniors (β = -0.1224, p<0.1). Therefore, while senior explorers have, on average, depression scores that are 0.1263 standard deviation above non-explorers, junior explorers have depression scores that are on average 0.1224 below non-explorers. These effects only appear after controlling for parents’ education (which is a proxy for parental income).
The Relationship between Occupational Concentrating and Student Depression
26
depression scores (β=0.1998, p<0.05) in column (1). However, the significance of this
relationship disappears when controlling for sex (column 4), demonstrating that a large portion of the effect of being a concentrator on mental health came from the fact that males tend to be concentrators more often and also have better mental health in general. Though, when looking at males and females separately (Table 10) concentrating in a SLMP does not seem to be
significantly related to the mental health of either group. This is also true when looking at juniors and seniors (Table 11). Neither group’s depression was significantly affected by concentrating in a career cluster.
Discussion
Discussion of Results
27
Black students, on the other hand, had a fairly even distribution across the different types of CTE participation. This was different than the conclusion that Zirkle and Fletcher (2009) made, using the same data set, that African American students were more likely to participate in CTE than non-Black/non-Hispanic individuals. However, they defined CTE participation narrowly by only including occupational concentrators whereas my study considered multiple ways in which students could participate in CTE. In doing this, the present study actually found that white students were slightly more likely to participate in pa and particularly to concentrate in a SLMP.
The results of this study are also consistent with prior research findings that female adolescents have much higher reported rates of depression than males (Nolen-Hoeksema & Girgus, 1994). The descriptive mental health data also suggested that occupational concentrators have much better depression scores as well, compared to the average. By looking at the course-taking demographics, however, it can be concluded that this is because males are greatly overrepresented in this category, and therefore their inherent better mental health may account for a lot of the above-average depression score. Another interesting observation in these data was that freshmen had much worse depression scores than average. While there does not seem to be much research directly on the mental health of high school freshmen, it has been shown that big life changes (such as entering high school) can increase stress and lead to mental health problems (Nevid et al., 2018).
28
to be significant when looking at junior occupational explorers. Because of the lack of research on this specific topic, there does not seem to be evidence as to why this might be the case. It might be the case that juniors exploring CTE are more unsure about their future and therefore may feel overwhelmed by the career-oriented classes and less sure of their capabilities. Seniors, in contrast, showed positive relationships between investing and exploring and their depression scores. This might be explained by the fact that as students are beginning to think more seriously about post-graduation, they may feel more secure in the career decision-making self-efficacy due to their prior occupational education and may be more confident in their future success (Gilstrap, 2016; Stipanovic et al., 2017). However, as with juniors, there is little prior research on this, and therefore this theory is mostly speculative.
When looking at the effect that concentrating in a single career cluster had on adolescent depression scores, it did not seem to have a significant effect on depression scores. This seems contradictory to the findings of Stipanovic et al. (2017), who found that students who
29
be the logic framework may be more complex than the original hypothesis suggested. While self-efficacy has been shown to be an important factor in depression, there may be other variables that the present study did not take into account. Thus, the link between the findings of Stipanovic et al. (2017) and this research may not be substantially comparable. A final major difference between these two studies is the nature of the research itself. While Stipanovic et al. (2017) conducted a qualitative study, the present study utilized multivariate regression. Thus, this study may look at the relationship, or lack thereof, of participation in career pathways and students’ internal psychology more generally among a larger, more diverse sample.
Policy Implications
30
Policymakers may also want to be cognizant of the differences in CTE participation among different demographic groups. For example, a disproportionate number of females are not partaking in CTE concentration and Hispanic students are not engaging in CTE as much as non-Hispanic students. Policymakers may want to consider targeted programs to recruit and engage these groups of students more closely with CTE and career pathways.
Limitations and Further Research Implications
Because this analysis was cross-sectional, it did not take into account changes in students’ depression levels. Therefore, this study did not take into account the change in or stability of adolescents’ mental health from when they began high school to the time that the depression score was measured. Because depression may be relatively stable throughout
adolescence (Verhoeven, Sawyer, & Spence, 2013), the depression scores that this study presents may represent mental health prior to CTE participation. Therefore, there may be a threat to internal validity in the form of reverse causation in this study since depression could lead to different choices about course taking. This research area, therefore, would benefit from longitudinal growth-based analysis comparing initial depression levels with post-CTE
participation depression levels. Another limitation of this cross-sectional data was that in regards to juniors, it was unable to differentiate between students with an intention to become a
31
seem likely that a one-year difference would explain such a large variance, there is the possibility that something significant could have impacted only one of the groups that could have affected CTE course-taking or depression levels.
The way in which the independent variables of interest were defined may be
problematic. Prior research has historically adopted the characterizations used in this study when measuring CTE participation; however, these definitions are relatively arbitrary because there is no standard nationwide criteria for characterizing CTE students (Aliaga et al., 2014).
Furthermore, there has been some debate about the best practice of number of credits to require when defining investors, explorers, and concentrators. Some researchers have even rejected of the use of transcript data at all and advocate instead for subjective student self-reporting of career pathway identification (Stone III & Aliaga, 2007). While this study grounded the
operationalization of CTE participation in prior research, more research about this topic should be done utilizing other, less common, definitions.
32
References
Aliaga, O. A., Kotamraju, P., & Stone III, J. R. (2014). Understanding Participation in Secondary Career and Technical Education in the 21st Century: Implications for Policy and Practice.
The High School Journal, 97(3), 128-150.
Bhatia, S. K., & Bhatia, S. C. (2007). Childhood and adolescent depression. Am Fam Physician, 75(1), 73-80.
Birmaher, B., Ryan, N. D., Williamson, D. E., & Brent, D. A. (1996). Childhood and adolescent depression: A review of the past 10 years .1. Journal of the American Academy of Child and Adolescent Psychiatry, 35(11), 1427-1439.
Bishop, J. H., & Mane, F. (2004). Raising Academic Standards and Vocational Concentrators: Are They Better Or Worse Off? . Retrieved from Ithaca, NY:
http://digitalcommons.ilr.cornell.edu/cahrswp/16
Bradby, D. (2007). The 2007 Revision of the Career/Technical Education Portion of the Secondary School Taxonomy (NCES 2008-030 ). Washington DC: U.S. Department of Education.
Braet, C., Vlierberghe, L. V., Vandevivere, E., Theuwis, L., & Bosmans, G. (2013). Depression in Early, Middle and Late Adolescence: Differential Evidence for the Cognitive
Diathesis–Stress Model. Clinical Psychology & Psychotherapy, 20(5), 369-383. doi:10.1002/cpp.1789
33
Bureau of Labor Statistics. (1997-2013). National Longitudinal Survey of Youth 1997 cohort. Retrieved from: https://www.nlsinfo.org/content/cohorts/nlsy97
Carl D. Perkins Vocational and Applied Act, Pub. L. No. 101-392 § sec. 2, 756 Stat. (1990). Castellano, M., Stringfield, S., & Stone, J. R. (2003). Secondary Career and Technical Education
and Comprehensive School Reform: Implications for Research and Practice. Review of Educational Research, 73(2), 231-272. doi:10.3102/00346543073002231
Chang, Y., & Edwards, J. K. (2015). Examining the Relationships Among Self-Efficacy, Coping, and Job Satisfaction Using Social Career Cognitive Theory:An SEM Analysis. Journal of Career Assessment, 23(1), 35-47. doi:10.1177/1069072714523083
Dalton, E. D., Hammen, C. L., Najman, J. M., & Brennan, P. A. (2014). Genetic susceptibility to family environment: BDNF Val66met and 5-HTTLPR influence depressive symptoms.
Journal of Family Psychology, 28(6), 947-956. doi:10.1037/fam0000032
Dortch, C. a. (2012). Carl D. Perkins Career and Technical Education Act of 2006 : Background and performance. Retrieved from
http://heinonline.org/HOL/P?h=hein.crs/crsmthaabto0001&i=1
Dubow, E. F., Tisak, J., Causey, D., Hryshko, A., & Reid, G. (1991). A Two-Year Longitudinal Study of Stressful Life Events, Social Support, and Social Problem-Solving Skills: Contributions to Children's Behavioral and Academic Adjustment. Child Development, 62(3), 583-599. doi:10.2307/1131133
34
Fletcher, E. C. (2012). Predicting the Influence of Demographic Differences and Schooling Experience in Adolescence on Occupational Choice in Adulthood. Career & Technical Education Research, 37(2), 121-139. doi:10.5328/cter37.2.121
Friedkin, N. E., & Thomas, S. L. (1997). Social Positions in Schooling. Sociology of Education, 70(4), 239-255. doi:10.2307/2673266
Fröjd, S. A., Nissinen, E. S., Pelkonen, M. U. I., Marttunen, M. J., Koivisto, A.-M., & Kaltiala-Heino, R. (2008). Depression and school performance in middle adolescent boys and girls. Journal of Adolescence, 31(4), 485-498. doi:10.1016/j.adolescence.2007.08.006 Gilstrap, D. A. (2016). The influence of perceived barriers, perceived social support, and career
decision-making self efficacy on high school juniors' and seniors' postsecondary plans.
(Leadership and Counselor Education Ph.D.), The University of Mississippi, Ann Arbor. ProQuest Dissertations & Theses Global database.
Greenberg, P. E., Leong, S. A., Birnbaum, H. G., & Robinson, R. L. (2003). The economic burden of depression with painful symptoms. Journal of Clinical Psychiatry, 64(suppl 7 ), 17-23.
Heck, Ronald H., Price, Carol L., & Thomas, Scott L. (2004). Tracks as Emergent Structures: A Network Analysis of Student Differentiation in a High School. American Journal of Education, 110(4), 321-353. doi:10.1086/422789
Hedden, S. L., Kennet, J., Lipari, R., Medley, G., Tice, P., Copello, E. A. P., & Kroutil, L. A. (2015).
Behavioral health trends in the United States: Results from the 2014 National Survey on
35
Hilsman, R., & Garber, J. (1995). A test of the cognitive diathesis-stress model of depression in children: Academic stressors, attributional style, perceived competence, and control.
Journal of Personality and Social Psychology, 69(2), 370-380. doi:10.1037/0022-3514.69.2.370
Hoagwood, K. E., Olin, S. S., Kerker, B. D., Kratochwill, T. R., Crowe, M., & Saka, N. (2007). Empirically Based School Interventions Targeted at Academic and Mental Health Functioning. Journal of Emotional and Behavioral Disorders, 15(2), 66-92. doi:10.1177/10634266070150020301
Hughes, K. L., Bailey, T. R., & Karp, M. M. (2002). School-to-work: Making a difference in education. Phi Delta Kappan, 84(4), 272-279.
Hyland, M. E. (2010). Network origins of anxiety and depression. Behavioral and Brain Sciences, 33(2-3), 161-162. doi:10.1017/S0140525X10000622
Insel, T. R. (2008). Assessing the economic costs of serious mental illness. American Journal of Psychiatry, 165(6), 663-665.
Kataoka, S. H., Stein, B. D., Jaycox, L. H., Wong, M., Escudero, P., Tu, W., . . . Fink, A. (2003). A school-based mental health program for traumatized Latino immigrant children. J Am Acad Child Adolesc Psychiatry, 42(3), 311-318. doi:10.1097/00004583-200303000-00011
Kemple, J. J., & Snipes, J. C. (2000). Career academies: Impacts on students' engagement and performance in high school. New York, NY: Manpower Demonstration Research Corporation.
36
and anxiety genetic markers and mutations? A systematic review. Journal of Affective Disorders, 168, 387-398. doi:10.1016/j.jad.2014.07.016
Levesque, K., Lauen, D., Teitelbaum, P., Alt, M., & Librera, S. (2000). Vocational education in the United States: Toward the year 2000. Washington, D.C.: U.S. Department of
Education, National Center for Education Statistics.
Lewis, T., & Cheng, S.-Y. (2006). Tracking, Expectations, and the Transformation of Vocational Education. American Journal of Education, 113(1), 67-99. doi:10.1086/506494
Lynch, R. L. (2000). High school career and technical education for the first decade of the 21st century. Journal of Vocational Education Research, 25(2), 155-198.
Maciejewski, D. F., Renteria, M. E., Abdellaoui, A., Medland, S. E., Few, L. R., Gordon, S. D., . . . Verweij, K. J. H. (2017). The association of genetic predisposition to depressive symptoms with non-suicidal and suicidal self-injuries. Behavior Genetics, 47(1), 3-10. doi:10.1007/s10519-016-9809-z
Maxwell, N. L., & Rubin, V. (2002). High school career academies and post-secondary outcomes. Economics of Education Review, 21(2), 137-152. doi:10.1016/S0272-7757(00)00046-7
Meredith, L. S., Stein, B. D., Paddock, S. M., Jaycox, L. H., Quinn, V. P., Chandra, A., & Burnam, A. (2009). Perceived Barriers to Treatment for Adolescent Depression. Medical Care, 47(6), 677-685.
Metis Associates Inc. (1999). Evaluation of the North Carolina JobReady initiative: Survey of employers. New York: Author.
37
childhood-onset recurrent major depressive disorder in a large UK sample. Journal of Affective Disorders, 213(Supplement C), 207-213. doi:10.1016/j.jad.2017.01.017 Morris, M. C., Ciesla, J. A., & Garber, J. (2008). A prospective study of the cognitive-stress
model of depressive symptoms in adolescents. Journal of Abnormal Psychology, 117(4), 719-734. doi:10.1037/a0013741
Muris, P. (2002). Relationships between self-efficacy and symptoms of anxiety disorders and depression in a normal adolescent sample. Personality and Individual Differences, 32(2), 337-348. doi:10.1016/S0191-8869(01)00027-7
Nevid, J. S., Rathus, S. A., & Greene, B. (2018). Abnormal Psychology In a Changing World
(10th ed.). Hoboken, NJ: Pearson Higher Education.
Nolen-Hoeksema, S., & Girgus, J. S. (1994). The emergence of gender differences in depression during adolescence. Psychological Bulletin, 115(3), 424-443.
doi:10.1037/0033-2909.115.3.424
Oakes, J., & Guiton, G. (1995). Matchmaking: The Dynamics of High School Tracking
Decisions. American Educational Research Journal, 32(1), 3-33. doi:10.2307/1163210 Patterson, K. (2017). Civic Identity, Civic Skills, and Civic Knowledge: The Role of Adolescent School
Experiences in Facilitating Civic Engagement in Adulthood. (Doctor of Philosophy Dissertation), University of North Carolina at Chapel Hill, Chapel Hill, NC.
38
Pine, D. S., Cohen, E., Cohen, P., & Brook, J. (1999). Adolescent depressive symptoms as predictors of adult depression: Moodiness or mood disorder? . American Journal of Psychiatry, 156(1), 133-135.
Plank, S. B. (2001). Career and Technical Education in the Balance: An Analysis of High School Persistence, Academic Achievement, and Postsecondary Destinations. Retrieved from St. Paul, MN:
Powell, A. K., Ocean, S. E., & Stanick, C. F. (2017). Depressive Disorders. In S. Goldstein & M. DeVries (Eds.), Handbook of DSM-5 Disorders in Children and Adolescents (pp. 151-172). Cham: Springer International Publishing.
Pratt, L. A., & Brody, D. J. (2014). NCHS data brief: Depression in the U.S. household population, 2009-2012 (172). Retrieved from www.cdc.gov/nchs/products/databriefs Ritvo, P. G., Fischer, J. S., Miller, D. M., Andrews, H., Paty, D. W., & Larocca, N. G. (1997).
Multiple Sclerosis Quality of Life Inventory: A User's Manual. New York, NY: National Multiple Sclerosis Society.
Rivera-Batiz, F. L. (2003). The impact of school-to-work programs on minority youth. In N. M. Sanders & W. J. Stull (Eds.), The school-to-work movement : Origins and destinations. Westport, Conn.: Praeger.
Salom, C. L., Kelly, A. B., Alati, R., Williams, G. M., Patton, G. C., & Williams, J. W. (2016). Individual, school-related and family characteristics distinguish co-occurrence of
drinking and depressive symptoms in very young adolescents. Drug and Alcohol Review, 35(4), 387-396. doi:10.1111/dar.12303
39
Stipanovic, N., Stringfield, S., & Witherell, E. (2017). The Influence of a Career Pathways Model and Career Counseling on Students' Career and Academic Self-Efficacy. Peabody Journal of Education, 92(2), 209-221.
Stoep, A. V., Weiss, N. S., Kuo, E. S., Cheney, D., & Cohen, P. (2003). What proportion of failure to complete secondary school in the US population is attributable to adolescent psychiatric disorder? The Journal of Behavioral Health Services & Research, 30(1), 119-124. doi:10.1007/bf02287817
Stone III, J. R. (2017). Introduction to Pathways to a Productive Adulthood: The Role of CTE in the American High School. Peabody Journal of Education, 92(2), 155-165.
doi:10.1080/0161956X.2017.1302207
Stone III, J. R., & Aliaga, O. A. (2007). Participation in career and technical education and school-to-work in American high schools. In D. Neumark (Ed.), Improving School-To-Work Transitions (pp. 59-86). New York, NY: Russell Sage Foundation.
Strengthening Career and Technical Education for the 21st Century Act, H.R.2353, 115th Congress (2017).
Trzesniewski, K. H., Donnellan, M. B., Moffitt, T. E., Robins, R. W., Poulton, R., & Caspi, A. (2006). Low self-esteem during adolescence predicts poor health, criminal behavior, and limited economic prospects during adulthood. Developmental Psychology, 42(2), 381-390. doi:10.1037/0012-1649.42.2.381
40
Undheim, A. M., & Sund, A. M. (2005). School factors and the emergence of depressive symptoms among young Norwegian adolescents. European Child & Adolescent Psychiatry, 14(8), 446-453. doi:10.1007/s00787-005-0496-1
Verhoeven, M., Sawyer, M. G., & Spence, S. H. (2013). The factorial invariance of the CES-D during adolescence: Are symptom profiles for depression stable across gender and time?
Journal of Adolescence, 36(1), 181-190. doi:10.1016/j.adolescence.2012.10.007 Wisdom, J. P., Clarke, G. N., & Green, C. A. (2006). What Teens Want: Barriers to Seeking
Care for Depression. Administration and Policy in Mental Health and Mental Health Services Research, 33(2), 133. doi:10.1007/s10488-006-0036-4
41
Figure 1. Secondary School Taxonomy of Single Labor Market Programs.
42
Table 1. Descriptive statistics of the demographics of students.
***The sample sizes in this table represent the sample sizes each category within the whole sample. Some observations did not have data for some demographic characteristics and, therefore, when these were added the sample sizes may be lower.
Variables Whole Sample Analytic Sample Occupational Investor Occupational Explorer Occupational Concentrator
n=3404 n=2326 n=737 n=593 n=139
Demographics
White (%) 58.02% 59.03% 60.79% 60.03% 64.03%
Black (%) 27.35% 27.21% 29.78% 30.02% 28.78%
Native American (%) 0.94% 1.12% 0.96% 1.18% 0.00% Asian/Pacific Islander
(%) 1.82% 1.63% 0.68% 0.84% 0.00%
Other Race (%) 11.87% 11.01% 7.79% 7.93% 7.19%
Hispanic (%) 21.56% 20.26% 15.20% 15.55% 13.67% Non-Hispanic (%) 78.44% 79.74% 84.80% 84.45% 86.33%
Female (%) 47.11% 47.81% 43.83% 45.99% 34.53%
Male (%) 52.89% 52.19% 56.17% 54.01% 65.47%
Household Income
(Mean $) 40528.50 41414.85 40418.02 37093.93 55005.56
Parent Highest Grade
Completed (Mean) 12.53 12.69 12.56 12.59 12.41
Student Characteristics
Freshman '00 (%) 4.51% 3.75% 0.68% 0.84% 0.00% Sophomore '00 (%) 20.16% 18.99% 5.43% 6.69% 0.00% Junior '00 (%) 41.20% 43.00% 41.11% 43.98% 28.78% Senior '00 (%) 34.13% 34.26% 52.78% 48.49% 71.22%
School Characterstics
Urban (%) 67.56% 68.07% 57.94% 55.35% 69.06%
Rural (%) 32.44% 31.93% 42.06% 44.65% 30.94%
Population < 500 (%) 12.16% 13.85% 20.87% 21.66% 16.96% Population 500-999
(%) 19.18% 19.47% 21.32% 22.02% 17.86%
Population >= 1000
(%) 68.66% 66.68% 57.81% 56.32% 65.18%
School Achievement
43
Table 2. Descriptive statistics of the mental health of students, classified by school and student characteristics.
Variables Mean
Standard Deviation
Whole Sample 0.00 1.00
Demographics
White 0.03 0.95
Black -0.04 1.07
Native American 0.03 1.18
Asian/Pacific Islander 0.02 0.79
Other Race -0.09 1.07
Hispanic -0.07 1.04
Non-Hispanic 0.02 0.99
Female -0.25 1.00
Male 0.23 0.94
Parent Did Not Graduate HS -0.07 1.05
Parent Graduated HS 0.02 0.99
Parent 4+ Years college 0.06 0.93
Student Characteristics
Freshman -0.16 1.09
Sophomore 0.00 1.03
Junior -0.01 0.97
Senior 0.03 1.01
Occupational Investor 0.06 0.95
Occupational Explorer 0.03 0.99
44
Table 3. Results of the multivariate regression analysis of being an occupational investor on depression scores.
Note: Standard error in brackets. *** p<0.01, ** p<0.05, * p<0.10
Model 1 Model 2 Model 3 Model 4 Model 5 Model 6 Model 7
Investor 0.0891** 0.0878** 0.0822* 0.0538 0.0489 0.0477 0.0401
[0.0446] [0.0447] [0.0448] [0.0436] [0.0448] [0.0452] [0.0479]
Black -0.0984** -0.1213** -0.0952** -0.0945* -0.0929* -0.0874*
[0.0467] [0.0486] [0.0472] [0.0496] [0.0502] [0.0503]
Hispanic -0.0930* -0.0853 -0.0904 -0.0882 -0.0853
[0.0546] [0.0530] [0.0578] [0.0588] [0.0589]
Female -0.4837*** -0.4663***-0.4664*** -0.4688***
[0.0404] [0.0415] [0.0416] [0.0417]
Parents' education 0.0554 0.0558 0.0496
[0.0548] [0.0549] [0.0553]
Urban -0.0095 -0.0131
[0.0462] [0.0464]
Freshman -0.1836
[0.1193]
Sophomore 0.0033
[0.0627]
Junior 0.0062
[0.0482] Constant -0.0279 -0.0005 0.0257 0.2574*** 0.2049*** 0.2107*** 0.2228***
[0.0250] [0.0279] [0.0318] [0.0364] [0.0615] [0.0677] [0.0794]
Observations 2,304 2,281 2,281 2,281 2,149 2,149 2,149
R-squared 0.0017 0.0035 0.0048 0.0638 0.061 0.061 0.0622
Variables
45
Table 4. Results of the multivariate regression analysis of being an occupational investor on depression scores for males and females.
Note: Standard error in brackets. *** p<0.01, ** p<0.05, * p<0.10
Model 1 Model 2 Model 3 Model 4 Model 5 Model 6 Model 7 Model 1 Model 2 Model 3 Model 4 Model 5 Model 6 Model 7
Investor 0.0813 0.0796 0.0803 0.0803 0.0752 0.0667 0.0487 0.0334 0.0374 0.0258 0.0258 0.0199 0.0253 0.0321
[0.0563] [0.0565] [0.0567] [0.0567] [0.0589] [0.0596] [0.0636] [0.0667] [0.0673] [0.0673] [0.0673] [0.0685] [0.0691] [0.0728]
Black -0.0442 -0.0413 -0.0413 -0.0568 -0.0516 -0.0456 -0.1018 -0.1522** -0.1522** -0.1377* -0.1478** -0.1437*
[0.0615] [0.0637] [0.0637] [0.0679] [0.0682] [0.0683] [0.0671] [0.0701] [0.0701] [0.0727] [0.0746] [0.0749]
Hispanic 0.0126 0.0126 -0.017 -0.0039 -0.0027 -0.1950** -0.1950** -0.1702** -0.1808** -0.1790**
[0.0702] [0.0702] [0.0778] [0.0791] [0.0791] [0.0801] [0.0801] [0.0859] [0.0876] [0.0878]
Parents' education -0.0229 -0.0234 -0.0257 0.1430* 0.1390* 0.1364
[0.0738] [0.0738] [0.0741] [0.0816] [0.0819] [0.0829]
Urban -0.0584 -0.0612 0.0422 0.041
[0.0618] [0.0620] [0.0697] [0.0702]
Freshman -0.2346 -0.09
[0.1507] [0.1931]
Sophomore -0.0221 0.0326
[0.0829] [0.0956]
Junior -0.0702 0.0931
[0.0661] [0.0703]
Constant 0.2113*** 0.2192*** 0.2157*** 0.2157*** 0.2353*** 0.2749*** 0.3272*** -0.2686*** -0.2365*** -0.1800*** -0.1800*** -0.2949*** -0.3175*** -0.3610***
[0.0328] [0.0365] [0.0412] [0.0412] [0.0790] [0.0894] [0.1048] [0.0357] [0.0401] [0.0462] [0.0462] [0.0865] [0.0943] [0.1108]
Observations 1199 1190 1190 1190 1122 1122 1122 1105 1091 1091 1091 1027 1027 1027
R-squared 0.0017 0.0021 0.0021 0.0021 0.0022 0.003 0.0057 0.0002 0.0023 0.0077 0.0077 0.0121 0.0124 0.0148
Depression Score (DV) Depression Score (DV)
Male
Variables
46
Table 5. Results of the multivariate regression analysis of being an occupational investor on depression scores for juniors and seniors.
Note: Standard error in brackets. *** p<0.01, ** p<0.05, * p<0.10
Model 1 Model 2 Model 3 Model 4 Model 5 Model 6 Model 1 Model 2 Model 3 Model 4 Model 5 Model 6
Investor -0.0015 0.0063 -0.001 -0.032 -0.0626 -0.0621 0.1730** 0.1674** 0.1632** 0.1116 0.1463** 0.1456** [0.0668] [0.0672] [0.0674] [0.0661] [0.0688] [0.0702] [0.0714] [0.0717] [0.0717] [0.0693] [0.0714] [0.0720] Black -0.1164* -0.1413* -0.1244* -0.1051 -0.1054 -0.1045 -0.1331 -0.1024 -0.1311 -0.1298
[0.0699] [0.0725] [0.0711] [0.0754] [0.0760] [0.0806] [0.0836] [0.0806] [0.0841] [0.0853]
Hispanic -0.1036 -0.0934 -0.0621 -0.0625 -0.1227 -0.131 -0.1561 -0.1546
[0.0807] [0.0790] [0.0868] [0.0879] [0.0967] [0.0930] [0.1007] [0.1022]
Female -0.3985*** -0.3921*** -0.3920*** -0.5518*** -0.5341*** -0.5340***
[0.0604] [0.0624] [0.0625] [0.0692] [0.0714] [0.0715]
Parents' education 0.1231 0.123 -0.0032 -0.0027
[0.0842] [0.0842] [0.1009] [0.1011]
Urban 0.0022 -0.0071
[0.0704] [0.0794]
Constant 0.0142 0.0437 0.0728 0.2649*** 0.1542 0.1527 -0.0836* -0.054 -0.022 0.2796*** 0.2640** 0.2683** [0.0367] [0.0405] [0.0464] [0.0540] [0.0958] [0.1070] [0.0495] [0.0537] [0.0593] [0.0685] [0.1146] [0.1241]
Observations 995 982 982 982 924 924 791 786 786 786 744 744
R-squared 0 0.0028 0.0045 0.0469 0.0486 0.0486 0.0074 0.0087 0.0108 0.0852 0.0856 0.0856
Depression Score (DV) Depression Score (DV) Variables
47
Table 6. Results of the multivariate regression analysis of being an occupational explorer on depression scores.
Note: Standard error in brackets. *** p<0.01, ** p<0.05, * p<0.10
Model 1 Model 2 Model 3 Model 4 Model 5 Model 6 Model 7
Explorer 0.0422 0.0402 0.0352 0.0247 0.0154 0.0131 0.0030
[0.0475] [0.0477] [0.0478] [0.0463] [0.0476] [0.0482] [0.0497]
Black -0.0963** -0.1205** -0.0946** -0.0933* -0.0910* -0.0851*
[0.0467] [0.0486] [0.0472] [0.0496] [0.0502] [0.0503]
Hispanic -0.0980* -0.0884* -0.0939 -0.0905 -0.0872
[0.0546] [0.0530] [0.0577] [0.0588] [0.0588]
Female -0.4860*** -0.4686*** -0.4686*** -0.4716***
[0.0404] [0.0415] [0.0415] [0.0416]
Parents' education 0.0549 0.0556 0.0480
[0.0549] [0.0549] [0.0552]
Urban -0.0142 -0.0187
[0.0463] [0.0465]
Freshman -0.2011*
[0.1184]
Sophomore -0.0121
[0.0612]
Junior -0.0010
[0.0476] Constant -0.0107 0.0164 0.0434 0.2696*** 0.2182*** 0.2268*** 0.2477***
[0.0240] [0.0270] [0.0309] [0.0353] [0.0608] [0.0670] [0.0769]
Observations 2,304 2,281 2,281 2,281 2,149 2,149 2,149
R-squared 0.0003 0.0021 0.0035 0.0632 0.0605 0.0606 0.0619