Sharif University of Technology
Scientia IranicaTransactions D: Computer Science & Engineering and Electrical Engineering www.scientiairanica.com
Determination of Weibull parameters by dierent
numerical methods and analysis of wind power density
in Osmaniye, Turkey
Y.A. Kaplan
Department of Energy Engineering, Osmaniye Korkut Ata University, 80000, Osmaniye, Turkey. Received 10 November 2015; received in revised form 17 June 2016; accepted 4 July 2016
KEYWORDS Weibull distribution; Graphical method; Moment method; Energy trend method; Energy pattern method;
Maximum likelihood method.
Abstract. In this study, the potential of wind energy in Osmaniye Region has been analysed statistically on the basis of information that has been measured hourly between the years 2009 to 2013. The two-parameter Weibull Distribution Function is generally applied to evaluate the potential of wind energy in any region. This study introduced the evaluation of Weibull Distribution Function parameters which are obtained by dierent kinds of numerical methods, namely Graphical Method (GM), Moment Method (MM), Energy Pattern Method (EPM), Energy Trend Method (ETM), and Maximum Likelihood Method (MLM). The Relative Percentage Error (RPE) of statistical test is used to compare the eciency of all used methods. The calculated power density of all used numerical methods is a major key issue for suitability use of wind energy. The evaluation of Weibull parameters and wind power distribution play a crucial role in producing electricity from wind power. The results of the used methods are compared, and the obtained pre-research results show that the wind energy potential in Osmaniye Region is statistically suitable for electricity production.
© 2017 Sharif University of Technology. All rights reserved.
1. Introduction
Nowadays, the need of energy is increasing day by day due to the population growth and the advancements of technology [1]. Hence, the search for new energy resources becomes a very important subject for the entire world [2]. Energy is the most important factor which aects economic structure of a country. As is known, energy is seen as not only the internal dynamics of the countries, but also as a strategic case which aects International Relations, including political as well as military conicts. Energy is also the primary element of economic and social development in the world [3,4]. In recent years, renewable generations,
*. E-mail address: [email protected] doi: 10.24200/sci.2017.4354
especially wind power and photovoltaic (PV) systems, have been increasingly used in power systems [5,6]. Wind energy has been used in irrigation, wheat-grinding, vessels, and many other elds because it is an environmentally-friendly future energy resource. Fur-thermore, wind energy is used for meeting the energy requirement that will be the most important problem of the future world. They are also powerful political players, thanks to the economic power. Currently, wind energy is seen as a positive alternative to fossil fuels and also a way to assist the expansion of local economies in future. The world will use renewable energy instead of using fossil fuels in order to meet the demands of the world's energy [7,8]. The consumption of fossil fuels has negative environmental impacts, particularly the release of carbon dioxide (CO2) and other harmful
gases into the atmosphere. CO2 emissions can be
resources [9]. Wind consists of the temperature and pressure dierence that is resulted from heating and cooling of the atmosphere. It is estimated that almost 2% of all sun energy that the world gets is converted into the kinetic energy of wind. When it is considered that this quantity is the thousands of times of the world's total energy consumption, the signicance of wind energy can be understood. Wind energy depends on the wind speed. Speed of wind changes with the height, and power of wind changes with the cube of wind speed. There are many studies related to wind energy subject, and the speed of the wind is taken as a random parameter. The most common distribution function to dene the wind speed variation is Weibull distribution function. This study aims to determine the wind energy potential in Osmaniye. We have collected the ve-year data of the wind speed measured at 10-meter height from the General Directorate of State Meteorology. Kantar and Usta [10] analyzed the use of the minimum cross entropy principle in the estimation of wind speed distribution and wind power density functions. Moreover, they compared the Weibull pdf (probability density function) with the MinxEnt (minimum cross-entropy principle) pdfs. Akdag and Dinler [11] reviewed dierent methods, i.e. the graphical, maximum likelihood, moment methods, and energy pattern method. Bilgili and Sahin [12] investigated wind energy density in the southern and southwestern regions of Turkey using the Weibull and Rayleigh probability density functions. Rocha et al. [13] dealt with the evaluation and comparison of dierent numerical methods for the assessment of eciency in determining the parameters for the Weibull distribution function, using wind speed data collected in Camocim and Paracuru cities. Freitas et al. [14] introduced a new approach for analyzing numerical methods used in calculating the Weibull distribution parameters for the prediction of wind energy source. Chang [15] reviewed six kinds of numerical methods, commonly used for estimating Weibull parameters. Bilir et al. [16] collected wind data for a year between June 2012 to June 2013. Wind speed data, collected for two dierent heights (20 m and 30 m) from a mea-surement station installed in Atlm University campus area (Ankara, Turkey), were recorded using a data logger as one-minute average values. They determined l shape (k) and scale (c) parameters of Weibull using ve dierent methods. The Weibull distribution function has been generally used to assess wind energy potential. Yaniktepe et al. [17] investigated the wind energy potential in Osmaniye for a period of 44 months, from January 2008 to August 2011. They used the graphical method to determine the coecients of Weibull distri-bution function. In this present study, ve dierent methods were used to determine the coecients of Weibull distribution method for a period of ve years,
and also the calculated average wind speed and power density of all used numerical methods were compared to the real data. The Weibull distribution function has two parameters which are dimensionless shape parameters `k' and scale `c'. These parameters must be calculated to determine the average wind speed and wind power density.
2. Statistical analysis of wind energy
Firstly, it is necessary to determine wind power po-tential to benet from wind energy. It is well known that the power of the wind energy depends on wind velocity `v', blade swept area of wind turbine `A', and air density of region `'; plus, the power of wind energy is given in the following equation [10]:
PA= 12Av3: (1)
As seen, wind speed is the most important input in order to determine the power potential. Wind direction plays an important role in the placement of wind power conversion systems, excluding the eective potential. In order to identify a region of the wind power potential, it is required for wind velocity values to be measured at specic time intervals. To do this, measurements of meteorological stations and airports can be utilized.
2.1. Weibull distribution function
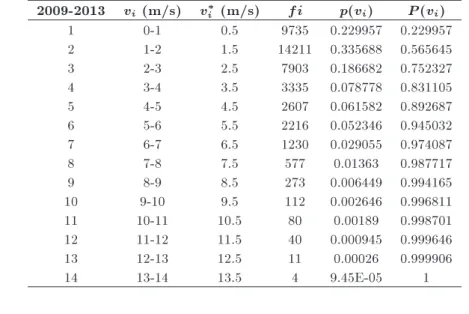
In practice, a variety of methods have been utilized to determine the wind energy of a region. A wind speed distribution measure or a frequency distribution is used to determine the wind energy potential of a specic region, if possible. If not, wind speed distribution can be demonstrated through other analytical distribution functions. There are many distribution functions to determine the dispersion of wind speed for any region. One of these functions is the Weibull distribution function. This distribution is not only quite exible and simple, but it also complies with real data. In other words, as Weibull distribution complies with the wind speed data, it is generally accepted in wind energy analyses [18]. Firstly, as shown in Table 1, a specic frequency range of wind speed (the number of blowing) and the probability are obtained. In the second column of Table 1, wind speeds are grouped periodically. The third column gives the average wind speed for each speed ratio. The number of blowing each speed ratio or frequency is shown in the fourth column. The probability density is located in the fth column of the table. The cumulative probability density function is given in the sixth column.
Probability density of each speed ratio is given in the following equation:
Table 1. Frequency and probability schemes of hourly wind speed between the years 2009 to 2013. 2009-2013 vi (m/s) v
i (m/s) fi p(vi) P (vi)
1 0-1 0.5 9735 0.229957 0.229957
2 1-2 1.5 14211 0.335688 0.565645
3 2-3 2.5 7903 0.186682 0.752327
4 3-4 3.5 3335 0.078778 0.831105
5 4-5 4.5 2607 0.061582 0.892687
6 5-6 5.5 2216 0.052346 0.945032
7 6-7 6.5 1230 0.029055 0.974087
8 7-8 7.5 577 0.01363 0.987717
9 8-9 8.5 273 0.006449 0.994165
10 9-10 9.5 112 0.002646 0.996811
11 10-11 10.5 80 0.00189 0.998701
12 11-12 11.5 40 0.000945 0.999646
13 12-13 12.5 11 0.00026 0.999906
14 13-14 13.5 4 9.45E-05 1
Figure 1. Probability density and cumulative probability distributions of wind speed.
p(vi) = PNfi
i=1fi: (2)
The cumulated probability density, which is given in the following equation, is illustrated in the sixth column of the table [19,20]:
P (vi) = N
X
i=1
p(vi): (3)
The obtained probability density and the cumulative probability distributions of wind speed ranges are given in Figure 1.
The general expression of the two-parameter Weibull is given by:
p(v) =
k c
v c
k 1
exp v c
k
: (4)
The cumulative function of wind speed can be attained by computing the integral of the probability density function given by:
p(v) = 1 exp v c
k
; (5)
where p(v) is the observed probability density function, P (v) is the cumulative probability density function, shape (k) and scale (c) are the parameters of Weibull distribution function [21,22].
3. Determination of Weibull parameters
There are many methods to determine shape parameter \k" and scale parameter \c" of Weibull distribution Function. In this work, there are ve popular methods used to determine Weibull parameters; these are:
Graphical method;
Moment method;
Energy trend method;
Energy pattern method;
Maximum likelihood method.
The Weibull distribution function, which is a three-parameter function, known for wind speed though, can be expressed mathematically in a two-parameter model.
3.1. Graphical methods
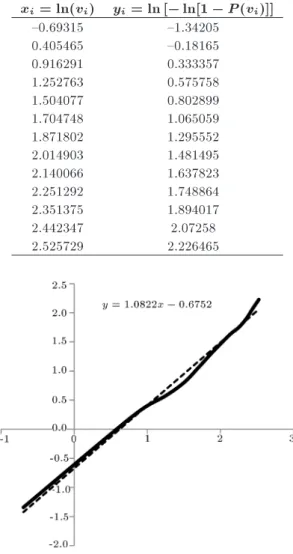
In this method, the least squared regression is used to determine parameters k and c. By taking twice loga-rithm of the general expression of Weibull distribution function, the graphical method is obtained as follows:
v c
k
= ln [1 P (v)] ; (6)
k ln(v) k ln(c) = ln [ ln[1 P (v)]] ; (7) this equation is found. Here, x = ln(v), y = ln[ ln[1
Table 2. Hourly speed of wind's xiand yischemes. xi= ln(vi) yi= ln [ ln[1 P (vi)]]
{0.69315 {1.34205
0.405465 {0.18165
0.916291 0.333357
1.252763 0.575758
1.504077 0.802899
1.704748 1.065059
1.871802 1.295552
2.014903 1.481495
2.140066 1.637823
2.251292 1.748864
2.351375 1.894017
2.442347 2.07258
2.525729 2.226465
Figure 2. Linear equation of graphic method.
P (v)]], A = k, and B = k ln(c), and y = Ax + B are accepted; there is a form of linear equations, and also this expression is obtained from B = k ln(c) and c = exp( B=A) [10,12]. The values of `x' and `y' can be calculated by Table 2, and linear equation is obtained from what is shown in Figure 2.
The numerical values of A and B, y = Ax + B, are determined as Weibull parameters k and c:
k = A; c = exp
B A
: (8)
Calculated parameters `k' and `c' for Graphical method are shown in Figures 3 and 4, respectively.
3.2. Moment methods
Moment method is one of the oldest methods used to determine Weibull distribution parameters. Moment method is a method where data distribution allows a solution of the relationship between average and standard deviation values, with these values being between the shape parameters using numerical meth-ods for determining the scale of 1 to 10 and the
Figure 3. Parameter \k" for graphical method.
Figure 4. Parameter \c (m/s)" for graphical method.
shape parameter. Shape and scale parameters can be expressed as in Eqs. (9) and (10) [14,23]:
k =
vm
1;086
; (9)
c = vm 1 + 1
k
; (10)
where is Gamma function. In the following equations, shows standard deviation, and vm shows average
speed:
vm=n1 n
X
i=1
vi; (11)
= v u u t 1
n
n
X
i=1
(vi vm)2: (12)
Calculated parameters `k' and `c' for Moment Method are shown in Figures 5 and 6, respectively.
Figure 5. Parameter \k" for moment method.
Figure 6. Parameter \c (m/s)" for moment method.
3.3. Energy trend method
Energy pattern factor EP F is dened as wind energy
obtained by the ratio of total wind energy to the average wind speed. In this method, parameters `k' and `c' can be easily calculated by using EPF [11]:
EP F = 1 n
Pn
1Vi3 1 n
Pn
1Vi3
; (13)
k = 1 3; 9557E0;898
P F
: (14)
The scale parameter is calculated as follows:
c = 1nXn
1
Vk i
!1=k
: (15)
Calculated parameters `k' and `c' for energy trend method are shown in Figures 7 and 8, respectively.
Figure 7. Parameter \k" for energy trend method.
Figure 8. Parameter \c (m/s)" for energy trend method.
3.4. Energy pattern method
Energy pattern factor is dened as wind energy ob-tained by the ratio of total wind energy to the average wind speed. After calculating energy tendency factor (EP F), shape parameter (k) can be obtained and then
parameter (c) can be calculated, using average wind speed [13,15]:
EP F = 1 n
Pn
1Vi3 1 n
Pn
1Vi
3; (16)
k = 1 +E3; 692
P F; (17)
c = vm 1 +1
k
: (18)
Calculated parameters `k' and `c' for energy pattern method are shown in Figures 9 and 10, respectively. 3.5. Maximum likelihood method
The maximum likelihood estimation method is a math-ematical expression recognized as a likelihood function
Figure 9. Parameter \k" for energy pattern method.
Figure 10. Parameter \c (m/s)" for energy pattern method.
of the wind speed data in time series format. In this method, many numerical iterations can be required to determine parameters k and c of the Weibull function. In this method, values of Weibull parameters k and c are calculated by the following equation [13,15,16]:
k = Pn
1Pvki ln(vi) n 1vki
Pn
1ln(vi)
n
1
; (19)
c = n1
n
X
1
Vk i
!1=k
: (20)
Calculated parameters `k' and `c' for maximum likeli-hood method are shown in Figures 11 and 12, respec-tively.
4. The obtained results
Weibull distribution function was investigated based on the data measured hourly between the years 2009-2013, derived from the measuring stations of Osmaniye State Meteorology Aairs of General Directorate. Weibul
Figure 11. Parameter \k" for maximum likelihood method.
Figure 12. Parameter \c (m/s)" for maximum likelihood method.
parameters `k' and `c' are computed for all methods in the mentioned period, and the obtained results are given in Table 3.
The average wind speed `Vm' and wind power
den-sity `PM' can be computed by the following equations
for real-time series of data: vm=n1
n
X
i=1
vi; (21)
PM = 12V3: (22)
The average wind speed `Vm' and wind power density
`PW' of Weibull Distribution Function can be estimated
by the following equations: Vm= c
1 + 1k
; (23)
Pw= 12c3
1 + 3
k
: (24)
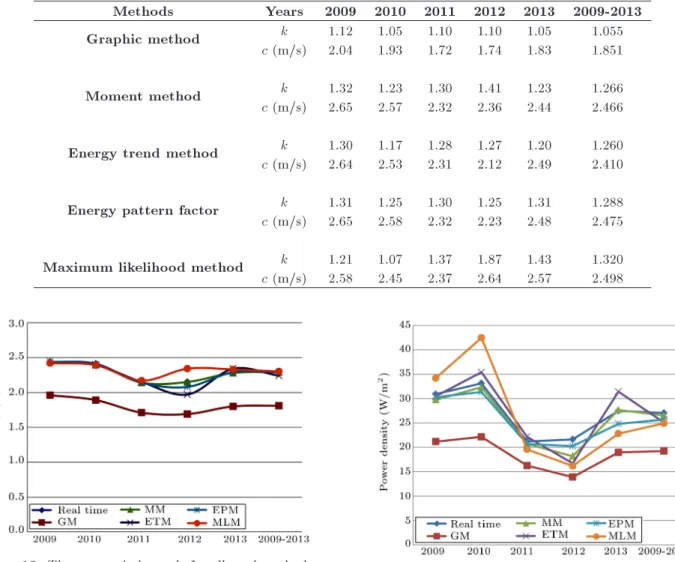
The average wind speed and wind power density for all methods are given in Figures 13 and 14.
Table 3. Weibull parameters for all used methods.
Methods Years 2009 2010 2011 2012 2013 2009-2013
Graphic method k 1.12 1.05 1.10 1.10 1.05 1.055
c (m/s) 2.04 1.93 1.72 1.74 1.83 1.851
Moment method k 1.32 1.23 1.30 1.41 1.23 1.266
c (m/s) 2.65 2.57 2.32 2.36 2.44 2.466 Energy trend method k 1.30 1.17 1.28 1.27 1.20 1.260 c (m/s) 2.64 2.53 2.31 2.12 2.49 2.410 Energy pattern factor k 1.31 1.25 1.30 1.25 1.31 1.288 c (m/s) 2.65 2.58 2.32 2.23 2.48 2.475 Maximum likelihood method k 1.21 1.07 1.37 1.87 1.43 1.320 c (m/s) 2.58 2.45 2.37 2.64 2.57 2.498
Figure 13. The mean wind speeds for all used methods.
4.1. Statistical error analysis
To determine the eciency of the used methods and to nd the best method of the mentioned methods, the Relative Percentage Error (RPE) test can be used. The equation of RPE test is given in the following equation [24]:
RPE =
PW PM
PM
100: (25) The RPE statistical results of all methods for ve years are given in Table 4.
Figure 14. The wind power density for all used methods.
If we generally evaluate the results, the best results are obtained by Energy Pattern Method and the worst ones are obtained by Graphical Methods for a ve-year period. According to all obtained results, the more appropriate estimation method is not identical for all years. For 2009, the Energy Trend Method de-termined more eective estimation methods of Weibull parameters to compute the wind power density. For 2011, the Moment Method determined more eective estimation methods of Weibull parameters to compute the wind power density.
Table 4. The RPE statistical error analysis for all used methods.
RPE test GM MM ETM EPM MLM
2009 {31.5755419 {3.785182789 {1.391135555 {2.070527337 10.54674863 2010 {33.15217391 {2.415458937 6.884057971 {5.314009662 28.23067633 2011 {23.40726758 {1.086956522 4.483246815 {2.359603587 {28.76911872 2012 {35.75393154 {15.95744681 {22.71045328 {6.336725254 {25.25439408 2013 {31.02694829 0.728332119 {31.02694829 {9.650400583 {16.97013838
5. Conclusions
In this study, by using the available wind data, the re-liability and quality of wind speed for Osmaniye region were evaluated, and the values of Weibull parameters `k' and `c' were determined by using dierent kinds of estimation methods. The obtained results show that the frequency and density of wind speed within 10 m height is at a sucient level. This study is a prelim-inary study for the determination of wind potential before making an investment in wind energy for one region. We have examined the coherence of wind speeds with the Weibull distribution function by using wind speed data for the years 2009 to 2013. The present study is a pre-research conducted for predicting the wind energy analysis of Osmaniye region. According to test results of the Relative Percentage Error (RPE), GM's performance in estimating Weibull parameters is the worst one, and the best parameter estimation is accomplished by using EPM. Moreover, this study can give useful insights for the investors in Osmaniye Region to deal with wind energy. In future studies, the scope of this study can be expanded and detailed to determine the wind energy potential of Osmaniye Region.
References
1. Esteves, N.B., Sigal, A., Leiva, E.P.M., Rodrguez, C.R., Cavalcante, F.S.A. and de Lima, L.C. \Wind and solar hydrogen for the potential production of ammonia in the state of Ceara Brazil", International Journal of Hydrogen Energy, 40, pp. 9917-9923 (2015).
2. Fan, H., Singh, R. and Akbarzadeh, A. \Lectric power generation from thermoelectric cells using a solar dish concentrator", J. Electron. Mater., 40, pp. 1311-1320 (2011).
3. Kaplan, Y.A. \Overview of wind energy in the world and assessment of current wind energy policies in Turkey", Renewable and Sustainable Energy Reviews, 43(C), pp. 562-568 (2015).
4. Kaplan, Y.A. and San, I. \Current situation of wind energy in the world and Turkey", Green Energy Conference-VI (IGEC-VI), Eskisehir, Turkey (2011).
5. Ghaedi, A., Abbaspour, A., Fotuhi-Firuzabad, M. and Parvania, M. \Incorporating large photovoltaic farms in power generation system adequacy assessment", J. Sci. Iran., 21(3), pp. 924-934 (2014).
6. Roy, G., Matagne, E. and Jacques, P.J. \A global design approach for large-scale thermoelectric energy harvesting systems", J. Electron. Mater., 42, pp. 1781-1788 (2013).
7. Capika, M., Ylmaz, A.O. and Cavusoglu, I. \Present situation and potential role of renewable energy in Turkey", Renewable Energy, 46, pp. 1-13 (2012).
8. Gabbasa, M., Sopian, K., Yaakob, Z., Zonooz, M., Fudholi, A. and Asim, N. \Review of the energy supply status for sustainable development in the Organization of Islamic Conference", Renewable and Sustainable Energy Reviews, 28, pp. 18-28 (2013).
9. Zerhounia, F.Z., Zerhounia, M.H., Zegrara, M., Ben-messaouda, M.T, Tilmatineb, A. and Boudghene Stamboulia, A. \Modelling polycristallin photovoltaic cells using design of experiments", J. Sci. Iran., 21(6), pp. 2273-2279 (2014).
10. Kantar, Y.M. and Usta, I. \Analysis of wind speed distributions: wind distribution function derived from minimum cross entropy principles as better alternative to Weibull function", Energy Convers Manage, 49, pp. 962-973 (2008).
11. Akdag, S.A. and Dinler, A. \A new method to estimate Weibull parameters for wind energy applications", Energy Convers Manag, 50, pp. 1761-1766 (2009).
12. Bilgili, M. and ve Sahin, B. \The nding of Weibull pa-rameters at the determination of Wind Power density", New and Renewable Energy/Energy Management Sym-posium, Kayseri, pp. 229-234 (2005).
13. Rocha, P.A.C.R., Sousa, R.C.D., Andrade, C.F.D. and Silva, M.E.V.D. \Comparison of seven numerical methods for determining Weibull parameters for wind energy generation in the northeast region of Brazil", Applied Energy, 89, pp. 395-400 (2012).
14. Freitas de Andrade, C., Maia Neto, H.F., Costa Rocha, P.A. and Vieira da Silva, M.E. \An eciency com-parison of numerical methods for determining Weibull parameters for wind energy applications: A new approach applied to the northeast region of Brazil", Energy Convers Manage, 86(10) pp. 801-808 (2014).
15. Chang, T.P. \Performance comparison of six numerical methods in estimating Weibull parameters for wind energy application", Appl. Energy., 88, pp. 272-282 (2011).
16. Bilir, Levent, et al. \Seasonal and yearly wind speed distribution and wind power density analysis based on Weibull distribution function", International Journal of Hydrogen Energy, 40(44), pp. 15301-15310 (2015).
17. Yaniktepe, B., Koroglu, T. and Savrun, M.M. \Investi-gation of wind characteristics and wind energy poten-tial in Osmaniye, Turkey", Renewable and Sustainable Energy Reviews, 21, pp. 703-711 (2013).
18. Km, J.S. and Yum, B.J. \Selection between ewibull and lognormal distributions: A comparative simula-tion study", Computasimula-tional Statistics & Data Analysis, 53(2), pp. 477-485 (2008).
19. Azad, A.K., Rasul, M.G. and Yusaf, T. \Statistical diagnosis of the best Weibull methods for wind power assessment for agricultural applications", Energies, 7, pp. 3056-3085 (2014).
20. Morgan, E.C., Lackner, M., Vogal, R.M. and Baise, L.G. \Probability distributions of oshore wind speeds", Energy Conversion and Management, 52, pp. 15-26 (2011).
21. Yldrm, U., Gazibey, Y. and Gungor, A. \Wind En-ergy Potential of Nigde", Journal of Nigde University, 1(2), pp. 37-47 (2012).
22. Kose, R., Arif, M.O., Erbas, O. and Tugcu, A. \The analysis of wind data and wind energy potential in Kutahya, Turkey", Renewable and Sustainable Energy Reviews, 8, pp. 277-288 (2004).
23. Gokcek, M., Bayulken, A. and Bekdemir, S. \Investiga-tion of wind characteristics and wind energy potential in Kirklareli, Turkey", Renewable Energy, 32, pp. 1739-1752 (2007).
24. Sabzpooshani, M. and Mohammadi, K. \Establishing new empirical models for predicting monthly mean horizontal diuse solar radiation in city of Isfahan, Iran", Energy, 69(5), pp. 71-77 (2014).
Biography
Yusuf Alper Kaplan is an Assistant Professor in Energy Engineering Department of Osmaniye Korkut Ata University, Osmaniye, Turkey. He received his PhD degree in Electrical and Electronics Engineering from Anadolu University, Eskisehir, Turkey, in 2014. His main research interests are renewable energy, wind energy, solar energy, and power quality.