Using Barrier Analysis to Inform Behavior Change Communication Strategy
By
Maurice Gerald Zafimanjaka
A Master’s Paper submitted to the faculty of the University of North Carolina at Chapel Hill in partial fulfillment of the requirements for the degree of
Master of Public Health
in School of Public Health (Public Health Leadership Program).
Chapel Hill 2010
________________________________ Advisor signature/printed name
________________________________ Second Reader Signature/printed name
pg. 1
Explanatory behavior change theories and models were adopted in health behavior to understand its determinants in order to better influence behaviors for a healthy community. Based on these explanatory theories and models, public health professionals use them to develop health interventions (Glanz and Rimer, 2005, p.5). For instance, awareness of toothache severity could be a determinant for some people to make a decision about a healthy behavior such as brushing their teeth regularly. So, if the level of this awareness is low, health behavior professionals try to raise awareness. However, there are many potential determinants and the professionals try to bring them to acceptable levels by influencing them in the appropriate direction.Gielen and MacDonald (2002) summarized Green and Kruter’s PRECEDE-PROCEED framework model as a tool to develop health behavior strategies. They note that health planners should identify the determinants that are strongly associated with the behavior or health problem of interest and the most changeable (pp. 416-418). This approach will help health planners to identify and plan the most cost-effective health behavior interventions.
pg. 2
groups (doers and non doers), we will borrow statistical techniques which are frequently used in epidemiology to make comparisons more scientific and detect the presence or lack of association between behavior and its potential determinants suggested by theories. Furthermore, thisquantitative barrier analysis can be easily conducted in few days and with a simplified toolkit that can be used by field practitioners.
pg. 3
Behavior Change Theories Underlying Barrier AnalysisBehavior change process is very complicated involving many factors interacting with each other at different levels. Many researchers study behavior change at some level while trying to explain or predict its determinants, process and outcome by developing different theories. Glanz and Rimer (2005) published through the National Cancer Institute a monograph entitled Theory at a Glance, A Guide for Health Promotion Practice that reviews behavior theories and asserts that theory help planners to move beyond intuition to design and evaluate health behavior and health promotion interventions based on understanding of behavior. The barrier analysis uses a mixture of behavior theories to identify barriers to behavior change and design behavior change strategy and interventions. This monograph notes that “using theory as a foundation for program planning and development is consistent with the current emphasis on using evidence-based interventions in public health, behavioral medicine, and medicine” (Glanz and Rimer, 2005, p.5).
Glanz and Rimer (2005) categorize theories in explanatory theory and change theory. Some theories describe the reasons why a problem exists. Health belief model and the theory of planned behavior are examples of explanatory theories. They help public health promoters identify and find potential ways to influence factors that contribute to a health problem. However, some other theories help in planning health interventions. Change theories help identify concepts that can be translated into program messages and strategies. Moreover, they help in the program evaluation by identifying intermediary steps and outcomes of the behavior change process. The Glanz and Rimer’s monograph (2005, p.5) notes that community
pg. 4
about their assumptions for why a program will work”. Barrier analysis is more focused onexplanatory theory while recognizing change theories.
Social-Ecological Model
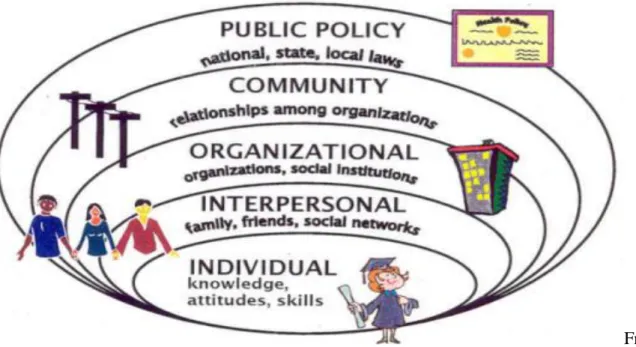
Although barrier analysis approach helps to develop behavior change communication (BCC) at individual and interpersonal levels, it acknowledges ecological perspectives of behavior change emphasizing the interaction between, and interdependence of, factors within and across broader levels of a health problem. Glanz and Rimer (2005, p.10) note that “Two key concepts of the ecological perspective help to identify intervention points for promoting health: first, behavior both affects, and is affected by, multiple levels of influence; second, individual behavior both shapes, and is shaped by, the social environment (reciprocal causation)”. In
social-ecological models, health behavior is determined by multi-level factors from the individual to a broader context. It has five levels: intrapersonal/individual, interpersonal, institutional/
pg. 5
Figure 1: The Socio-Ecological ModelFrom: “Socio-Ecological Model--Looking Beyond the Individual”, retrieved August 27, 2010 at
http://www.balancedweightmanagement.com/TheSocio-EcologicalModel.htm
At the individual or intrapersonal level, knowledge, attitudes, beliefs, skills, biologic and historical factors play important roles in predicting behavior (McLeroy et al, winter 1988 ; Glanz and Rimer, 2005). They increase or reduce the likelihood of adopting a certain behavior. Some of these individual factors can be age, sex, education, income, or previous experiences. For
example, suppose a woman delays getting a recommended mammogram. At the individual level, her inaction may be due to fears of finding out she has cancer (Glanz and Rimer, 2005).
pg. 6
The second level is interpersonal. Individuals are social beings. Relationships with peers, intimate partners, and family members can increase or reduce the likelihood of healthy behavior adoption (CDC, 2010). To continue the example of delaying the mammogram, the woman’s doctor may neglect to tell her that she should get the test, or she may have friends who say they do not believe it is important to get a mammogram (Glanz and Rimer, 2005). For an African woman where the gender relationship is imbalanced, the husband influences her decision to adopt specific behavior. Steil’diary (as cited in Crawford and Unger, 2000) noted that many factors are associated with husband dominance in marriage. It is important to identify individuals who influence individual opinions or decisions regarding adopting a specific behavior. Although, social norms are generated at the institutional and community level, they operate at this level (The California Department of Public Health, 2010). These influential individuals should be used to provide informational, emotional or instrumental supports to the primary target population of BCC intervention (McLeroy et al., 1988, p357). Emotional support involves the provision of empathy, love, trust and caring while instrumental support involves the provision of tangible aid and services to a person in need. Also, informational support is the provision of useful advice, suggestions, and information to address a person’s problems while appraisal support involves the provision of information that can be sued for self-evaluation purposes. (Heaney and Israel, 2002, p.186).pg. 7
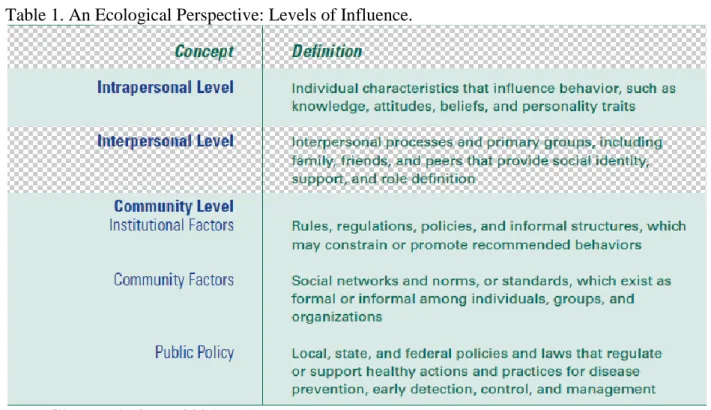
and policies that guide their behaviors. Interventions at this level can influence the behavior of individuals. Groups can provide social supports to each of its individual members.The community is another level that the model considers. It covers all individuals, institutions and organizations that collectively weave the societal fabric, the physical environment and the public policies and laws that influence and shape behaviors. It can be defined based on proximity as geographic location or possession of certain beliefs that produce affiliation: geographic, neighborhood, religious, professional proximities. Many social norms and standards are generated and shared at the community level. Deviance from these norms and standards may be directly or indirectly sanctioned by the whole community. However, deviance can be positive or negative according to the healthy behavior to be promoted. Setting a public agenda and developing coalition through advocacy to community leaders can be important at this level (The California Department of Public Health, 2010). Table 1 summarizes the levels of influence of social-ecological model.
Table 1. An Ecological Perspective: Levels of Influence.
pg. 8
Behavior theories that focus on intrapersonal and interpersonal levels can be classified broadly within cognitive-behavioral theories. They include social cognitive theory (SCT), health belief model (HBM), theory of planned behavior (TPB), and stages of change theories. They have some similarities. Glanz and Rimer (2005) note that three key concepts cut across these theories:1) Behavior is mediated by cognitions; that is, what people know and think affects how they act.
2) Knowledge is necessary for, but not sufficient to produce, most behavior changes.
3) Perceptions, motivations, skills, and the social environment are key influences on behavior.”
Social Cognitive Theory
Social cognitive theory (SCT) helps to understand behavior change at the interpersonal level although it acknowledges that individuals exist within and are influenced by a social environment (Glanz and Rimer, 2005). It explores the reciprocal interactions of people and their environments, and the psychosocial determinants of health behavior. SCT is an improvement of the social learning theory (SLT) which asserts that people learn not only from their own
experiences, but by observing that of others and the benefits of those actions. This emphasizes the importance of the construct of observational learning or modeling. SCT was born from SLT by adding the self-efficacy construct. Therefore, based on SCT, self-efficacy, goals and outcome expectancies are the main factors that affect the likelihood that a person will change a health behavior (Glanz and Rimer, 2005).
According to SCT, individuals must believe in their capacity to perform the health behavior (self-efficacy) and have strong perception of an incentive to do so (outcome
pg. 9
behavior should outweigh their negative expectations. Moreover, the expectations might be classified as having immediate benefits or long term benefits. However, these expectations can be filtered by the perception of ability to implement the recommended health behavior(Kritsonis, 2004-2005).
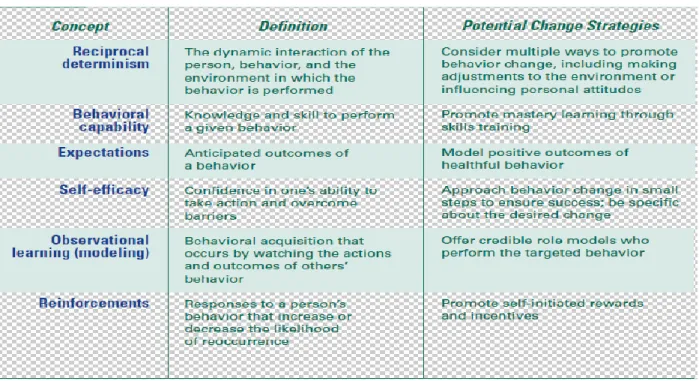
Individuals can increase self-efficacy by setting incremental goals, contracting behavior and monitoring and reinforcement. Goals can be set gradually based on the level of self-efficacy. Setting a very high goal an individual cannot achieve will have an adverse effect. That will reduce the self-efficacy. Also, it is important if the individual sets a formal contract in terms of behavior by specifying goals and rewards. Finally, monitoring goal achievement and rewarding will push individuals to do more and more (Glanz and Rimer, 2005). Table 2 summarizes SCT concepts.
Table 2: The Social Cognitive Theory
pg. 10
Theory of Planned Behavior/ Reasoned ActionIn the theory of reasoned action, the main determinant of behavior is the intention which is determined by three factors: the attitude of the individual, the subjective norms and the perceived behavior control (Glanz and Rimer, 2005). The attitude is the result of process of awareness and assessment of available options or actions. Attitude has two components: the evaluation and the strength of the belief. The evaluation relates to the favorability or
unfavorability of an attitude that can be translated in positive or negative perceptions of particular actions or conditions. The belief strength is the likelihood that an attitude is true.
Based on the two components of the attitude, the theory of reasoned actions suggests the following options:
strengthen the evaluation and the belief strength of an attitude that supports the persuasive
goal
weaken the evaluation and the belief strength of an attitude that opposes the persuasive goal create a new attitude with a belief strength and evaluation that supports the persuasive goal remind our audience of a forgotten attitude with a belief strength and evaluation that
supports the persuasive goal (“Theory of Reasoned Action”, 2010)
pg. 11
Based on the two components of the subjective norms, the TPB suggests professionals to: strengthen a normative belief that supports the persuasive goal increase the motivation to comply with a norm that supports the persuasive goal reduce a normative belief that opposes the persuasive goal
reduce the motivation to comply with a norm that opposes the persuasive goal create a new subjective norm that supports the persuasive goal
remind the audience of a forgotten subjective norm that supports the persuasive goal (“Theory of Reasoned Action”, 2010),
pg. 12
From Glanz and Rimer, 2005, p.18Health Belief Model (HBM)
The HBM is a social psychological model attempting to adopt a systematic approach to explain and predict health behavior. It received some evolvement and improvement since its first application in the 1950s. Based on HBM, the determinants of health behavior can be divided in three categories: individual perceptions (perceived severity and perceived susceptibility), modifying factors, the cues for action, and the likelihood of action (perceived benefits and perceived barriers) (Glanz and Rimer, 2005).
Perceived susceptibility is the perception of the likelihood that a condition can happen to the person’s life. The higher the perceived susceptibility the more likely a person is to take
pg. 13
consequences of a condition. Again, the higher the perceived severity the more likely a person is to take action. A heightened state of severity is required before perceived susceptibility becomes a powerful predictor. In that situation, perceived susceptibility will be a stronger predictor of intention to engage in health-related behaviors than it will be a predictor of an actual engagement in health-related behaviors (Janz, Champion and Strecher, 2002, p.61). Together, the twodeterminants form the perceived threat. Although, their potential influence on behavior change is evident many studies note they do not explain all behaviors (Tuner, 2004).
The perceived benefits must outweigh the perceived barriers. The construct of perceived benefits is an opinion of the value or the usefulness of a behavior. It may include the construct of outcome expectancies from SCT or perceived action efficacy. When an individual has a high belief that the new behavior will decrease his/her chance of developing a disease, s/he is more likely to adopt it. Also, it includes other positives attributes of the action or non health-related benefits (Janz, Champion and Strecher, 2002, p.48).The construct of perceived barriers is the opinion about the difficulties and obstacles that an individual has to pass through when performing the new behavior. Perceived benefits and barriers will be stronger predictors of behavior change when perceived threat is high than it is low (Janz, Champion and Strecher, 2002, p.61).
Another construct of the HBM is the cues for action which are events that help
pg. 14
that require significant skills to perform (Janz, Champion and Strecher, 2002, p.61). Finally, HBM considers other variables that influence the four major constructs (perceived severity, perceived susceptibility, perceived benefits and perceived barriers) called modifying factors. They could be socioeconomic and demographic variables. Unfortunately, researchers have difficulty measuring the impact of modifying variables in behavior change.pg. 15
Table3:HBM Concepts and Potential Change StrategiesFrom Glanz and Rimer, 2005, p.14
Considered Key Concepts for our Barrier Analysis:
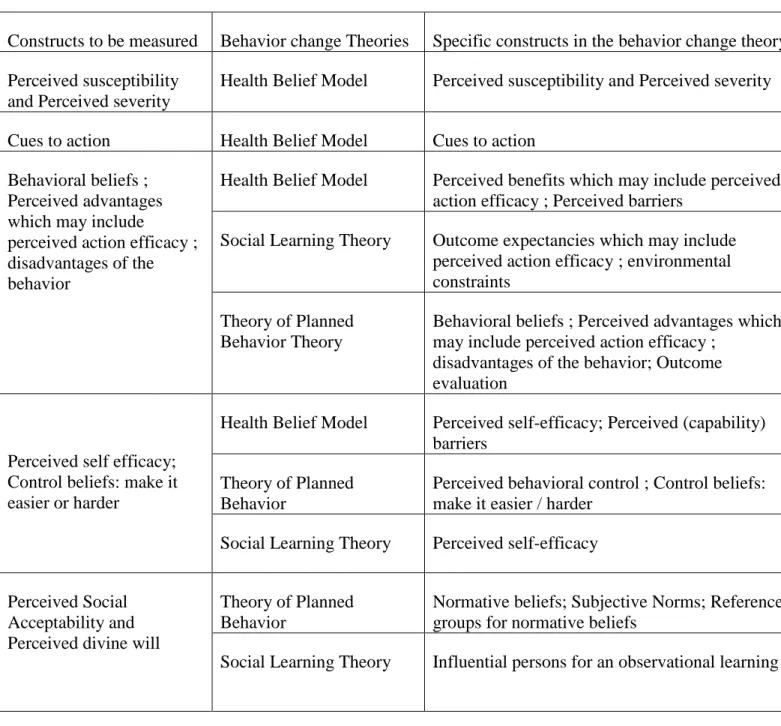
The proposed barrier analysis method focuses on the individual and interpersonal level of the social ecological model. The health behavior determinants considered in this approach were drawn from the main constructs of the above three cognitive value- expectancy theories: health belief model, theory of planned behavior, and the social learning theory. It retains eight
pg. 16
Table 4. Barrier Analysis Measured Constructs and their Root Behavior Change TheoriesConstructs to be measured Behavior change Theories Specific constructs in the behavior change theory Perceived susceptibility
and Perceived severity
Health Belief Model Perceived susceptibility and Perceived severity
Cues to action Health Belief Model Cues to action Behavioral beliefs ;
Perceived advantages which may include
perceived action efficacy ; disadvantages of the behavior
Health Belief Model Perceived benefits which may include perceived action efficacy ; Perceived barriers
Social Learning Theory Outcome expectancies which may include perceived action efficacy ; environmental constraints
Theory of Planned Behavior Theory
Behavioral beliefs ; Perceived advantages which may include perceived action efficacy ;
disadvantages of the behavior; Outcome evaluation
Perceived self efficacy; Control beliefs: make it easier or harder
Health Belief Model Perceived self-efficacy; Perceived (capability) barriers
Theory of Planned Behavior
Perceived behavioral control ; Control beliefs: make it easier / harder
Social Learning Theory Perceived self-efficacy
Perceived Social Acceptability and Perceived divine will
Theory of Planned Behavior
Normative beliefs; Subjective Norms; Reference groups for normative beliefs
Social Learning Theory Influential persons for an observational learning
Perception of divine will was introduced based on the Food for the Hungry field experience and other program manager. It happens that perception of divine will is a very
pg. 17
Doers and Non Doers ComparisonA big innovation added to behavior theories is the introduction of some tools and techniques from epidemiology and statistics to assess the strength of association between behavior determinants (exposure) and the health behavior of interest (disease). We have to acknowledge the work of Academy for Education Development in sharing its resources on doers and non doers analysis. It is a qualitative way to compare the characteristics between doers and non doers based on data collected through focus group discussion and trying to identify the differences between the two groups (AED, 2004). We keep the idea but in the barrier analysis we are proposing here we introduce a quantitative approach as promoted by Food For the Hungry International and derived from the tools originally developed by Thomas Davis in 2004. It looks like a case-control study design which examines a relation of an exposure to a certain disease. We identify a group of individuals with that disease (called cases) and, for purposes of
comparison, a group of people without that disease (called controls) (Gordis, 2009).
In this quantitative barrier analysis, we will introduce the principle of statistical inference comparing two “same” populations with two different behavioral outcomes and investigate their exposure to each of the potential behavior determinants that we identified based on the former health behavior theories. This will allow us in practice to see how strong each potential determinant to the behavior for a specific population is as well as to be sure of their
pg. 18
This comparison is based on hypothesis testing that is moving away from theories to real world practice. As explained by Moore & MacCabe (2004), in hypothesis testing, we need to state the assumption or null hypothesis (H0) and state an alternative hypothesis (Ha), first. Then,we assume that H0 is true. Afterward, we need to collect evidence through a sample. Also, we
need to compute a test statistic, then the value and/or confidence of intervals. Based on the p-value or confidence intervals we can conclude if there is enough evidence against H0.
The statistical problem is the following: is there any association between a potential behavior determinant and an actual behavior? All the behavioral theories we learned so far talk about potential behavior determinants. Behavior theories tell us the existence of a cause and effect relationship between determinants and a behavior. Classic surveys such as Knowledge, Practices and Coverage surveys measure only some determinants and behaviors at a certain point of time. Based on the results, health promoters try to develop interventions that may increase or decrease potential behavior determinants without a clear knowledge of the change power of each determinant to a given behavior.
In a barrier analysis survey, we have to compare mostly two categorical variables. The existence of association between such variables may be tested by using two main approaches: comparing two proportions or using two-way tables1. We can compare the proportions of the same exposure variable between two populations with different outcomes. We may test the difference in proportions or the ratio of the two proportions. In this paper, we will present here the two-way table which can be used for two categorical variables that can be used for multiple subcategory variables. This is a big advantage from the comparison of two proportions.
However, we cannot do a two-tailed test. That means our test is unidirectional. The explanatory behavior theories we are using suggest to us the direction of each determinant.
1
pg. 19
Let’s take two dichotomous variables to illustrate a two-way table. The first variable isthe health behavior determinant and the second is the desired behavior.
So, when we assume that there is no association and H0 is true, we will have the
marginals (n1, n2, m1, m2) fixed because the two variables are independent. Hence, it is easy to
calculate the expected value in the remaining cells (see Table 5).
Table 5: Example of a Two-Ways Table
Doers Non Doers Total
With determinant
n11 n12 n1
Without determinant
n21 n22 n2
Total
m1 m2 N
Expected cell count = (row total x column total)/Table total
The idea of the hypothesis testing here is to compare the observed counts with the expected counts. So, if they are very different, we have enough evidence that it is not likely due to chance i.e. there is an evidence of association.
The statistic test we will use is the Chi-square that will compare the observed and the expected value under the assumption there is no association.
X2
=
The two-way table with r rows, c columns
H0: no association ; Ha: any association. If H0 is true, the
X
2
has approximately a Chi-Square
x
2 distribution with (r-1)(c-1) degrees of freedom. Then, we can compute the p-value andpg. 20
Barrier Analysis: an Approach to Design BCC strategy and planningThe barrier analysis approach I will present here considers all the behavior theories discussed. Briefly, it is a rapid assessment method helping health professionals to identify the most influential determinant(s) among eight determinants of a health behavior at intrapersonal and interpersonal levels. Based on those powerful determinants, they can plan behavior change communication (BCC) strategy and create an action plan to promote healthy behavior among a specific population. Although it acknowledges that broader levels like the community does influence and is influenced by the individuals according to the ecological model, the barrier analysis presented here will not address the physical and political environment. I will explain the study design and then discuss results based on one behavior of interest to illustrate the data use for BCC planning.
Barrier Analysis Design:
pg. 21
Like all studies, barrier analysis starts with a document review about the target population and its characteristics. In February 2009, we conducted a baseline survey to have a snapshot of the situation before our intervention. It will help us to design more specific studies and to evaluate the outcomes and impact of our intervention later. Like in many developing countries, children less than five years are severely affected by malnutrition. 28.8%and 29.2%of children aged respectively 0-59 months and 0-23 months are underweight (WAZ<-2). However,according to WHO and UNICEF in 2004, malnutrition is associated with 54% of death of children less than five years in the world (see figure 4).
Figure 4: Annual Child Deaths from Pneumonia, Malaria, Diarrhea and Malnutrition
pg. 22
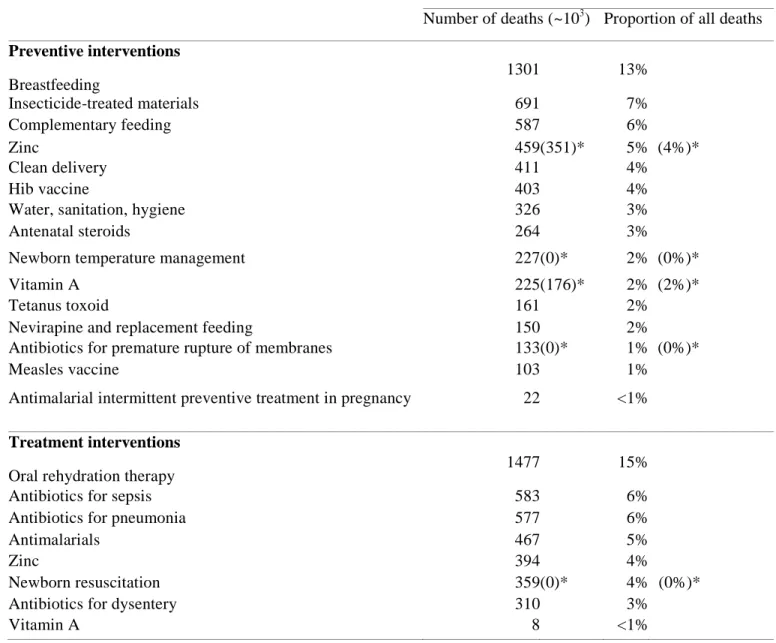
starting to introduce progressively complementary food from the sixth month while the breast milk is not enough for children’s growth. To prevent malnutrition, exclusive breastfeeding for children aged less than six month is one of the Essential Nutrition Actions which arerecommended by WHO and UNICEF as well as the Congolese Ministry of Health. According to our baseline survey, only 28.4% of beneficiary children 0-5.9months were exclusively breastfed in the last 24 hours. A published research in developing countries by Lancet in 2003
demonstrated breastfeeding practice prevents 13% of deaths for children under five (see Table 6).
Define the Objective, Behavior and Target Group:
An initial assessment must be conducted to have a better understanding of the current health status of a community. Health status is usually determined by many factors which pertain to either the environment system and/or to some behaviors of specific population groups. When health professionals want to improve the current health status of a specific sub population, they must formulate the desired health status as the goal of the intervention. This goal/objective formulation will help them to assess later the impact and effectiveness of the intervention (European Commission, 2002; Gielen and MacDonald, 2002).
pg. 23
beneficiary children 0-5.9 months who were exclusively breastfed in the last 24 hours to 80% by the end of the project (Indicator Performance Tracking Table). Based on our baseline survey, 98% of caregivers are biological mothers. Thus, we decided to focus on biological mothers of children aged 0 to 5.9 months as the primary target group. The barrier analysis may inform us on secondary and tertiary target groups.Table 6: Under-5 deaths that could be prevented in the 42 countries with 90% of worldwide child deaths in 2000 through achievement of universal coverage with individual interventions
Estimated under-5 deaths prevented
Number of deaths (~103) Proportion of all deaths
Preventive interventions
Breastfeeding
Breastfeeding
1301 13%
Insecticide-treated materials 691 7%
Complementary feeding 587 6%
Zinc 459 (351)* 5% (4%)*
Clean delivery 411 4%
Hib vaccine 403 4%
Water, sanitation, hygiene 326 3%
Antenatal steroids 264 3%
Newborn temperature management 227 (0)* 2% (0%)*
Vitamin A 225 (176)* 2% (2%)*
Tetanus toxoid 161 2%
Nevirapine and replacement feeding 150 2%
Antibiotics for premature rupture of membranes 133 (0)* 1% (0%)*
Measles vaccine 103 1%
Antimalarial intermittent preventive treatment in pregnancy 22 <1%
Treatment interventions
Oral rehydration therapy 1477 15%
Antibiotics for sepsis 583 6%
Antibiotics for pneumonia 577 6%
Antimalarials 467 5%
Zinc 394 4%
Newborn resuscitation 359 (0)* 4% (0%)*
Antibiotics for dysentery 310 3%
pg. 24
Source: Jones G, Steketee R, Bhutta Z, Morris S. and the Bellagio Child Survival Study Group. "How many child deaths can we prevent this
year?" Lancet 2003; 362: 65-71
Develop the Behavior Questions
By applying the doers and non doers method, we need to distinguish clearly who can be classified as practicing the behavior in question and non practicing (outcome behavior) and who are exposed to a behavioral determinant and who are not (exposure). This step is very critical since we need to reduce biases and confounders. Selection bias may be the result of the process of either study population identification or preferential selection of participants. Also, it may be from respondents as a self-selection bias or the process of selecting participants itself. Due to personal motivation, some participants may want to be selected as participants even if they do not meet the selection criteria as doers or non doers. Researchers must develop and apply clear, objective and specific case definitions and selection criteria when recruiting participants. Also, having a very low non response rate contributes to reducing selection biases. (Bayona & Olsen, 2004, p.21; Gordis, 2009, p.247).
Public health promoters must assess the possibility of recruiting doers for the study. If it is not practical to find enough doers for the behavior of interest, it may be more useful to conduct focus groups only among non doers or loosen the case definition. Performing focus groups among non doers only may provide richer information about the health behavior determinants. “It is sometimes difficult to find 30 “doers” of a particular behavior. In this case, it would
pg. 25
would be fewer benefits of a quantitative study.” (Davis, 2004). Loosening the case definitionmay be another option but may increase non differential misclassification bias, another type of information bias. (Aschengrau, 2003; Bayona & Olsen, 2004; Gordis, 2009, p.249).
For our case study, we defined as a doer: biological mothers of children aged 6 to 11 months who gave only breast milk without other liquids when those children were aged 0 to 5.9 months. Non doers are biological mothers of children aged 6 to 11 months who did not give only breast milk, without other liquids when those children were aged 0 to 5.9 months. To be
considered as a real doer, mothers must have practiced exclusive breastfeeding during the whole first six months of their children. We chose only biological mothers since 98.0% of caregivers are biological (baseline study, Feb. 2009). Also, to reduce recall bias, we limited participants to mothers who have children aged 6-11 months at the survey period.
According to our baseline survey, we can find approximately one doer to every three non doers (ratio doer/non doer =1:3) among mothers with children aged 0-5.9 months. We assume the same for all mothers with children more than six months but less than one year who are supposed to have experienced the 0-5.9 month motherhood a few months earlier. This ratio suggests the appropriateness of the quantitative approach that we will apply in this proposed barrier analysis method.
Sampling Methodology:
Random sampling method is the best way to avoid other selection biases and
confounders. The simple random sampling (SRS) is the ideal way to select units from the survey universe. Most studies do not use SRS due to non availability of sampling frame and its
pg. 26
random sampling method to overcome the challenge of SRS (Espeut, 2001; Magnani, 1997; Moore & MacCabe, 2004). In cluster sampling, clusters are randomly selected from the general population. Then, individuals within each cluster must be randomly selected (Espeut, 2001; Magnani, 1997). Since the doers and non doers approach requires the comparison of the two populations, we will take from the general population two subpopulations of doers and non doers.Based on a small survey we conducted just before the barrier analysis study estimating the eight (08) main indicators, 45% of mothers think that their 0-5.9 month children can be malnourished when they are not exclusively breastfeed. Therefore, as sample sizes, we chose 45 Doers and 45 Non Doers to detect 25% difference between the two groups assuming standard parameters of 95% level of significance and 80% power, and by aligning with the most
demanding proportion of 45% (see Appendix 1). For one-sided test, the formula that can be used
to identify the same sample size for the two groups is the following (Sarriot et al, 1999):
N1=N2=D*([Zα + Zβ ]2/(p1-p2)2)
We will use the simplified version of this formula (Magnani, 1997; Sarriot et al, 1999): N1=N2 = D [(Zα + Zβ)2 * (P1 (1 - P1) + P2 (1 - P2)) /(P2 - P1)2]
N1=N2 = required minimum sample size per survey round or comparison group D = design effect P1 = the estimated level of an indicator measured as a proportion for the control area P2 = the expected level of the indicator either at some future date or for the project area such that the quantity (P2 - P1) is the size of the magnitude of change it is desired to be able to detect Zα = the Z-score corresponding to the degree of confidence with which it is desired to be able to
pg. 27
level of statistical significance), and Zβ = the z-score corresponding to the degree of confidence with which it is desired to be certainof detecting a change of size (P2 - P1) if one actually occurred (β -statistical power).
Our project intervention covers two territories (Kalemie and Moba) of the District of Tanganyika. We selected 45 doers and 45 non doers from each territory so that we had 90 doers and 90 non doers in total from both territories.
To select sampling units, we only used two-stage cluster sampling since we have the numbers of mothers with children aged 0-23 months per village based on a former census used during
baseline. “When measures of cluster size are available, the statistically most efficient two-stage cluster design is one in which (1) clusters are selected with probability-proportional-to-size (PPS) at the first stage of sample selection and (2) a constant number of households is chosen from each cluster at the second stage.” (Magnani, 1997, p.24). At first stage, we randomly selected 23 villages (clusters) by using probability proportional to size method.
Then, at each selected village, two sampling unit per cluster and, as a result, the problem of homogeneity is almost negligible. We assume that the design effect D=1. Additionally, when we took the two units in each cluster, we choose the next fifth from the first selected central household through a random walk as applied in Expanded Program Immunization method. Based on the definitions of doers and non doers, selection criteria were developed. Screening questions were asked at the beginning of each interview to select participants during the random-walk.
Develop Questions about Determinants
pg. 28
disadvantages, perceived action efficacy, perceived self-efficacy and control beliefs, social acceptability (social norms), perception of divine will, and cues for action (See Table 4). Since we chose to conduct a survey to compare those determinants between doers and non doers, we need to develop a questionnaire form and administer it among respondents from the two groups. A non accurate measurement will create information biases (Bayona & Olsen, 2004). One group may remember differently exposure than the other group (recall bias). Or, interviewers may administer questions differently between the two groups (interviewer bias). Therefore, we need to apply all techniques in questionnaire development and administration to avoid observation errors that we cannot control after the survey.Information bias may occur from the questionnaire, or from the respondents or from the interviewers. The bad wording of a question may create systematic errors in answers. As a result, we have to spend time in identifying key questions to measure each determinant. Also,
respondents may understand the questions differently. It should reflect the social context, using local words and terms and be administered in the local language (Espeut, 2001). We used a standard questionnaire in English based on previous experience of Food for the Hungry, and then we just translated it in French. Another bias could be social desirability. Respondents want to provide answers that are expected by the others or the society and try to satisfy the interviewer by providing the expected answers even if they do not actually reflect reality. A pre-test was conducted among women with the same characteristics of our target population to see how people understand and detect potential biases. Then, we reviewed and finalized the questionnaire (see Appendix 2) to reduce bias.
pg. 29
interviewees in confidence or not asking for their informed consent. These frequent mistakes reduce the quality of the data collection because they create systematic errors from the interviewers or ignore some basic ethics in statistical surveys. To avoid all these potential problems, we trained the data collectors in the barrier analysis first and also in data collection skills. Moreover, we explained to them the objective of each question and the pretest session was an opportunity for them to master each question of the questionnaire. Finally, we assigned supervisors to supervise enumerators during questionnaire administration and at the end of each day, they reviewed each questionnaire. Errors identified by supervisors were immediately addressed in the field by going back to the respondents. The non response rate is 0% as it was during the baseline survey.To process data collected for this barrier analysis, we can use statistical software. Additionally, there is an excel file format with formulas that can be used if there is no access to statistical software. Using this, the team has to perform manual tabulation of each answer. For our project, we chose EPI-Info software to process and analyze data. We developed a data entry screen in the “make view” menu (see Appendix 3) and trained two data entry agents. We controlled data quality by doing an exploratory analysis. When we find some outliers we come back to the questionnaire sheet to check the data. Errors detected at this level must be fixed by asking the appropriate supervisor to get back to the respondent. Supervisors facilitated the coding of some open ended questions such as benefits and barriers to the behavior among enumerators. Coding forms were provided for each exercise (see Appendix 4).
Main significant results for Exclusive Breastfeeding behavior for 0-5.9 months children
pg. 30
Perceived SusceptibilityThere is a significant difference between the two groups although the perceived
susceptibility is relatively high. (OR=0.24, p-value =0.000284). Doers are 4 times more likely to perceive that their children less than six months are susceptible to malnutrition if they do not exclusively breastfed these children than non doers. Thus, we can say that perceived
susceptibility can be of interest if we want to promote exclusive breastfeeding.
Perceived Severity
There is no difference between the two groups. Both groups have a very high perceived severity of malnutrition. Both the two groups perceive that malnutrition is a severe disease which may lead to death. 97% of each group thinks that malnutrition is a serious disease. Also 96% and 92% of respectively doers and non doers think that a child can die due to malnutrition. So, perceived severity is not a worthy determinant to address in order to change exclusive breastfeeding practice among mothers. In addition, it is already very high.
Behavioral beliefs
There is a difference between the two groups for the perceived advantage of preventing child illness from exclusive breastfeeding (OR=0.42, p-value=0.00420). Doers are 2.4 times more likely to perceive the child illness prevention advantage due to exclusive breastfeeding than non doers. Therefore, emphasizing the benefit of child illness prevention from exclusive
pg. 31
No significant perceived disadvantage was identified. Few biological mothers (11.11%), mainly in Moba think that exclusive breastfeeding makes children sick. In Moba, it raises up to (12.22%). However, in Moba, there is no difference among the two groups while non doers were more likely to perceive this disadvantage in Kalemie than doers (OR=9.51; P_value=0,0139).Perceived Action Efficacy
There is a significant difference between the two groups (OR=0.32, p-value=0.00068). Doers are 3.12 times more likely to think exclusively breastfeeding their children less than 6 months prevents them from malnutrition than non doers. The percentages of mothers who think that practicing exclusive breastfeeding will help their children avoid malnutrition are 81% and 58% respectively for doers and non doers. This result confirms conclusion of the social cognitive theory about the importance of the individual’s positive expectations of the behavior in
motivating the action as long as they outweigh their negative expectation (Kritsonis, 2004-2005).
Perceived Self-Efficacy
There is a difference between the two populations (OR=0.18, p-value=0.000003). On perceived self-efficacy, doers are 5.6 times more likely to think they could exclusively breastfed their children less than 6 months with their current skills and resources than non doers. This conclusion supports Bandura who considers the perceived self-efficacy as the most important determinant in behavior change and why it becomes a nearly ubiquitous construct in health behavior theories (Glanz and Rimer, 2005, p.21).
Control beliefs:
Household food security (especially for lactating women), enough breast milk
pg. 32
breastfeeding easier. The opposite will make it harder. However, globally, we did not find any difference between doers and non doers except for healthy children perception. We notice significant difference between doers and non doers on that unhealthy children make exclusive breastfeeding harder (OR=2.2, p-value=0.0127). Non doers are 2.2 times more likely to think that the child’s sickness makes exclusive breastfeeding more difficult than doers.Both doers and non doers mothers think that women should eat more than usual to produce milk. However, “insufficient breast milk is an extremely rare condition even for malnourished women.” (Deller, 2006). So, acting on this barrier would not change non doers to
become doers.
Perceived Social Acceptability (Social Norms)
Both groups think that no social norm prevents them from practicing exclusive
breastfeeding for their children less than 6 months. Also, the majority of people around them has approved or would approve of them practicing exclusive breastfeeding for their children 0 to 5.9 months. Moreover, we noticed that husbands, health agents at primary health centers, mothers, and neighbors are generally reported to socially support mothers to exclusively breastfeed their 0-5.9 month children. However, data only show a difference between the two groups for the approval of the husbands (OR=0.43, p-value = 0.0131). Doers are 2.3 times more likely to think that their husbands would approve of them practicing breastfeeding exclusively than non doers.
pg. 33
normative beliefs to subjective norms. We would suggest a review of this question in the future. Francis et al (2004) propose the following options to directly measure social norms:a. Most people who are important to me think that:
I should 1… 2… 3… 4… 5… 6… 7 I should not practice [the behavior] b. It is expected of me that I practice [behavior]
Strongly disagree 1… 2… 3… 4… 5… 6… 7 Strongly agree c. I feel under social pressure to practice [the behavior] Strongly disagree 1… 2… 3… 4… 5… 6… 7 Strongly agree
d. People who are important to me want me to practice [the behavior] Strongly disagree 1 2 3 4 5 6 7 Strongly agree
To be more analytical, it may also be useful to indirectly measure the subjective norms by first conducting elicitation interview through a qualitative research, common normative beliefs about the behavior and reference groups. Then, use quantitative method to assess the strength of belief for each common normative belief and the motivation to comply.
Perception of Divine Will
pg. 34
Cues to ActionData showed there is a significant difference between the two populations (OR=8.61, p-value=0.00000001). On cues for action, the percentages of mothers who think it would be difficult for them to remember not to give their children anything other than breast milk during the day if they want to exclusively breastfeed them are 10% and 49% respectively for doers and non doers. Finding a strategy and activities to help lactating mothers to remember each step and the frequencies of exclusive breastfeeding will facilitate practice.
b- Differential analysis:
Results per territory:
Globally, there are not too many differences in terms of association between exclusive breastfeeding behavior and its potential determinants between Kalemie and Moba territories. However, while the test was not significant in Moba, in Kalemie the results suggest existence of association for the following points: control beliefs (child illness and breast milk insufficiency), the behavioral belief of child illness prevention and the behavioral belief of child illness
promotion, perceived social acceptability and the husband’s approval for the behavior adoption. In Kalemie non doers are 2.67 times and 2.81 times more likely to think that the child illness (OR=2.67; P_value=0.0384) and breast milk insufficiency (OR= 4; P_value=0.01123) respectively makes the exclusive breastfeeding practice more difficult than doers. Also, doers are 3.7 times more likely to think that their husbands would approve of them to breastfeed
pg. 35
2.78 times more likely to believe that the practice of exclusive breastfeeding during the first six months of birth prevent child illness than non doers (OR=0.36; P_value=0.019). Another finding about social acceptability is that doers are 2.78 times more likely to perceive that most of the people that they know have approved of them exclusively breastfeeding their 0 to 5.9 months children than non doers (OR=0.36; P_value=0.0342).Results per age group of biological mothers
Glanz and Rimer (2005) note that at the interpersonal level, theories of health behavior assume individuals exist within, and are influenced by, a social environment including family members, coworkers, friends, health professionals, and others. These theories affirm that the opinions, thoughts, behavior, advice, and support of the people surrounding an individual influence his or her feelings and behavior, and the individual has a reciprocal effect on those people. In line with that assumption, the social cognitive theory which is one of many theories focusing at the interpersonal level, talks about the concept of the observational learning (modeling).
pg. 36
Matching ensures that any difference between cases (doers) and controls (non doers) cannot be a result of differences in the matching variables (Bland and Altman, 1994).Use of Results:
Selecting Priority Target Audiences
Our project objective is to prevent children 0-5.9 months from malnutrition which is associated with a big proportion of child death. Exclusive breastfeeding is a preventive behavior that is the focus of our BCC strategy. The primary target audience is the group of individuals who are supposed to directly perform the healthy behavior. In our case, we have the biological mothers of 0-5.9 month children. Secondary target audience is composed of husbands, mothers and peers. Husbands must be specifically targeted to understand the preventive behavior. According to the data, difference between doers and non doers in terms of husband approval is more pronounced in Kalemie than Moba. Based on the above interpersonal theories, husbands should be sensitized to provide supports, particularly emotional and instrumental supports, for their lactating wives. Also, mothers and peers should bring these social supports to the lactating
0 5 10 15 20 25 30 35
15-19 20-24 25-29 30-34 35-39 40-44
Co u n ts in t h e Sam p le s
Age Intervals in Year
Figure 6: Age Distribution of the Interviewed Biological Mothers of 6-11month Children
Doers
pg. 37
women. Finally, religious leaders based on the importance of per ceived God’s will among our primary target audience and health agents at health centers (reported by 24% of respondents as reference) are tertiary target audience.Activities of Interest Based on the theories used in barrier analysis and the data results
According to the above cognitive theories, health behavior education is a key strategy to change beliefs in favor to behavior change (McLeroy et al, 1988, p.356). Health education and the social supports (emotional, informational, instrumental and appraisal) should be provided by influential individuals through social network. Also, according to the social cognitive theory, these influential individuals should play role model positions. Therefore, creating group supports and education will be a key intervention in our area intervention.
According to our experience in developing country rural areas, a voluntary lay health worker cannot support more than 15 people to be effective. Therefore, we can organize pregnant women and lactating women in support groups of 10 to 15 women. Each group will elect one opinion leader from group members. These opinion leaders will be trained by the program to become lay health workers and will go back to their individual groups to provide health
education and behave as the role models within the support groups. Interpersonal communication like home visits, counseling, and group discussions will be the main techniques for lay health workers. However, culture friendly mass communication through radios, cultural events, campaigns, public relations, etc. may help as well.
pg. 38
specifically for religious leaders. They can be a channel of communication in favor of theexclusive breastfeeding by using biblical, Quran or other traditional references.
Essential nutrition actions, specifically optimal breastfeeding should be integrated in the essential activity package at primary health centers. Advocacy must be conducted to the local health authority. Also, health agents should be trained to provide informational and appraisal supports to pregnant women during antenatal visits and lactating women during postnatal visits.
Axes of the Messages
Our messages must be built around the behavioral determinants of interest identified during the barrier analysis and culturally friendly.
Increasing perceived susceptibility:
The message should focus on the fact that every child aged of 0-5.9 months, including one’s child could become malnourished if they are not exclusively breastfed. This message can
be supported by appraisal supports provided through support groups, health agent contacts and testimonies from people in close relationships or in neighborhood whose 0-5.9 month children experienced malnutrition while not practicing exclusive breastfeeding. Reconverted doers and lay health workers can play role models through support group networks. Although the data show a high perceived severity of malnutrition, maintaining message communication should be provided reinforcing that malnutrition is a very serious disease that may lead to 0-5.9 month child death if they are not exclusively breastfed.
pg. 39
The main message should emphasize that exclusively breastfeeding children less than 6 months will protect them from childhood illness. Telling that this practice makes children sick is a myth. Informational supports and testimonies from converted doers, lay health workers and health workers at health center will help to deliver this message. Target women will have an opportunity to compare the child health status of doers and non doers in their neighborhood.Increasing perceived action-efficacy:
Exclusive breastfeeding of children less than six months prevent malnutrition is the message for increasing perceived action-efficacy. Again, informational supports and testimonies from converted doers, lay health workers and health workers at health centers will help to deliver this message. Target women will have an opportunity to compare the child health status of doers and non doers in their neighborhood.
Increasing perceived self-efficacy:
As suggested by the above theories, to increase self efficacy, messages and actions should be focused on the control beliefs: on training, what makes the practice easier and what makes it harder. Data show that food security, health status of breastfeeding mothers and the breastfed children, and breast milk insufficiency are mostly cited factors perceived to make exclusive breastfeeding easier or harder. These findings may suggest we need to reinforce breastfeeding skills, information, emotional and instrumental support in food access, breast milk production, feeding of sick child, health and mother nutrition, and breastfeeding even if the mothers are sick.
pg. 40
good attachment, childhood illness danger signs for seeking health care, etc. Additional totrainings, here are some few messages that can be developed:
Breastfeeding messages for primary target audience:
- Mothers, start breastfeeding your newborn children within one hour of birth
- Mothers, exclusive breastfeed your infants on demand, day and night during the six first months of life
- Mothers, when breastfeeding your child, make sure of his or her good attachment - Mothers, keep exclusively breastfeeding your 0-5.9 months children even when you are
sick
- Mothers, keep exclusively breastfeeding your 0-5.9 months sick children
Maternal health and nutrition messages for primary and secondary target audiences:
- Breastfeeding mothers should eat nutritious foods and greater quantity for their health and their baby, give them adequate food.
- Breastfeeding mothers should be healthy to facilitate exclusive breastfeeding practice, provide them appropriate health care.
Promote food security and crop diversification to general population:
- Household diet diversity means healthy household, please diversify crop production and daily diet
pg. 41
Finally, to maintain and increase perceived self-efficacy, lay health workers shouldcongratulate mothers when they achieve progressive steps toward a permanent change.
Moreover, they can organize a series of graduation ceremonies for certain achievements within the community.
Increasing perceived social acceptability (social norms):
Messages should target the primary audience and the general population to maintain or increase social acceptability promotion among pregnant and lactating women that the society approves of them to practice exclusive breastfeeding
. Messages to the primary audience and the general population:
- Exclusive breastfeeding of children during the first six months of life protects them against childhood illness. Let’s support mothers in practicing exclusive breastfeeding. - Mothers, we love you and your babies, exclusively breastfeed your infants during the first
six months of life.
Husbands, mothers and peers will be encouraged to create an enabling environment (emotional and instrumental supports) for lactating women to exclusively breastfeed their 0-5.9 month children day and night. A line of messages for that purpose may be: “for a healthy newborn, be supportive (emotional, instrumental) to lactating mothers so that they can
pg. 42
Perception of divine will.Additionally, health educators, especially religious leaders can reinforce perceived self-efficacy and the perception of divine will by delivering messages supported by biblical verses like: God created women to be a source of life, so all women can produce enough milk for their 0-5.9 month children regardless of their socioeconomic status. Chand and Erb (2009) provided biblical verses for mother and newborn health. They suggest the following verses among many for breastfeeding: Luke 11:27; Isaiah 66:11; Numbers 11:12; Psalm 22:9, etc. While combined with the above messages, they may reinforce God’s will by creating all women to be able to save life through breastfeeding.
Cues to action:
Lactating women need some cues to help them remember not to give anything other than breast milk during the first six month of the baby’s life. Additional to the supports from people around them, the use of local songs pertaining to exclusive breastfeeding techniques will also remind mothers about exclusively breastfeeding their 0-5.9 month children. Associating these songs to women or children’s day-to-day life may increase the likelihood of lactating women to
remember it. The content of these songs should focus on the above recommended messages. . A community song competition is an easy way to identify culture friendly songs from the
community and for the community.
Conclusion
pg. 43
behaviors of interest. It is a powerful tool for public health professionals to guide strategy design for behavior change communication. The added value that this approach brings to public health practitioners is the introduction of concepts and techniques from case-control studies todetermine the powerful behavior determinants among those suggested by theories. This allows public health professionals to plan cost effective interventions for changing behavior. While we present the foundation of the barrier analysis approach in this academic paper, a very simple toolkit is available for field practitioners to conduct such analysis in a few days.
We learned from this case study that using matched case-control design and stratified case-control design may improve the precision of the barrier analysis to inform behavior change communication strategy. However, we should make a compromise between the need for
precision and the cost increase generated by the increase of sample sizes or its user-friendly characteristics.
While keeping it simple for management purpose, we still recommend the review of the instrument measure (questionnaire) to better capture the main constructs recommended by our behavioral theories. Additionally, exposure dose- response may affect behavior. Therefore, we need to measure behavioral determinant on a continuous scale answers like “very strongly agree” to “not agree at all” instead of “yes or no” answers. Statistical tests of scaled answer questions
will require a larger sample size as well as a higher cost of the barrier analysis. To reduce costs, we can qualitatively analyze differences between doers and non doers for the scaled answers while using quantitative analysis by grouping them to become “yes/no” answers. Moreover, the
pg. 44
As this barrier analysis approach focuses on intra and interpersonal level of the ecological model, theories and models emphasizing the community levels are necessary to develop and implement a more comprehensive program addressing behavior change. As Janz, Champion and Strecher (2002) noticed, permanent changes in behavior can rarely be wrought solely by direct attacks on belief systems. Even more, when the behavior of large groups is the target,interventions at societal levels (social networks, work organizations, physical environment, public policy, etc.) along with interventions at the individual level will likely prove more effective than single-level interventions. As Gielen and MacDonald (2002, p.418) note,
measurable objectives should be written to evaluate changes during implementation: “how many will know, believe, or be able to do what by when?” Moreover, curricula and message
pg. 45
Appendix 1- Sample size (SS) determination with a confidence level 0f 95% and a power of 80%Keys behavior
determinants Main indicators
Proportion estimates
Sample size requirement to detect difference of
20% 25% 30%
Perceived severity
Percentage of mothers who think that
malnutrition is a serious disease 87.8% 4
Perceived susceptibility
Percentage of mothers who think that their 0-5.9 m children can be malnourished when they
are not exclusively breastfeed 45.0% 73 45 30
Perceived Action Efficacy
Percentage of mothers who think that exclusive breastfeeding their children until they are/were 6 months old would help them to avoid
becoming malnourished 69.4% 47 26 15
Perceived strength of the belief
Percentage of mothers who think that
exclusive breastfeeding children during the first
6 months of life is important 78.3% 29 13 5
Perceived Self-efficacy
Percentage of mothers who think that with their present knowledge and skills, they could
exclusively breastfeed their children until s/he
is 6 months old 72.2% 42 23 12
Perceived Social
Acceptability
Percentage of mothers who think that most of the people that they know would approve (or would have approved) of them exclusively
breastfeeding their 0-5.9m children 68.9% 48 27 15
Perceived Divine Will
Percentage of mothers who think that God/the god/fates approve (would approve) of them exclusively breastfeeding their children until
they are six months old 70.0% 46 25 14
Cues to action
Percentage of mothers who think that it would be not difficult at all for them to remember not to give their 0-5.9m children anything other than breast milk, including water, during the day if they wanted to exclusively breastfeed their 0-5.9m children until the children are/were
six months of age 70.6% 45 25 14
pg. 46
Appendix 2- Questionnaire FormBarrier Analysis Questionnaire on
Exclusive Breast-Feeding
Mothers of Children 6-11m, Food for the Hungry
Interviewer’s Name: ___________________Questionnaire No.: ______
Date: ____/____/____ Village: _____________ GROUP: Doer NonDoer
Age of Mother Interviewed: ____ years Age of mother’s youngest child: ____ months
First NAME of youngest child between 6-11 months of age: ______________
REFER TO THIS CHILD THROUGHOUT THE INTERVIEW
Discuss CONFIDENTIALITY:
Purpose of study
They can choose to participate or not participate in the study. No services will be withheld
nor will they be discriminated against if they choose not to participate.
pg. 47
(Screening Questions for Respondents whose youngest child is between 6-11 months of age)1. What is your relationship to this child ( If mother, prompt biological or adoptive)
1. Biological mother 2. Adoptive mother end questionnaire
3. Grandmother end questionnaire 4. Aunt end questionnaire
5. Other (Specify:_______________) end questionnaire
2. How old was your (NAME) when you first gave him/her something to drink other than breast milk? ______ months
3. How old was your child when you first gave him/her something to eat other than breastmilk? ______ months
If response to questions #2 and #3 are BOTH 6 months or greater Then mark the respondent as a DOER at the top of page one. If response to either question #2 or question #3 is less than 6 months
then mark the respondent as a NONDOER at the top of page one.
pg. 48
(Perceived Severity)4. How serious a disease/problem is malnutrition: Very serious, somewhat serious, a little bit serious, or not serious at all?
a. Very serious b. Somewhat serious c. Just a little bit serious d. Not serious at all
5. Can a child die from malnutrition?
a. Yes b. No c. Don’t know/No Response
(Perceived Susceptibility)
6. Do you think a child who is less than 6 months old could become malnourished if they are not exclusively breastfed?
a. Yes b. Possibly c. No d. Don’t know 7. Do you think (NAME) could become malnourished if he/she is/was not exclusively breastfed?
a. Yes b. Possibly c. No d. Don’t know
(Perceived Self-Efficacy)
8. With your present knowledge and skills, do you think that you could exclusively breastfeed (NAME) until s/he is 6 months old? If (NAME) is 6 months or older ask – do you think you could exclusively breastfeed your next child until s/he is 6 months old?
a. Yes b. Possibly c. No c. Don’t Know
9. What would make (or would have made) it easier for you to exclusively breastfeed (NAME)?
pg. 49
(Perceived Action Efficacy)11. Do you think exclusively breastfeeding (NAME) until s/he is/was 6 months old would help (NAME) to avoid becoming malnourished?
a. Yes b. Possibly c. No d. Don’t know
(Perceived Social Acceptability/Social Norms)
12. Would most of the people that you know approve (or would have approved) of you exclusively breastfeeding (NAME)?
a. Yes b. Possibly c. No d. Don’t know
13. Who are the people that would approve (or would have approved) of you exclusively breastfeeding (NAME)?
a. Husbands b. Mother c. Cousins d. Neighbors
e. Friends f. Other Specify_______________________
14. Who are the people that would disapprove (or would have disapproved) of you exclusively breastfeeding (NAME)?
a. Husbands b. Mother c. Cousins d. Neighbors
e. Friends f. Other Specify_______________________
(Cues to action)
15. If you wanted to exclusively breastfeed (NAME) until s/he is/was six months of age, how difficult would it be for you to remember not to give (NAME) anything other than breastmilk, including water, during the day?
pg. 50
(Perception of Divine Will)16. Do you think that God/the gods/fates approve of mothers exclusively breastfeeding their children until they are six months old?
a. Yes b. Possibly c. No d. Don’t know
17. Do you think that God/the gods/fates approve (or would approve) of you exclusively breastfeeding (NAME) until s/he is/was six months old?
a. Yes b. Possibly c. No d. Don’t know
(Positive and Negative Attributes of Action)
18. What are the advantages (or would be the advantages) of exclusive breastfeeding your child until he/she is six months old? (Write all responses below)
19. What are the disadvantages (or would be the disadvantages) of exclusively breastfeeding your child until he/she is six months old? (Write all responses below)
20. How important do you think it is to exclusively breastfeed children during the first 5 months of life? Very important, somewhat important, a little bit important or not important at all?
a. Very important b. Somewhat important c. A little bit important
d. Not important at all e. Does not know the importance