Associations Between Repeated Sugar Sweetened Beverage Consumption and the Theory of Planned Behavior Constructs: Attitude, Subjective Norms, Perceived Behavioral Control,
Behavioral Intention By Lia A.W. Bauert
Undergraduate Honors Thesis
Department of Nutrition University of North Carolina 2019
Abstract
TABLE OF CONTENTS
CHAPTER 1: STUDY AIMS AND HYPOTHESES………...……1
CHAPTER 2: INTRODUCTION……….……2
2.1 Theory of Planned Behavior……..………...3
2.2 Theory of Planned Behavior applied to Sugar-Sweetened Beverage Consumption……….…4
CHAPTER 3: METHODS……...……….……5
3.1 Participants……...……….…..5
3.2 Design………...……….….6
3.3 Measures……...……….….7
3.3.1 Theory of Planned Behavior Questionnaire…….………….…….…..7
3.4 Data Acquisition, preprocessing, and analysis……...……….….7
CHAPTER 4: RESULTS……...………..…….…9
4.1 Participant Demographics………...9
4.2 Effect of Sweetness of Assigned Beverage, Time, and BMI on the Theory of Planned Behavior Constructs………..………...9
CHAPTER 5: DISCUSSION……...……….…...…....11
CITATION………...……...……….…...…………...17
APPENDIX A: DATA TABLES……...……….…….…....23
CHAPTER 1: STUDY AIMS AND HYPOTHESIS
Sugar-sweetened beverage (SSB) consumption is a risk factor for weight gain and is associated with health issues such as obesity5. In one study, researchers found that those who consumed greater than or equal to 1 SSB per day had a 37% higher risk of developing obesity compared to non-consumers1. This effect has been replicated in other studies6. Although there are known health risks with consumption of SSBs (i.e. obesity, type 2 diabetes, and cardiovascular disease), the prevalence of sugar-sweetened beverage consumption is high: 50.6% of U.S. adults consume SSBs daily5,7,8. It is critical to understand individual decisions to consume SSBs, so that
interventions that target SSB consumption can change decision-making behavior. The Theory of Planned Behavior (TPB)is a framework which explains health behavior decision-making as a combination of the constructs including subjective norms, attitudes, and perceived behavioral control9. Previous research has utilized the TPB model to examine SSB consumption in adolescents and parents, and successfully explained 34% of the variability in participant’s
intention to limit SSB to less than 1 cup/day by adolescents and parents10. However, research has not yet investigated how exposure to an SSB affects TPB constructs toward other beverages with similar or different sweetness. Since SSBs on the market range from regular sodas to fruit juices, the consumption of one type of SSB may influence the motivation to consume other SSBs. In order to reduce the consumption of SSBs in general, researchers need to understand if beverage consumption motivations are specific to a beverage, or are generalizable to other beverages of similar sweetness. Given the importance of understanding decision making for SSB
consumption, we are investigating how the exposure to a sweetened or unsweetened beverage leads to changes in TPB model constructs toward other SSBs and non-sweetened beverages. Aim 1: Assess the impact of repeated consumption of SSB or USB on TPB model constructs (affective attitude, instrumental attitude, subjective norms, perceived behavioral control, and behavioral intention) toward drinking sodas and water. The exposure of repeated SSB
consumption will change TPB constructs such that affective attitudes towards limiting consumption of soda increase, instrumental attitudes toward limiting consumption of soda increase, subjective norms toward limiting consumption of soda increase, perceived behavioral toward limiting consumption of soda increase, and behavioral intention toward limiting soda increase, as compared to the USB group.
CHAPTER 2: INTRODUCTION
In the United States, 1 in 3 adults are obese (BMI > 30 kg/m2)11. People with obesity have an increased risk of diseases such as Type 2 Diabetes, coronary heart disease, and high blood pressure12. The financial cost attributable to obesity in the US was estimated to be up to 78.5 billion dollars in 200813. Given the impact of obesity on health and its cost, it is critical for public health to understand what causes obesity. One factor suggested to contribute to the rise in obesity is the consumption of sugar-sweetened beverages (SSBs)11. Research in both longitudinal and cross-sectional studies show that individuals, both adults and adolescents, who consume SSBs have greater weight gain, which can develop into obesity7,14,15. Individuals who consumed greater than or equal to 1 soft drink per day had a 37% higher risk of developing obesity compared to non-consumers1. Importantly, there are many SSBs on the market, from regular sodas to fruit drinks with added sugars. Consumption of one type of SSB may increase the
likelihood of consumption of other sweet foods, to further increase weight gain risk. Sweetness is a strong influence on food selection and sweet preference is positively associated with increased intake of sweet foods16–18. The consumption of SSBs, like soda, can [increase/decrease] positive attitudes and perceptions of other sweet foods in normal weight and overweight/obese
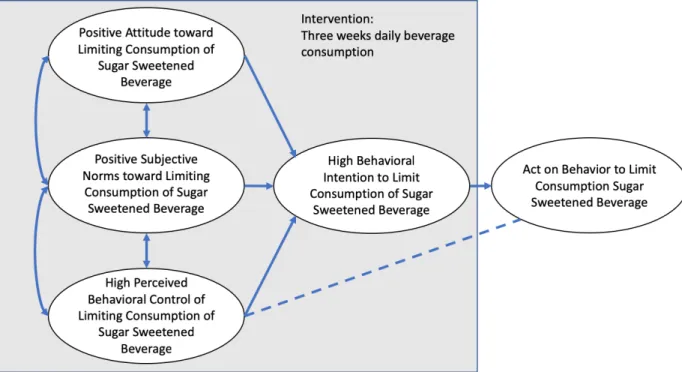
2.1 Theory of Planned Behavior (TPB)
Figure 1.
2.2 Theory of Planned Behavior (TPB) Applied to Sugar-Sweetened Beverage Consumption
TPB has been applied to SSB consumption in previous studies to understand and describe beliefs and intentions to consume SSBs10,23,24. In a study applying the TPB to SSB consumption,
Zoellner et al. (2012) found that the TPB model explained 38% of variation in SSB intake23. Intentions had the strongest relationship with SSB intake followed by attitudes, perceived behavioral control, and subjective norms9,23. Kassem, Lee, Modeste, and Johnston (2003) tested the validity of applying the TPB model to SSB intake, and found that the model explained 64% of the variance in behavior to consume SSBs similar to Zoellner et al. (2012)25,26. Much of the existing research has focused on how the TPB model explains a single, specific behavior10,24,27, but little research has tested how other behaviors impact TPB framework constructs. This is especially relevant since no behavior is performed in isolation; prior experience informs present behavior. In the context of SSB consumption, this raises the question: how does SSB
consumption influence TPB constructs and consumption of other SSBs? Sugar is highly reinforcing and motivates people to eat more28–30. A possible effect of consuming one kind of SSB is that the reinforcing value of the sugar will increase an individual’s motivation to consume other sugary drinks.
control, subjective norms, and attitude toward regular soda and water consumption. We
hypothesized that the exposure of repeated SSB intake would change TPB constructs, such that affective attitude towards limiting soda consumption will increase, instrumental attitude towards limiting soda consumption will increase, subjective norms towards soda consumption will increase, perceived behavioral towards limiting soda consumption will increase, and behavioral intention towards limiting soda consumption will increase, compared to the USB group.
Additionally, this study examined the impact of weight status (measured via baseline BMI) on the effect of exposure to USB or SSB on TPB constructs. We hypothesized that those with high BMI will have a greater increase in affective attitude towards limiting soda consumption, a greater increase in instrumental attitude towards limiting soda consumption, a greater increase in subjective norms towards limiting soda consumption, a decrease in perceived behavioral control towards limiting soda consumption, and greater increase in behavioral intention toward limiting soda consumption, compared to those with a low BMI.
CHAPTER 3: METHODS
3.1 Participants
We collected data from 74 young adults participating in a randomized controlled trial to examine response to daily sugar-sweetened beverage (SSB) or unsweetened beverage (USB)
generalized anxiety disorder), and current dieting.
3.2 Design
At the baseline behavioral assessment, prior to the intervention period, participants completed a questionnaire to assess Theory of Planned Behavior (TPB) constructs (behavioral intention, perceived behavioral control, affective attitude, instrumental attitude, and subjective norms) toward consumption of regular soda or water (a selection of questions are available in Table 1). All survey responses were scaled on a seven-point Likert scale (1-7).
During the intervention, participants consumed one, 10oz bottle of SSB or USB daily, for three weeks under instruction by the intervention. Beverages were a novel flavor (either strawberry kiwi lemonade or black cherry orange) and the SSB contained as much sugar as soda
(23.7gram/10oz). These flavors were selected to ensure that participants could not access the beverages from other sources beyond what was given during the intervention period of the study. Beverages were selected through a pilot study (n=75) that confirmed the beverages to be
similarly matched on pleasantness, desirability, and the likelihood to drink32. Researchers informed participants not to alter the beverage by adding sugar or alcohol. During the
intervention period, participants came to the lab 3x/week to consume their daily beverage in the lab and return empty bottles consumed outside the lab as a check for compliance of beverage consumption.
3.3 Measures
3.3.1 TPB questionnaire
The TPB questionnaire was adapted from a validated questionnaire used in a similar study (Zoellner et al., 2017). Zoellner et al. (2017) used the questionnaire to predict SSB consumption during a TPB-based intervention, SIPsmartER, to reduce SSB consumption27. The questions were adapted such that the wording changed from “your sugary drinks” to “consumption of the listed beverage” followed by a list of beverages selected from the Beverage Intake Questionnaire (CITATON) including: water, 100% fruit juice, sweetened juice beverage/drink, 100% vegetable juice, whole milk, reduced-fat milk (2%), low fat/fat free milk, regular soft drinks, diet soft drinks/artificially sweetened drinks, sweetened tea, coffee with cream and/or sugar, tea or coffee black with/without artificial sweetener, energy drinks, alcoholic beverage, and meal replacement shakes/protein drinks33. All constructs were assessed toward limiting consumption of the
beverages listed. For the purpose of our study, we limited our analysis to change in TPB constructs toward limiting consumption of regular soft drinks and water. Regular soft drinks were chosen to represent SSBs due to regular soda being a direct comparison between the novel assigned beverage and a calorically similar beverage. “Regular soft drinks” refer to sodas such as colas and root beers. Water was selected as a comparison beverage since it is most like the USB beverage because it is not a sweetened beverage and it contains no calories.
3.4 Data Acquisition, preprocessing, and analysis
averaged to generate a summary score for behavioral intention, perceived behavioral control, subjective norms, affective attitude, and instrumental attitude towards regular soft drink or water consumption.
To assess pre- to post-intervention differences in behavioral intention, perceived behavioral control, subjective norms, affective attitude, and instrumental attitude constructs by intervention group, we used linear mixed models. The LME function from nlme (v. 3.1e137) package was used to fit linear mixed effects models with a random intercept and random slope to assess the effect of sugar of the assigned beverage and time on behavioral intention, perceived behavioral control, subjective norms, affective attitude, or subjective attitude, respectively. Body Mass Index (BMI) was added to the linear mixed model as a fixed effect to investigate the effect of BMI independent of and interaction with beverage assignment and time on behavioral
intention, perceived behavioral control, subjective norms, affective attitude, and instrumental attitude constructs. An ANOVA (via the the ‘anova’ function from the ‘stats’ package) was used to compare the relative fit of nested models after each effect (e.g. random intercept, random slope, time, beverage assignment, BMI) was added to assess the significance of the whole model34. Statistical significance was set at p<0.05. The beta (b) value refers to the standardized regression coefficient and is reported with standard error (SE).
If a model violated any assumption, the model was transformed.
To test for baseline differences in beverage assignment groups, we conducted a chi-square test for differences in gender and race/ethnicity and independent t-test for differences in BMI and age. Statistical significance was considered at p<0.05.
CHAPTER 4: RESULTS
4.1 Participants
Ninety-two participants were recruited from the University of North Carolina Chapel Hill.
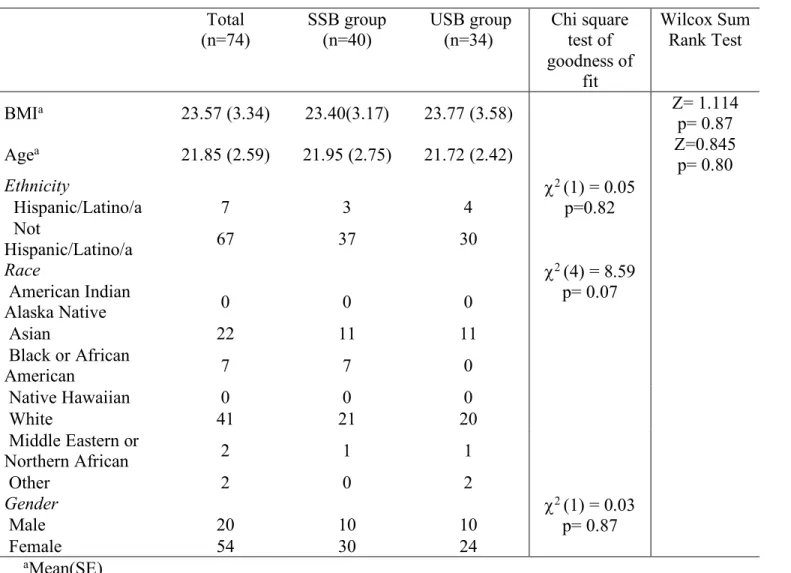
Complete data was collected from seventy-four participants. Eighteen participants were excluded due to incomplete or missing data at one timepoint. Participants ranged from 18 to 29 years old with an average age of 21.85 ± 2.59 with 20 males (27%) and 54 females (73%). We observed an average BMI of 23.57 ± 3.344 kg/m2. 57 of the participants were normal weight (18.0-24.9 kg/m2) and 17 were overweight to obese according to Centers for Disease Control and Prevention standards 35. Other demographic information is listed in Table 2.
4.2 Effect of Sweetness of Assigned Beverage, Time, and BMI on the Theory of Planned Behavior
Constructs
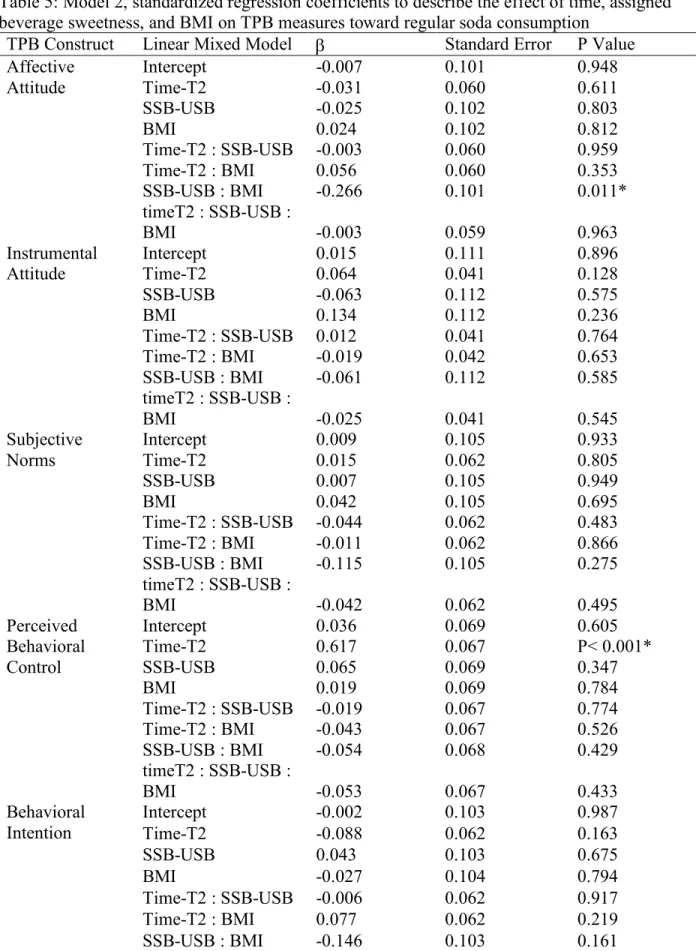
consumption (r = 0.31). In contrast, in the SSB group, BMI had a negative relationship with affective attitude toward limiting soda consumption (r= 0.16).
Instrumental Attitude: No difference was detected in the instrumental attitude toward limiting water or regular soda consumption by time, assigned beverage, or BMI. There were no significant interactions between time ang group or BMI and group.
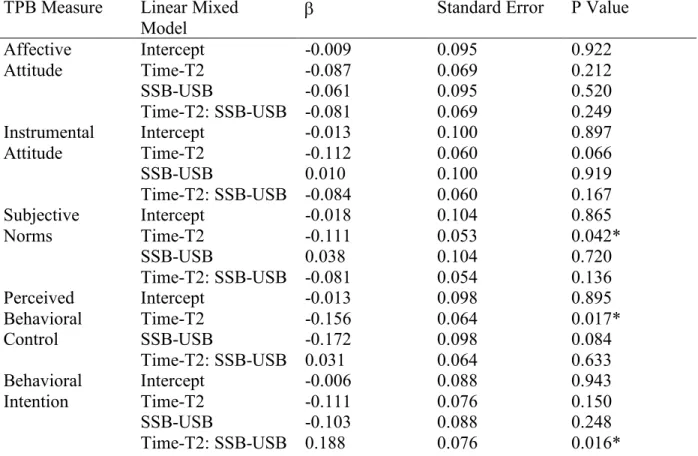
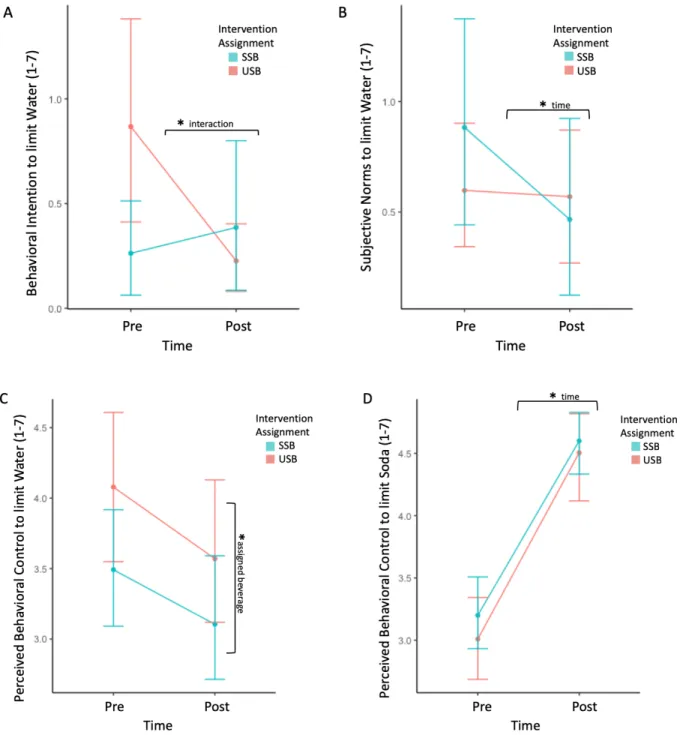
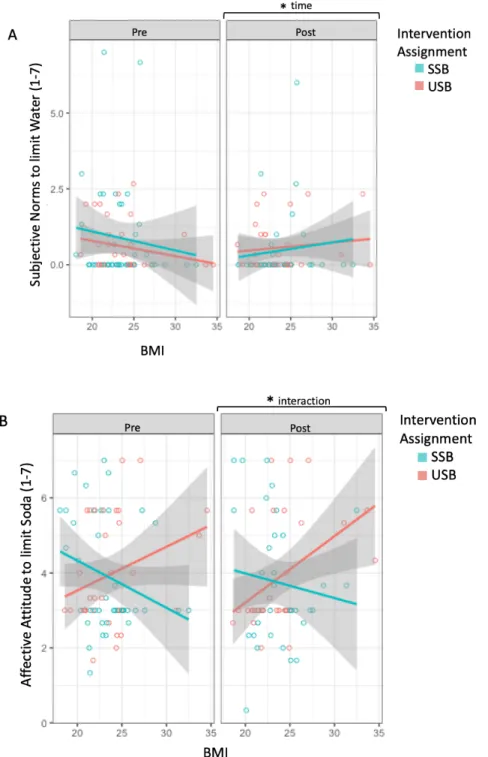
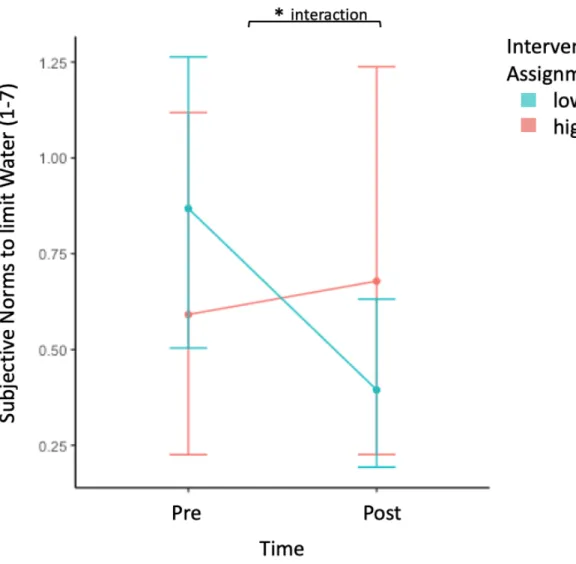
Subjective Norms: Subjective norms significantly decreased toward limiting water consumption both groups at post-intervention, in models with and without BMI (model 1: b=-0.11, SE= 0.05, p= 0.04; model 2: b=-0.12, SE= 0.05, p= 0.03) (Figure 2B, Figure 3B, and Figure 4). There was a time by BMI interaction, such that those with higher BMI showed a greater increase in subjective norms towards limiting water consumption over time (r = 0.06), regardless of beverage assignment (model 2: b= -0.14, SE= 0.05, p= 0.01) (Figure 3B). There were no other differences in subjective norms toward limiting water consumption by time, assigned beverage, and BMI. There was no difference in subjective norms toward limiting soda consumption over time or between beverage groups.
Perceived Behavioral control (PBC): Independent of time, there was a significant difference between beverage assignment groups in perceived behavioral control to limit water consumption (model 1: b=-0.16, SE= 0.06, p= 0.02; model 2: b=-0.16, SE= 0.06, p= 0.02)(Figure 2C). There was no other difference in perceived behavioral control toward limiting soda consumption by time, beverage groups, or BMI. Conversely, there was a significant effect of time on perceived behavioral control toward limiting soda consumption, where perceived behavioral control
Behavioral Intention (BI): There was a significant group by time interaction that predicted behavioral intention to limit water consumption (model 1:b= 0.19, SE= 0.08, p= 0.02; model 2:
b= 0.18, SE= 0.08, p= 0.02). The interaction was such that in the SSB group, behavioral intention to limit water consumption did not change over time, while in the USB group, there was a decrease in behavioral intention to limit water consumption over time (Figure 2A). There were no other differences in behavioral intention toward limiting water consumption by time, assigned beverage, or BMI. There was no difference in behavioral intention toward limiting soda consumption by time, beverage groups, BMI.
CHAPTER 5: DISCUSSION
This study assessed how constructs of the Theory of Planned Behavior (attitude, subjective norms, perceived behavioral control, behavioral intention) change over three weeks of repeated sweetened (SSB) or unsweetened flavored beverage (USB) consumption. We hypothesized that the exposure of repeated SSB consumption will change TPB constructs such that affective attitudes towards limiting consumption of soda increase, instrumental attitudes toward limiting consumption of soda increase, subjective norms toward limiting consumption of soda increase, perceived behavioral toward limiting consumption of soda increase, and behavioral intention toward limiting soda increase, as compared to the USB group. From our analysis, exposure to repeated beverage consumption was associated with significant changes in subjective norms (SN) and behavioral intention (BI). While other constructs showed changes over time or by group, these constructs were unique to show an interaction of group and time or BMI and time.
SN toward limiting water consumption, such that those with lower BMI had a decrease in SN towards limiting water consumption, while those with a higher BMI showed an increase in SN toward limiting water consumption across the intervention. Results suggest that some
participants in the intervention perceived less social pressure to limit water consumption; which can be interpreted as greater social pressure to consume water. This effect was found to be stronger in lower BMI participants than higher BMI. The intervention also impacted behavioral intention to limit water consumption such that those in the USB group reported a decrease in BI to limit water consumption over time, while the SSB group reported little change in BI over time. This can be interpreted as those participants who were assigned to consume a USB has a higher BI to consume water by the end of the study, while those in the SSB group saw little to no change in BI to consume water. Combining the selected results, those assigned to the USB condition were more likely to intend to consume water, supported by an increased in perceived social pressure to consume water. This effect was especially stronger for those with a lower BMI. Those in the SSB group had no statistically significant change in intention to limit water intake but did have the effect of increased social pressure to limit water intake particularly those with a high BMI. Given that BI is considered a stronger predictor of behavior20, the increased BI to consume water in the USB group may signify participants are consuming more water because the tart flavor of the USB does not satisfy their thirst, and they are motivated to drink more water. These results suggest that populations who are at risk for dehydration, like the elderly, children, or athletes, may benefit from daily consumption of USB as it would increase their behavioral intention to consume water36.
utilized to understand the individual determinants of SSB consumption, or used as a explanation of intervention response. TPB model has explained 38% to 64% of the variability in SSB
consumption, which implies that the lowering SN to limit water consumption and lower BI to limit water consumption are predictive of some the participant’s actual water consumption25,27. Since there is little information on how behavior affects TPB constructs, this study provides valuable insight into how TPB constructs can change over time due to repeated consumption of SSBs. We found that behavioral intention to limit water consumption had statistically significant difference between groups, especially in the USB group. The data suggests the participant’s consumption of USB increased intention to consume water, a similarly unsweetened beverage. Subsequently, results imply that effects of consuming a USB generalize to change in TPB constructs toward a similarly unsweet beverage. Although SSB assignment did not have a significant effect on TPB constructs towards regular soda consumption, other research suggests that SSB consumption contributes to changes in other behaviors associated with consumption, like taste preference, that are not directly measured in the TPB framework2. Overall, the study suggests that USB consumption has effects on TPB constructs related to water consumption, but daily consumption of an SSB does not produce changes in TPB that generalize to other SSBs.
Although there is no research on the generalizability of behavior with respect to TPB, there is some research on aspects adjacent to the TPB framework. For example, exposure to daily soft drink consumption for one month increased preference for sucrose, especially among
motivation. Secondly, young adults who perceive those in their social networks to prefer SSBs are more likely to consume more SSBs themselves38. The construct of perceived social
preference for SSBs is very similar to perceived norms, however, our study did not find the same effect. Again, there may be a difference between preference and actual behavior.
One limitation of our study is the comparison of the assigned USB to water for analysis. The beverage intake questionnaire options did not assess intake of an unsweetened, flavored beverage. The closest comparison to USB is black coffee with no artificial sweetener added, however, coffee is often consumed with added sugar/cream. We were concerned about measurement error and misreporting due to the likelihood for people to add sugar/cream to coffee. Instead, we chose to compare the USB to water to minimize measurement error. But, the USB has a strong tart flavor that does not directly compare to water. When a bitter beverage, like coffee, is consumed before consuming other foods, it can decrease the intensity of later flavors while water does not enhance or reduce other flavors39. If we used a beverage matched in flavor and unsweet to the assigned USB, then the results could have been more similar to SSB and regular soda.
Along with the lack of a perfectly matched comparison group to the USB beverage, the study population drew from a population within a school of public health. This population is likely to be more educated than the general population about the negative health outcomes associated with SSB consumption and may be actively counterbalancing the repeated
norms of healthier activities like consuming less SSBs and more water to begin with compared to the general population.
Another limitation is the lack of a measurement of actual beverage consumption to relate the TPB measures to the actionable behavior of consuming water or regular soda. The main study has information on food frequency, but it was not utilized due to using the TPB framework as a predictor of behavior. TPB was used as the sole behavioral measure due to the adequate strength of TPB to predict behavior25,27. This limits the application of our findings on a broader scale in understanding the effect of repeated SSB or USB on actual consumption of regular soda and water. The behaviors associated with the changes in TPB model during the exposure are restricted to hypothetical behaviors and only describe TPB model. Our findings can be described as risk factors at most to a behavior. For example, high intention to consume water predicts water consumption but there is no stipulation that it leads to participants actually drinking water.
The final limitation is the TPB model used was based on the first model proposed in 1985, since then other researchers have proposed an extension to the TPB for the inclusion of constructs such as past behavior and habit strength 40. These are commonly proposed for specific health behaviors to enhance the model’s ability to explain health behavior. A strength of the current model is how it can be broadly used in behaviors from smoking to physical activity. Azjen recognizes that past behavior does contribute to future behaviors and the possibility of it acting independently on behavioral intention 40. Since we used the original model instead of an extended model, there could be another construct such as past behavior with SSB which could change the effect from the intervention and influencing the original TPB constructs.
3-week intervention. Future research should be directed at comparing USB to a matched
beverage like tea with no additives, more representative population, utilizing an extended theory of planned behavior model, and include a beverage intake measure such as a 24-hour recall or beverage intake frequency questionnaire. This study can be applied to public health and the general population by recommending the intake of USB to increase water intake, especially in populations at risk for dehydration like the elderly or athletes3,4. Also, to educate individuals who are consuming SSB with the intention to increase water consumption since that was not found to be true. More research should be done to confirm the validity of the trends seen in this study before a full recommendation is advertised.
IRB STATEMENT
References:
1. Dhingra, R. et al. Soft Drink Consumption and Risk of Developing Cardiometabolic Risk Factors and the Metabolic Syndrome in Middle-Aged Adults in the Community.
Circulation 116, 480–488 (2007).
2. Sartor, F. et al. Taste perception and implicit attitude toward sweet related to body mass index and soft drink supplementation. Appetite 57, 237–246 (2011).
3. Casa, D. J. et al. National athletic trainers’ association position statement: fluid replacement for athletes. J. Athl. Train. 35, 212–24 (2000).
4. Lavizzo-Mourey, R. J. Dehydration in the elderly: a short review. J. Natl. Med. Assoc. 79, 1033–8 (1987).
5. Pereira, M. A. Sugar-Sweetened and Artificially-Sweetened Beverages in Relation to Obesity Risk. Adv. Nutr. 5, 797–808 (2014).
6. Ruanpeng, D., Thongprayoon, C., Cheungpasitporn, W. & Harindhanavudhi, T. Sugar and artificially sweetened beverages linked to obesity: a systematic review and meta-analysis.
QJM An Int. J. Med. 110, 513–520 (2017).
7. Hu, F. B. & Malik, V. S. Sugar-sweetened beverages and risk of obesity and type 2 diabetes: Epidemiologic evidence. Physiol. Behav. 100, 47–54 (2010).
Mortal. Wkly. Rep. 65, 169–174 (2016).
9. Ajzen, I. in Action Control 11–39 (Springer Berlin Heidelberg, 1985). doi:10.1007/978-3-642-69746-3_2
10. Riebl, S. K. et al. Beverage Choices of Adolescents and Their Parents Using the Theory of Planned Behavior: A Mixed Methods Analysis. J. Acad. Nutr. Diet. 116, 226–239.e1 (2016).
11. Flegal, K. M., Carroll, M. D., Kit, B. K. & Ogden, C. L. Prevalence of Obesity and Trends in the Distribution of Body Mass Index Among US Adults, 1999-2010. Jama-Journal Am. Med. Assoc. 307, 491–497 (2012).
12. Must, A. et al. The Disease Burden Associated With Overweight and Obesity. JAMA 282, 1523 (1999).
13. Finkelstein, E. A., Trogdon, J. G., Cohen, J. W. & Dietz, W. Annual Medical Spending Attributable To Obesity: Payer-And Service-Specific Estimates. Health Aff. 28, w822– w831 (2009).
14. French, S. A. et al. Predictors of weight change over two years among a population of working adults: the Healthy Worker Project. Int. J. Obes. Relat. Metab. Disord. 18, 145– 54 (1994).
16. Birch, L. L. Development of food preferences. Annu. Rev. Nutr. 19, 41–62 (1999).
17. Booth, D. A., Conner, M. T. & Marie, S. in 143–160 (Springer, London, 1987). doi:10.1007/978-1-4471-1429-1_10
18. Mattes, R. D. & Mela, D. J. Relationships between and among selected measures of sweet-taste preference and dietary intake. Chem. Senses 11, 523–539 (1986).
19. Zoellner, J., Estabrooks, P. A., Davy, B. M., Chen, Y. C. Y. & You, W. Exploring the Theory of Planned Behavior to Explain Sugar-sweetened Beverage Consumption. J. Nutr. Educ. Behav. 44, 172–177 (2012).
20. Ajzen, I. The theory of planned behavior. Organ. Behav. Hum. Decis. Process. 50, 179– 211 (1991).
21. Louis, W., Davies, S., Smith, J. & Terry, D. Pizza and Pop and the Student Identity: The Role of Referent Group Norms in Healthy and Unhealthy Eating. J. Soc. Psychol. 147, 57–74 (2007).
22. McDermott, M. S. et al. The theory of planned behaviour and discrete food choices: a systematic review and meta-analysis. Int. J. Behav. Nutr. Phys. Act. 12, 162 (2015).
23. Zoellner, J. et al. Qualitative Application of the Theory of Planned Behavior to
Understand Beverage Consumption Behaviors among Adults. J. Acad. Nutr. Diet. 112, 1774–1784 (2012).
Intake Among Non-Hispanic Black Preschoolers: An Elicitation Study. J. Pediatr. Nurs.
29, 47–57 (2014).
25. Kassem, N. O., Lee, J. W., Modeste, N. N. & Johnston, P. K. Understanding soft drink consumption among female adolescents using the Theory of Planned Behavior. Health Educ. Res. 18, 278–291 (2003).
26. Zoellner, J., Estabrooks, P. A., Davy, B. M., Chen, Y.-C. Y. & You, W. Exploring the theory of planned behavior to explain sugar-sweetened beverage consumption. J. Nutr. Educ. Behav. 44, 172–7 (2012).
27. Zoellner, J. M. et al. Predicting sugar-sweetened behaviours with theory of planned behaviour constructs: Outcome and process results from the SIPsmartER behavioural intervention. Psychol. Health 32, 509–529 (2017).
28. Avena, N. M., Rada, P. & Hoebel, B. G. Evidence for sugar addiction: Behavioral and neurochemical effects of intermittent, excessive sugar intake. Neurosci. Biobehav. Rev.
32, 20–39 (2008).
29. Epstein, L. H., Carr, K. A., Lin, H., Fletcher, K. D. & Roemmich, J. N. Usual energy intake mediates the relationship between food reinforcement and BMI. Obesity (Silver Spring). 20, 1815–9 (2012).
30. Temple, J. L. Factors that influence the reinforcing value of foods and beverages. Physiol. Behav. 136, 97–103 (2014).
General Hospital (2011).
32. Jones, L. Dietary Restraint and Hedonic Drivers of Sugar Sweetened Beverage Consumption. (University of North Carolina at Chapel Hill, 2018).
33. Hedrick, V. E., Comber, D. L., Estabrooks, P. A., Savla, J. & Davy, B. M. The beverage intake questionnaire: determining initial validity and reliability. J. Am. Diet. Assoc. 110, 1227–1232 (2010).
34. Team, R. D. C. R: A language and environment for statistical computing. (2008).
35. Division of Nutrition, Physical Activity, and O. of the N. C. for C. D. P. and H. P. Defining Adult Overweight and Obesity | Overweight & Obesity | CDC. Centers for Disease Control and Prevention 2017-04-11 (2017).
36. Popkin, B. M., D’Anci, K. E. & Rosenberg, I. H. Water, hydration, and health. Nutr. Rev.
68, 439–58 (2010).
37. Berridge, K. C., Robinson, T. E. & Aldridge, J. W. Dissecting components of reward: ‘liking’, ‘wanting’, and learning. Curr. Opin. Pharmacol. 9, 65–73 (2009).
38. Duh-Leong, C. & Braganza, S. Social Networks and Sugar-Sweetened Beverage Consumption in a Pediatric Urban Academic Practice. Behav. Med. 1–8 (2018). doi:10.1080/08964289.2018.1534077
(2016).
Appendix A: Tables
Table 1: TPB constructs and questions to assess each construct (Zoellner et al., 2012)
Construct Question Reference Beverages
Perceived Behavioral Control
Limiting your consumption of the listed beverages to less than 1 cup, 8oz, each day if you wanted to do so would be: Easy/Difficult
• Regular colas and root beers
• Diet regular colas and diet root beers
• Brewed coffee, tea, espresso and expresso drinks with sweetener • Brewed coffee, tea,
espresso and expresso drinks without
sweetener
• juice, flavored water, and flavored carbonated water with sweetener • juice, flavored water,
and flavored carbonated water without sweetener • water
Subjective Norms Most people who are important to you want you to drink less than 1 cup, 8oz, of the listed beverages each day: Agree/Disagree
Affective Attitude For you, drinking less than 1 cup, 8oz, of the listed beverages each day would be: Enjoyable/Unenjoyable Instrumental
Attitude
For you drinking less than 1 cup, 8 oz, of regular colas and root beers each day would be:
Healthy/Unhealthy Behavioral
Intention to consume beverage
Table 2: Demographic information of the total sample and groups by assigned beverage sweetness
Total
(n=74) SSB group (n=40) USB group (n=34) Chi square test of goodness of
fit
Wilcox Sum Rank Test
BMIa 23.57 (3.34) 23.40(3.17) 23.77 (3.58) Z= 1.114
p= 0.87
Agea 21.85 (2.59) 21.95 (2.75) 21.72 (2.42) Z=0.845
p= 0.80
Ethnicity c2 (1) = 0.05
p=0.82
Hispanic/Latino/a 7 3 4
Not
Hispanic/Latino/a 67 37 30
Race c2 (4) = 8.59
p= 0.07 American Indian
Alaska Native 0 0 0
Asian 22 11 11
Black or African
American 7 7 0
Native Hawaiian 0 0 0
White 41 21 20
Middle Eastern or
Northern African 2 1 1
Other 2 0 2
Gender c2 (1) = 0.03
p= 0.87
Male 20 10 10
Female 54 30 24
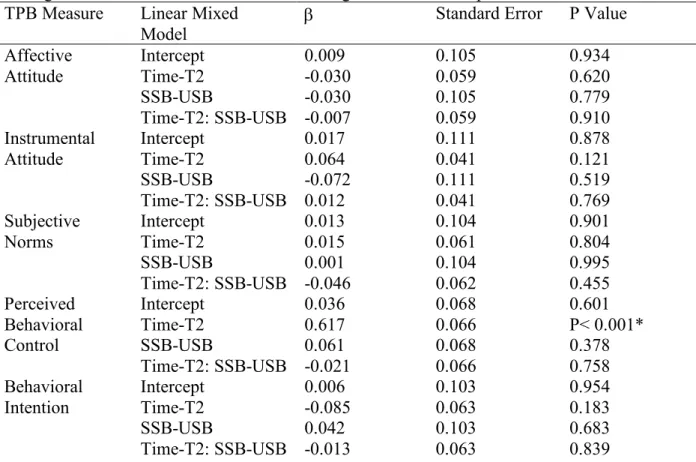
Table 3: Model 1, standardized regression coefficients to describe the effect of time and assigned beverage sweetness on TPB measures toward regular soda consumption
TPB Measure Linear Mixed
Model b
Standard Error P Value Affective
Attitude
Intercept 0.009 0.105 0.934
Time-T2 -0.030 0.059 0.620
SSB-USB -0.030 0.105 0.779
Time-T2: SSB-USB -0.007 0.059 0.910
Instrumental
Attitude Intercept Time-T2 0.017 0.064 0.111 0.041 0.878 0.121
SSB-USB -0.072 0.111 0.519
Time-T2: SSB-USB 0.012 0.041 0.769
Subjective Norms
Intercept 0.013 0.104 0.901
Time-T2 0.015 0.061 0.804
SSB-USB 0.001 0.104 0.995
Time-T2: SSB-USB -0.046 0.062 0.455
Perceived Behavioral Control
Intercept 0.036 0.068 0.601
Time-T2 0.617 0.066 P< 0.001*
SSB-USB 0.061 0.068 0.378
Time-T2: SSB-USB -0.021 0.066 0.758
Behavioral Intention
Intercept 0.006 0.103 0.954
Time-T2 -0.085 0.063 0.183
SSB-USB 0.042 0.103 0.683
Time-T2: SSB-USB -0.013 0.063 0.839
* P<0.05
Table 4: Model 1, standardized regression coefficients to describe the effect of time and assigned beverage sweetness on TPB measures toward water consumption
TPB Measure Linear Mixed
Model b
Standard Error P Value Affective
Attitude
Intercept -0.009 0.095 0.922
Time-T2 -0.087 0.069 0.212
SSB-USB -0.061 0.095 0.520
Time-T2: SSB-USB -0.081 0.069 0.249
Instrumental
Attitude Intercept Time-T2 -0.013 -0.112 0.100 0.060 0.897 0.066
SSB-USB 0.010 0.100 0.919
Time-T2: SSB-USB -0.084 0.060 0.167
Subjective Norms
Intercept -0.018 0.104 0.865
Time-T2 -0.111 0.053 0.042*
SSB-USB 0.038 0.104 0.720
Time-T2: SSB-USB -0.081 0.054 0.136
Perceived Behavioral Control
Intercept -0.013 0.098 0.895
Time-T2 -0.156 0.064 0.017*
SSB-USB -0.172 0.098 0.084
Time-T2: SSB-USB 0.031 0.064 0.633
Behavioral Intention
Intercept -0.006 0.088 0.943
Time-T2 -0.111 0.076 0.150
SSB-USB -0.103 0.088 0.248
Time-T2: SSB-USB 0.188 0.076 0.016*
Significant results are denoted as *, P<0.05
Table 5: Model 2, standardized regression coefficients to describe the effect of time, assigned beverage sweetness, and BMI on TPB measures toward regular soda consumption
TPB Construct Linear Mixed Model b Standard Error P Value Affective
Attitude
Intercept -0.007 0.101 0.948
Time-T2 -0.031 0.060 0.611
SSB-USB -0.025 0.102 0.803
BMI 0.024 0.102 0.812
Time-T2 : SSB-USB -0.003 0.060 0.959
Time-T2 : BMI 0.056 0.060 0.353
SSB-USB : BMI -0.266 0.101 0.011*
timeT2 : SSB-USB :
BMI -0.003 0.059 0.963
Instrumental
Attitude Intercept Time-T2 0.015 0.064 0.111 0.041 0.896 0.128
SSB-USB -0.063 0.112 0.575
BMI 0.134 0.112 0.236
Time-T2 : SSB-USB 0.012 0.041 0.764
Time-T2 : BMI -0.019 0.042 0.653
SSB-USB : BMI -0.061 0.112 0.585
timeT2 : SSB-USB :
BMI -0.025 0.041 0.545
Subjective Norms
Intercept 0.009 0.105 0.933
Time-T2 0.015 0.062 0.805
SSB-USB 0.007 0.105 0.949
BMI 0.042 0.105 0.695
Time-T2 : SSB-USB -0.044 0.062 0.483
Time-T2 : BMI -0.011 0.062 0.866
SSB-USB : BMI -0.115 0.105 0.275
timeT2 : SSB-USB :
BMI -0.042 0.062 0.495
Perceived Behavioral Control
Intercept 0.036 0.069 0.605
Time-T2 0.617 0.067 P< 0.001*
SSB-USB 0.065 0.069 0.347
BMI 0.019 0.069 0.784
Time-T2 : SSB-USB -0.019 0.067 0.774
Time-T2 : BMI -0.043 0.067 0.526
SSB-USB : BMI -0.054 0.068 0.429
timeT2 : SSB-USB :
BMI -0.053 0.067 0.433
Behavioral
Intention Intercept Time-T2 -0.002 -0.088 0.103 0.062 0.987 0.163
SSB-USB 0.043 0.103 0.675
BMI -0.027 0.104 0.794
Time-T2 : SSB-USB -0.006 0.062 0.917
Time-T2 : BMI 0.077 0.062 0.219
timeT2 : SSB-USB :
BMI -0.066 0.062 0.285
Significant results are denoted as *, P<0.05
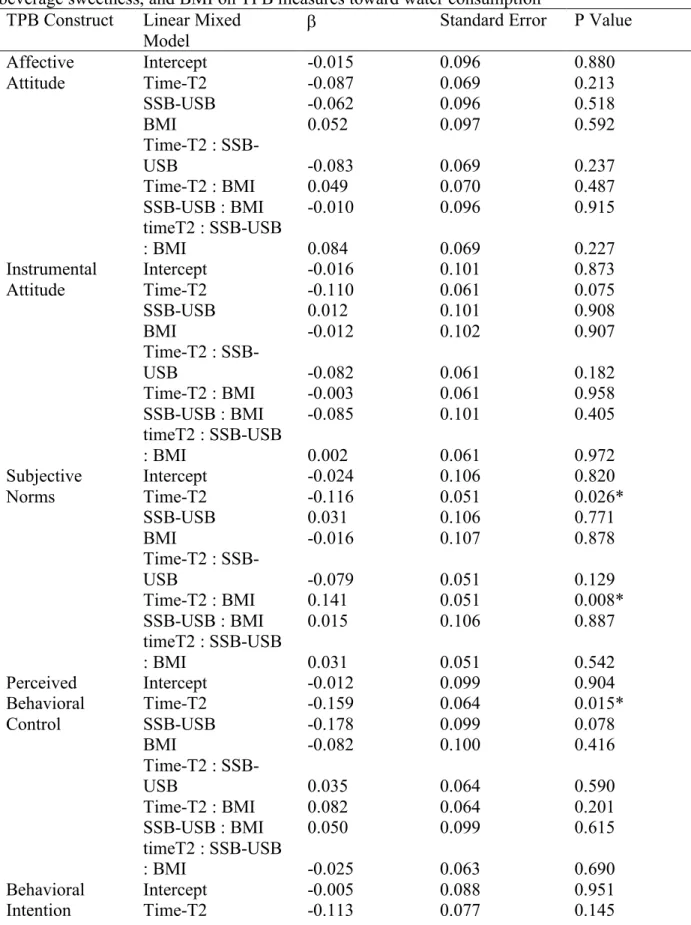
Table 6: Model 2, standardized regression coefficients to describe the effect of time, assigned beverage sweetness, and BMI on TPB measures toward water consumption
TPB Construct Linear Mixed
Model b
Standard Error P Value Affective
Attitude
Intercept -0.015 0.096 0.880
Time-T2 -0.087 0.069 0.213
SSB-USB -0.062 0.096 0.518
BMI 0.052 0.097 0.592
Time-T2 :
SSB-USB -0.083 0.069 0.237
Time-T2 : BMI 0.049 0.070 0.487
SSB-USB : BMI -0.010 0.096 0.915
timeT2 : SSB-USB
: BMI 0.084 0.069 0.227
Instrumental Attitude
Intercept -0.016 0.101 0.873
Time-T2 -0.110 0.061 0.075
SSB-USB 0.012 0.101 0.908
BMI -0.012 0.102 0.907
Time-T2 :
SSB-USB -0.082 0.061 0.182
Time-T2 : BMI -0.003 0.061 0.958
SSB-USB : BMI -0.085 0.101 0.405
timeT2 : SSB-USB
: BMI 0.002 0.061 0.972
Subjective Norms
Intercept -0.024 0.106 0.820
Time-T2 -0.116 0.051 0.026*
SSB-USB 0.031 0.106 0.771
BMI -0.016 0.107 0.878
Time-T2 :
SSB-USB -0.079 0.051 0.129
Time-T2 : BMI 0.141 0.051 0.008*
SSB-USB : BMI 0.015 0.106 0.887
timeT2 : SSB-USB
: BMI 0.031 0.051 0.542
Perceived Behavioral Control
Intercept -0.012 0.099 0.904
Time-T2 -0.159 0.064 0.015*
SSB-USB -0.178 0.099 0.078
BMI -0.082 0.100 0.416
Time-T2 :
SSB-USB 0.035 0.064 0.590
Time-T2 : BMI 0.082 0.064 0.201
SSB-USB : BMI 0.050 0.099 0.615
timeT2 : SSB-USB
: BMI -0.025 0.063 0.690
Behavioral
SSB-USB -0.096 0.088 0.279
BMI 0.145 0.088 0.105
Time-T2 :
SSB-USB 0.183 0.077 0.020*
Time-T2 : BMI -0.081 0.077 0.298
SSB-USB : BMI 0.031 0.087 0.726
timeT2 : SSB-USB
: BMI -0.029 0.076 0.704
Significant results are denoted as *, P<0.05
Appendix B: Figures
Figure 2: Graphical representation of statistically significant effects of time and assigned beverage sweetness on TPB measures
* P<0.05, Linear mixed model with random slope and random intercept by participant; time and beverage assignment as fixed effects on TPB constructs
Figure 3: Graphical representation of statistically significant effects of time, assigned beverage sweetness, and BMI on TPB measures
Significant results are denoted as *, P<0.05; Linear mixed model with random slope and random intercept by participant; time, beverage assignment, and body mass index (BMI) as fixed effects on TPB constructs
Figure 4: Graphical representation of statistically significant interaction between BMI and time on subjective norms to limit water consumption