Abstract
Kevin Y. Chen. Strategy for Chemical Exposure Assessment in
the Electric Utility Industry. (Under the Direction of Dr.
Michael R. Flynn. Sc. D.)There have been many approaches to determining
historical exposures to chemicals in exposure assessment
studies. This study used committees of industry experts to
obtain qualitative exposure estimates for workers in two
electric utility companies potentially exposed to five
chemicals of interest (benzene, creosote, herbicides,
polychlorinated biphneyls, and solvents) since the 1930s.
The selection of these five chemical was based on evidence
suggesting an association between them and leukemia and brain
cancer. Study objectives, list of most common job titles
within each occupational category, occupational job category
descriptions, and five chemical survey forms were distributed
to the each company for review and later used in the exposure
assessment process.
The results obtained show discrepancies in exposures
between the two companies to be possibly attributed to
differences between company committee members, differences in
tasks performed by persons holding the most common job titles
exposure levels. These discrepancies raise concerns
regarding the reliability of the estimates made by the
company committees. However, the committees did consistently
indicate occupational categories with potential exposure to
the chemicals (creosote, herbicides, PCBs, and solvents).
Thus, the exposure information can be used to determine if a
relationship exists between exposure to the chemicals and the
DEDICATION
I would like to dedicate this paper to the people I hold
most important in my life. To my family, whose love and
support have always inspired me throughout my educational
experiences. To my friends, old and new, who always gave me
the encouragement that I needed during those times of
ACKNOWLEDGEMENTS
I would like to express my appreciation to Dr. Michael
Flynn for his guidance, support, and patience throughout my
study at the Department of Environmental Science and
Engineering. I am also grateful to Dr. David Savitz and Dr.
Lori Todd for their support throughout this study and during
the preparation of this report.
I would like to thank Gary Mihlan and Steve Browning for
their guidance, support, and postive criticism throughout
this study and during the preparation of this report.
Thanks to those on the EPRI project staff, Lucy, Bob,
Billy, and Dick, whose help were vital throughout this study.
Thanks to those two utility companies for their
participation in this study.
The Electric Power Research Institute partially
supported this study.
TABLE OF CONTENTS
Pages
List of Tables...vii
List of Figures...viii
Chapters I. Introduction
A. Objectives...1
B . Brief Description of Strategy...1
II. Background/Literature Review
A. Occupational Epidemiology...3
B . Role of Industrial Hygienist...4
C . Retrospective Exposure Assessment...5
D . Selection of Chemicals...7
III. Materials and Methods
A. Description of Companies...11
B . Development of Strategy...12
C . Chemical Assessment Packet...13
D . Selection of Committee Members...16
E . Exposure Estimation...17
IV. Results A. Benzene...19
B . Herbicides...19
C . Creosote...24
D . Polychlorinated Biphenyls...24
E. Solvents...28
V. Discussion...43
VI. Conclusion...4 9
VII. Bibliography...52
VIII. Appendix - Chemical Assessment Packet...57
LIST OF TABLES
Pages
Table 3.1 - List of Occupational Categories...14
Table 4.1 - Herbicide Exposure for Company A
throughout Entire Study Period...21
Table 4.2 - Herbicide Exposure for Company B
throughout Entire Study Period...22
Table 4.3 - Creosote Exposure for Company A
throughout Entire Study Period...2 5
Table 4.4 - Creosote Exposure for Company B
throughout Entire Study Period...2 7
Table 4.5 - PCB Exposure for Company A
throughout Entire Study Period...2 9
Table 4.6- PCB Exposure for Company B
throughout Entire Study Period...31
Table 4.7 - Solvent Exposure for Company A
throughout Entire Study Period...33 Table 4.8 - Solvent Exposure for Company B
throughout Entire Study Period...35
Table 4.9 - Summary of Company A's Person Years
for Entire Study Period...37 Table 4.10 - Company A's Percent of Person Years
Exposure for Each Chemical...37 Table 4.11 - Summary of Company B's Person Years
for Entire Study Period...40 Table 4.12 - Company B's Percent of Person Years
LIST OF FIGURES
Pages
Figure 4.1 - Herbicide Exposure for Company A
throughout Entire Study Period...21 Figure 4.2 - Herbicide Exposure for Company B
during the 1930s to 1960s...22
Figure 4.3 - Herbicide Exposure for Company B
during the 1970s...23 Figure 4.4 - Herbicide Exposure for Company B
during the 1980s...23
Figure 4.5 - Creosote Exposure for Company A
during the 1930s to 1960s...26
Figure 4.6- Creosote Exposure for Company A
during the 1970s and 1980s...26
Figure 4.7 - Creosote Exposure for Company B
throughout Entire Study Period...27
Figure 4.8 - PCB Exposure for Company A
during the 1930s to 1960s...30
Figure 4.9 - PCB Exposure for Company A
during the 1970s...30
Figure 4.10 - PCB Exposure for Company B
during the 1950s to 1980s...31
Figure 4,11 - Solvent Exposure for Company A
during the 1930s to 1960s...34 Figure 4.12 - Solvent Exposure for Company A
during the 1970s and 1980s...34
Figure 4.13 - Solvent Exposure for Company B
throughout Entire Study Period...35
Figure 4.14 - Herbicide Exposure for Company A
by % of Per-Yrs for Each Decade
of the Study Period...38
Figure 4.15 - Creosote Exposure for Company A
by % of Per-Yrs for Each Decade
of the Study Period...38
Figure 4.16 - PCB Exposure for Company A
by % of Per-Yrs for Each Decade
of the Study Period...39
Figure 4.17 - Solvent Exposure for Company A
by % of Per-Yrs for Each Decade
of the Study Period...39
Figure 4.18 - Herbicide Exposure for Company B
by % of Per-Yrs for Each Decade
of the Study Period...41 Figure 4.19 - Creosote Exposure for Company B
by % of Per-Yrs for Each Decade
of the Study Period...41
Figure 4.20 - PCB Exposure for Company A
by % of Per-Yrs for Each Decade
of the Study Period...42
Figure 4.21 - Solvent Exposure for Company A
by % of Per-Yrs for Each Decade
Chapter I - Introduction
Several approaches have been used in exposure assessment
technology. These are qualitative, ~ semiquantitative, '
8 — 10
and quantitative methods. All these methods require the
classification of job titles into occupational categories
which serve as the organizing framework for the assignment of
exposures. These approaches have varying degrees of accuracy
and feasibility depending on the limitations of the study.
Most often the limitations are a result of the availability
of information used to estimate exposure or lack there of.
The types of information that are usually available include
work histories, job titles and descriptions, standard
operating procedures, process flow charts, purchasing
records, plant layouts, and others. Only recently has there
been direct exposure information such as biological and air
monitoring data, but the applicability of this information is
limited depending on the study.
This study used committees of industry experts to make
qualitative exposure estimates for workers in two electric
utility companies potentially exposed to five chemicals
(benzene, creosote, herbicides, polychlorinated biphneyls,
and solvents) since the 1930s. An exposure assessment packet
which includes an explanation of study objectives, a listing
category, occupational job category descriptions, and five
chemical survey forms used by the committees in their
assignment of exposures. The selection of the specific
chemicals is based upon evidence suggesting an association
between the chemicals and leukemia and brain cancer.
This study is directly related to the current interest
11-17
in electric and magnetic field exposure. The exposure of
electric utility workers to chemical agents must be performed
to properly assess the health effects related to electric and
magnetic field exposure. The exposure information is to be
combined with electric and magnetic field exposure
information to establish if chemicals confound the effects of
Chapter II - Background
Ocrnpational Epidemiology
Exposure assessment is used to determine a population's
exposure pattern to a potential hazard. The use of exposure
assessment in occupational epidemiology can provide the
information for the epidemiologist to describe the pattern of
disease occurrence among workers and to identify causative
18
factors in the work environment. Exposure assessment
techniques must provide accurate accounts of exposure to
identify toxic or carcinogenic agents in occupational
epidemiologic studies.
While there are several types of epidemiologic studies,
the occupational cohort study has played a primary role in
investigating worker health concerns. Cohort studies are
classified into two types depending upon the temporal
relationship between the initiation of the study and the
19-21
occurrence of the exposure and the disease of interest. The study types are prospective and historical
(retrospective). The common elements to each of these cohort
studies are the identification of a study population (cohort)
exposed to the agents of interest, the identification of a
comparison population, follow-up of the cohort over time of
study, and comparison of disease rates between the cohort and
In a prospective cohort study, the population's exposure
classification is made prior to the occurrence of disease.
The study population is followed through time from the onset
of exposure until the occurrence of disease. Cost and the
amount of time required to conduct a prospective study of a
disease with long latency (cancer) make them uncommon in
occupational epidemiology.
In a historical cohort study, the population's exposure
classification is made after exposure and disease have
occurred. The mortality or morbidity information is compared
between the exposed population and a reference population.
Historical cohort studies are usually the preferred choice
based upon cost and logistic considerations. The low cost
makes them more common because all relevant events have
already occurred at the time the study is initiated. More
importantly, historical studies compared to prospective
studies are particularly efficient for diseases with long
latency periods requiring many years for the development of
disease. The difficulty of historical cohort studies results
from trying to evaluate exposures that have occurred many
years previously. The exposure information is often
inadequate and can result in exposure misclassification.
Role of the Industrial Hygienist
Historical exposure assessment studies for chronic
diseases such as cancer are difficult because historical
few job titles. This limitation makes the evaluation of past
exposures a difficult task for the industrial hygienists.
Industrial hygienists assume a vital role in exposure
assessmentͣstudies because of their familiarity and
understanding of plant processes, materials used, toxic
properties of materials and reaction products, and
18
engineering control measures. Measurement of exposure has
been more frequent, but still uncommon, especially for the
time periods concerning chronic diseases such as cancer. In
the absence of monitoring data, consultation with industrial
hygienists is important. Several studies have obtained
accurate exposure estimates upon collaboration with
O O C fT p 1 A
industrial hygienists. ' ' ' ' ' In a study by Kromhout,
industrial hygienists made the best qualitative exposure
estimates when compared with the actual measurements of the
2
same exposure.
Retrospective Exposure Assessment
Retrospective exposure assessment studies are difficult
because of the typical absence of current and/or historical
data. The techniques that have been used are qualitative and
semiquantitative techniques. Several types of these
techniques have been used by researchers. A comparison
between two earlier semiquantitative methods; the Job
Exposure Matrix (JEM) and the Interview Based Evaluation
(IBE); with three alternative methods; the Exposure Source
Parallel Agent Evaluation (PAE); was made to determine which
7
type was most effective. Of all the methods, no one method
/ is best for conducting exposure assessment studies. The
selection of the appropriate method depends upon the study
limitations, the availability of industrial hygiene
7
information, and the preference of the investigator.
Many retrospective exposure assessment studies have used
similar approaches to reconstruct historical exposures
including the classification of job titles either by
22 23occupation and industry, by exposure zone, by job
5 22 8 24task, ' or by a combination of them. ' The organization
of job titles allows for greater manageability since the
abstraction of job titles from company records can result in
a large number of past and present job titles. Most often
these job titles are classified into occupational
22 24
categories/titles. ' These occupational categories serve
as the primary organizing structure for the assignment of
exposures. The job titles classified within the occupational
categories allow individual workers to be linked to exposure
estimates by their occupational histories through a job
24 25
exposure matrix. As described by Hoar, occupations are
classified by industry and then task within the industry.
Lists of suspect carcinogens are linked to the industries and
tasks in which they have been used. The links make it
category. Epidemiologic analysis is then based on chemical
and physical exposure instead of industry and task.
Selection of Chemicals
The chemicals of primary interest in the electric
utility industry are those that are thought to possibly cause
leukemia and brain cancer. The selection of the five
specific chemicals; benzene, creosote, herbicides,
polychlorinated biphenyls, and solvents; is based upon
evidence suggesting an association between these chemicals
and leukemia and brain cancer.Benzene use in the past was primarily as a solvent,
especially for rubber, as a diluent in lacquers, and paint
2 6
removers. Currently benzene use is minimal, and is present
in the chemical industry as a raw material for various
organic chemicals. It is also found in trace amounts in
-, . 27,28
gasoline.
Several studies on benzene have been conducted in the
rubber industry because of its use as a solvent in tire
manufacturing in the 1920s and 1930s. Toluene, hexane,
naphthas, and other compounds have replaced benzene, however,
there are still detectable air concentrations of benzene
attributable to its presence as an impurity in other
29
solvents. The study of the tire manufacturers by Van Ert in
1980 reports a mean benzene concentration of 1.11 ppm for
9
Several other studies of the rubber industry suggest a
causal relationship between benzene exposure and leukemia. A
case control study by Arp in 1983 reports a odds ratio of 4.5
29
for exposure to benzene. Two other studies, one by
McMichael in 1975 and the other by Wolf in 1981, report odds
30 31
ratios of 3.3 and 3.2 respectively. '
Creosote is most extensively used in this country for
the preservation of utility poles. Creosote is obtained from
the distillation of tars of which the commercially important
ones for wood preservative purposes are coal tars, oil tars,
32
and wood tars. The constituents of creosote are primarily polycyclic aromatic hydrocarbons which are known to be
2 6
carcinogenic. The main polycyclic aromatic hydrocarbons of
interest are benzo(a)pyrene, pyrene, phenanthrene, and anthracene. Exposure to creosote involves contact with
creosote treated poles and possibly railroad ties used in
supporting transformers and capacitors in substations.
Herbicides, specifically phenoxyacetic acid, have been
used for weed control in agriculture and forestry since the
33
1940s. Phenoxy herbicides act similar to naturally
occurring auxins, which in high concentrations lead to a
33
disturbed and abnormal growth causing death to the plant.
The use of herbicides in the electric utility industry is for
weed control in right of way construction and in areas around
substations, utility poles and towers.
A case control study by Hoar of agricultural herbicide
34
of 6.0) in men exposed to them more than 20 days per year.
Another study in western Washington State by Woods, which
looked at specific occupations and activities with potential
exposure to phenoxy herbicides and chlorophenol, found
significant increased risk of developing leukemia in some
occupational activities where phenoxy herbicides were used
with other chemicals particularly for prolonged periods of
35 . , ,
time. One occupation of interest in the low exposure
category, landscapers, is reported to have a nearly
significant odds ratio of 1.7 for leukemia. Two other
studies on farming and workers manufacturing phenoxy
herbicides show a significant elevated risk of leukemia with
33 3 6 phenoxy herbicide exposure. '
Polychlorinated biphenyls (PCBs) have been used by
electric utilities in capacitors, transformers, and other
electrical equipment as a fire-resistant dielectric and
cooling fluid. The systems are totally enclosed with
exposure usually occurring during equipment maintenance and
clean up of spills from damaged equipment. For example,
routine maintenance of transformers include (1) sampling and
testing transformer fluids for dielectric properties, (2)
adding oil to transformers when the level of oil is low
within the transformer itself, (3) cleanup of any spills or
leaks in the transformer vaults using absorbent material and
sometimes a solvent such as 1,1,1-trichloroethane, (4) repair
of transformers, a process which might require drainage of
unit, and (5) filtering of the transformer oil to upgrade its
37
dielectric properties.
The performance of these tasks is accomplished by
several workers: substation mechanics, substation electricians, transformer repairmen, and troublemen.
Currently the sampling and testing of transformer fluids
includes determining the concentration of PCB contamination.
The limit for PCB contamination is 50 ppm. EPA in 1979 put a
38
ban on the manufacture and use of PCBs in commerce. This is
a result of two major incidents of ingestion of PCB contaminated rice oil used for cooking in Japan and
39 40
Taiwan. ' The results of other studies on PCB exposure of
workers involved with the manufacture and repair of
capacitors and transformers show possible casual relationship
41-44
between PCB exposure and leukemia.
The studies suggesting a causal relationship between solvent exposure and leukemia also involved the rubber
workers. Solvents like toluene, hexane, naphthas, and others
have replaced benzene so these studies also examined exposure
to these solvents. These studies reported a similar risk to
29-31
that of benzene. A study by Checkoway reported a strong
association of leukemia with exposure to carbon disulfide and
carbon tetrachloride, two solvents not normally associated
Chapter III - Materials and Methods
The chemical exposure assessment study was done in
conjunction with the electric and magnetic fields exposure
study being conducted by Dr. David Savitz of the Department
of Epidemiology at the University of North Carolina at Chapel
Hill. There were a total of five participating utility
companies of which only two were involved in this study.
Company A served a population of 3.5 million covering a
30,000 square mile territory. The company operated a mix of
fossil, nuclear and hydroelectric facilities with a total
generating capacity of 9, 654 megawatts.
Company B served a population of 3.9 million including
1.6 million which live in a metropolitan area. The total
area served covers 2,475 square miles. Approximately 5
percent of the service area and 37 percent of sales were to
the metropolitan area, and 95 percent of the electric service
area and 63 percent of kilowatthour sales were in the
suburbs.
The strategy created for the chemical exposure
assessment study utilized a committee of experts from each of
the two participating companies to assign potential exposure
levels to job titles/occupational categories for the five
chemicals of interest. The strategy included (1)
determine the feasibility of the approach, (2) preparation of
a chemical assessment packet summarizing the chemicals and
the job titles/occupational categories of interest, (3)
selection of company expert for the committee, (4) review of
chemical assessment packet by company experts, (5) assignment
of potential exposure levels for each decade of the study for
each occupational category by company experts, and (6)
summarization of the results by company.
Development of Exposure Assessment Strategy
There were several limitations that needed to be
addressed in the development of the exposure assessment
strategy. The historical nature of the study and the scale
of the study were of concern because the results may lack the
desired sensitivity. Measurements of exposures were not
available for the chemicals of interest. The study was also
limited by constraints in time and funding. The companies
were also unable to give full support to the study without
compromising their participation in the electric and magnetic
exposure study. However, the strategy still needed to be
consistent and gather reliable exposure information.
With collaboration from researchers experienced in the
area of exposure assessment and industry professionals, the
strategy that was developed used a committee of experts from
each participating company to assign potential exposure
its advantages and disadvantages but satisfied the study limitations and availability of exposure data.
Chemical Assessment Packet
A chemical assessment packet was developed for both the participating companies. The packet included (1) a letter
describing the objectives of the study, (2) an occupational
category manual giving a brief description of each
occupational category, (3) a company job history summary indicating the most common job titles in each occupational category, and (4) five job exposure surveys describing each chemical and the potential exposure levels that could be
assigned for each decade of the study period. A copy of the
chemical assessment packet is contained in the appendix.
An introductory letter was attached to the packet explaining the objectives of the chemical assessment study.
The letter also contained a description of the criteria for
selection of committee members, the three exposure levels, and the supplementary information (occupational category
manual and company job history summary). It was necessary
that each company understand the importance of the study and the background information contained in the chemical
assessment packet prior to the meeting of the company
experts.
The job titles from each company were classified into 2 8
occupational categories. The job titles were gathered from
company records covering the period of study. Each
Table 3.1 - List of Occupational Categories
1 - Senior Managers and Executives
2 - Engineers, Professionals, and Specialist
3 - Technical Workers
4 - Field / Craft / Trade Supervisors
5 - Administrative Supervisors
6 - Administrative Support / Clerical Workers
7 - Sales, Marketing and Business Workers
8 - Services 9 - Mechanics 11 - Machinists
12 - Boilermakers / Steamfitters
13 - Electricians 14 - Linemen
15 - Instrument and Control Technicians
16 - Relay Technicians
17 - Telecommunication Technicians
18 - Cable Splicers
19 - Power Plant Operators 20 - Substation Operators 21 - Riggers
22 - Auto and Truck Mechanics
23 - Painters
24 - Pipe Coverers
25 - Welders
26 - Heavy Vehicle Operators
27 - Material Handlers
28 - Laborers
29 - Other Craft / Trades Workers
participating utility company had thousands of job titles
over the entire study period. The organization of these job
titles into occupational categories allowed for greater manageability because the abstraction of job titles from
company records resulted in large number of past and present
job titles. The occupational categories (Table 3.1) were
developed to reflect work activities, work environment, and
occupational status and served as the primary organizing
framework for the assignment of chemical exposures. The
those being used for the electric and magnetic field exposure
study. The classification of job titles was conducted by the
project research staff.
A description of each occupational category was attached to the chemical assessment packet to assist the company
committees in their assignment of potential exposure levels.
This allowed the committee members to understand the criteria
used in classifying job titles. For example, the job title
"foremen" can be classified in category 4, field/craft/trade
supervisors, but specialized foremen like "mechanics foremen" were classified in category 9, mechanics. This was done
because those specialized foremen were working foremen who
were likely to have exposures similar to those workers under
his supervision.
A company job history summary was enclosed in the packet
to further aid the company committee members in assigning
potential exposure levels. The summary listed the most common job titles based on person-years (the number of
workers multiplied by the average number of years in that job
title). The total person-years for the job titles listed and the occupational category were also given for comparison.
This was used to give the committee an idea of the percentage
of person-years comprised by the most common job titles. The committee was also given a job exposure survey for each of the five chemicals. The survey contained a brief description of the chemical and the possible routes of exposure (ingestion, inhalation, or dermal contact). A
description of each exposure level was also included: (3)
routine exposure (the agent of interest was regularly used by
workers in the job titles within each occupational category
or is regularly present in their workplace), (2)
incidental/occasional exposure (the workers in the job titles
within each occupational category were intermittently exposed
to the agent of interest or it may have been present
sometimes in their workplace), and (1) low or no exposure
(the workers in the job titles within each occupational
category were very rarely or not exposed to the agent of
interest). The exposure levels were included on the survey
form to provide further emphasis and to ensure the committee
understood the three exposure levels.
Selection of Committee Members
It was important that each member of the committee meet
certain criteria of knowledge of the industry and years of
service with the company. The members were considered
"expert" in their field for the purpose of the study.
Certain types of employees were sought as members of the
committee.
The first was the company industrial hygienist.
Industrial hygienists are concerned with recognition,
evaluation, and control of hazards in the work environment.
other employees that were sought included company or
plant safety coordinators, supervisors and managers, and
retired workers. Individuals who have worked with the
company for a number of years were considered invaluable
members of the expert committee. Their overall knowledge of
the company, various jobs and tasks, chemicals used,
equipments used, and historical changes were considered
useful in the assignment of exposure levels.
Exposure Estimation
A company contact person was asked to select and convene
the committee members. Prior to the meeting, the chemical
assessment packet was distributed to the committee member.
Thus, the member had an opportunity to review the information
contained in the packet. Representatives from the University
of North Carolina at Chapel Hill, who were involved with the
study, were in attendance to conduct the meeting and answer
any questions from the committee members.
The company committee was asked to assign exposure
levels of routine, incidental/occasional, or low/none to the
twenty-eight occupational categories for each decade of the
study. In their assignment of exposure, the committee
members were reminded to consider several of the following
factors:
i. Employee work practices - past work practices may
have resulted in high exposure levels but advances in the
recognition of hazards in the work environment may have
changed work practices and current worker exposure levels.
ii. Use of personal protective equipment - respirators,
gloves.
iii. Control technology - local exhaust ventilation
vi. Environmental regulations - similar to work
practices, advances in hazard recognition may have prompted
changes or new legislation to protect the worker by reducing
their exposures.
V. Company policy - the policy of individual companies toward safety may vary from one to the other. Use of some
materials may be prohibited or severely restricted due to
company policy.
The committee was also asked to concentrate on those job
titles that had the greatest number of person-years when
making their assignments of exposures. This ensured that
exposure assignments made for each occupational category were
based on the job titles which comprised the majority of the
person-years within an occupational category. Any conflicts
regarding the assignment of exposure levels were discussed
until a final consensus was reached.
The exposure information obtained from the two companies
will be reviewed to assess homogeneity and differences
between the two companies. The strategy of using experts
panels to assign exposures will be evaluated for its
•
Chapter IV - Results
The exposure data was gathered from two committees, one from each of the participating companies. The committee from company A was comprised of five members, two industrial
hygienists and three retired supervisors, with an average of twenty-seven years of experience with the company. Company B
had a committee of thirteen members; three linemen, three
engineers, two industrial hygienists, two lab technicians, two cable splicers, and a chemist; with an average of
twenty-one years of experience with the company.
Benzene
Both company committees indicated no exposure to benzene for the entire study period. They were less confident of the earlier decades, but felt if there were any benzene exposure,
it was isolated to workers in the laboratories and meter and
repair shops.
Herbicides
The company committees had varying opinions about exposure to herbicides. The members from company A had indicated herbicide exposure to be seasonal throughout the
summer. The occupational categories exposed to herbicides during this period were 9-mechanics, specifically substation
mechanics, 13-electricians specifically substation
electricians, 21-riggers, and 28-laborers, specifically those
working around the substation (Table 4.1 and Figure 4.1).
The types of herbicide used were mostly phenoxyacetic acids,
amides, uracils, and others. Since the 1970s, the
application of herbicides for right of way construction has been contracted to other companies and not done by company A
employees but the application of herbicides around
substations was done by company employees.
The occupational categories exposed to herbicides for
company B were 8-services, 9-mechanics, 14-linemen, and 28-laborers . The committee members from company B indicated
that exposure to herbicides was not seasonal but was
occasional (exposure level two) for the entire study period except for category 9-mechanics who had routine exposure
(level three) from the 1930s to 1960s and category 14-linemen which had routine exposure in the 1970s (Table 4.2 and Figure
4.2 - 4.4). These two categories exposure changed during
those periods because the committee indicated that workers in
those occupational categories directly applied herbicides for
the right of way construction and for weed control around
substations. The herbicides used were similar to those used
Table 4.1 - Herbicide Exposure for Company A throughout Entire Study Period* Decade 00^ 1 2 3 4 5 6 7 8 9 11 12 13 14 15 16 17 19 20 21 22 23 25 26 27 28 29 1930's Exposure***
1940's 1950's 1960's 1970's 1980's
Exposure*** Exposure*** Exposure*** Exposure*** Exposure^
1 1 1 1 1 1 1 1 2 1 1 2 1 1 1 1 1 1 2 1 1 1 1 1 2 1 1 1 1 1 1 1 1 1 2 1 1 2 1 1 1 1 1 1 2 1 1 1 1 1 2 1 1 1 1 1 1 1 1 1 2 1 1 2 1 1 1 1 1 1 2 1 1 1 1 1 2 1 1 1 1 1 1 1 1 1 2 1 1 2 1 1 1 1 1 1 2 1 1 1 1 1 2 1 1 1 1 1 1 1 1 1 2 1 1 2 1 1 1 1 1 1 2 1 1 1 1 1 2 1 1 1 1 1 1 1 1 1 2 1 1 2 1 1 1 1 1 1 2 1 1 1 1 1 2 1
* Exposure is only during the spring and summer months. ** Occupational Category Number
*** Exposure Levels 3 - Routine, 2 -Occasional, and 1 - Low/None
Figure 4.1 - Herbicide Exposure for Company A throughout
Entire Study Period
Table 4.2 - Herbicide Exposure for Company B throughout Entire Study Decade
OC* Exp 1930*3 losure** Exp 1940's iQSure** Decade 1950'3 Exposure** Period 1960's Exposure** 1970'3 1980's
Exposure** Exposure**
1 2 3 4 5 6 7 8 9 11 12 13 14 15 16 18 19 20 21 22 23 24 25 26 27 28 29 1 1 1 1 1 1 1 2 3 1 1 1 2 1 1 1 1 1 1 1 1 1 1 1 1 2 2 1 1 1 1 1 1 1 2 3 1 1 1 2 1 1 1 1 1 1 1 1 1 1 1 1 2 2 1 1 1 1 1 1 1 2 3 1 1 1 2 1 1 1 1 1 1 1 1 1 1 1 1 2 2 1 1 1 1 1 1 1 2 3 1 1 1 2 1 1 1 1 1 1 1 1 1 1 1 1 2 2 1 1 1 1 1 1 1 2 2 1 1 1 3 1 1 1 1 1 1 1 1 1 1 1 1 2 2 1 1 1 1 1 1 1 2 2 1 1 1 2 1 1 1 1 1 1 1 1 1 1 1 1 2 2
* Occupational Category Number
** Exposure Levels 3 - Routine, 2 -Occasional, and 1 - Low/None
Figure 4.2 - Herbicide Exposure for Company B during the 1930s
Figure 4.3 - Herbicide Exposure for Company B during the 1970s
Occupational
Category
7:
25:
23:
21:
19 .
16:
14 . 12:
9
7 1
5
3
1
Exposure Level
Figure 4.4 - Herbicide Exposure for Company B during the 1980s
Occupational Category
29: 27: 25:
23: 21: 19: 16:
14:
12:
1.
5:
3:
1:
Exposure Level
Creosote
Company A committee members indicated that five
occupational categories were exposed to creosote. Only one
category, 14-linemen, had constant exposure of routine (level
three) for the entire study period. The other four
categories; 9-mechanics, 13-electricians, 21-riggers, and
28-laborers had similar exposure, but it was variable throughout
the entire study period. The assigned exposures were routine
(level three) from the 1930s to 1960s and occasional (level
two) from the 1970s to 1980s (Table 4.3 and Figure 4.5 and 4.6). This change was a result of the use of alternative types of wood preservatives on utility poles.
As for company B, the committee members indicated four
occupational categories were exposed to creosote during the
study period. Two categories, 14-linemen and 28-laborers,
had routine exposure (level three) for the entire study
period. The other two, 9-mechanics and 18-cable splicers,
had occasional exposure (level two) for the entire study
period (Table 4.4 and Figure 4.7).
Polvchlorinated Biphenyls (PCBs)
Exposure to PCBs for company A was similar for all the
specified occupational categories. There were five
categories exposed to PCBs; 9-mechanics, 13-electricians, 14-linemen, 21-riggers, and 28-laborers. These categories were
the same as those for creosote exposure. The exposures to
Table 4.3 - Creosote Exposure for Company A throughout Entire Study Period
Decade
1930's 1940's 1950's 1960's 1970's 1980's
OC* Exposure** Exposure** Exposure** Exposure** Exposure** Exposure**
11 1 1 1 1 1
2 1 1 1 1 1 1
3 1 1 1 1 1 1
4 1' 11 1 1 1
5 1 1 1 1 1 1
6 1 1 1 1 1 1
7 1 1 1 1 1 1
8 1 1 1 1 1 1
9 3 3 3 3 2 2
11 1 1 1 1 1 1
12 1 1 1 1 1 1
13 3 3 3 3 2 2 14 3 3 3 3 3 3
15 1 1 1 1 1 1
16 1 1 1 1 1 1
17 1 1 1 1 1 1
19 1 1 1 1 1 1 20 1 1 1 1 1 1 21 3 3 3 3.2 2 22 1 1 1 1 1 1 23 1 1 1 1 1 1 25 1 1 1 1 1 1 26 1 1 1 1 1 1 27 1 1 1 1 1 1 28 3 3 3 3 2 2
29________1___________1___________1___________1___________1___________3^
* Occupational Category Number
** Exposure Levels 3 - Routine, 2 -Occasional, and 1 - Low/None
Figure 4.5 - Creosote Exposure for Company A during the 1930s
to 19603
Occupational
Category
ͣ
28;
26:
23 : 21: 19:
16;
14: 12: 9: 7:
5:
3:
1.
Exposure Level
Figure 4.6 - Creosote Exposure for Company A during the 1970s
and 1980s
Occupational
Category
28:
26:
23:
21:
19:
16:
14:
12
9: 7:
5
3 3
1
Table 4.4 - Creosote Exposure for Company B throughout Entire Study Period Decade 1950's PC* 1 2 3 4 5 6 7 8 9 11 12 13 14 15 16 18 19 20 21 22 23 24 25 26 27 28 29
1930's 1940's
Exposure** Exposure**
1 1
1960'3 1970's
Exposure** Exposure** Exposure
1980'3 1 1 1 1 1 1 1 2 1 1 1 3 1 1 2 1 1 1 1 1 1 1 1 1 3 1 1 1 1 1 1 1 1 2 1 1 1 3 1 1 2 1 1 1 1 1 1 1 1 1 3 1 1 1 1 1 1 1 1 2 1 1 1 3 1 1 2 1 1 1 1 1 1 1 1 1 3 1 1 1 1 1 1 1 1 1 2 1 1 1 3 1 1 2 1 1 1 1 1 1 1 1 1 3 1 1 1 1 1 1 1 1 1 2 1 1 1 3 1 1 2 1 1 1 1 1 1 1 1 1 3 Exposure** 1 1 1 1 1 1 1 1 2 1 1 1 3 1 1 2 1 1 1 1 1 1 1 1 1 3
* Occupational Category Number
** Exposure Levels 3 - Routine, 2 -Occasional, and 1 - Low/None
Figure 4.7 - Creosote Exposure for Company B throughout Entire Study Period
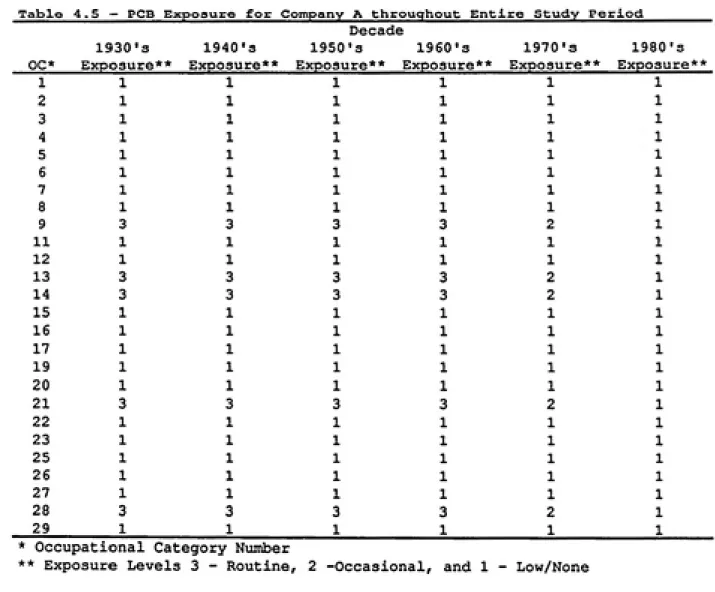
The exposure from the 1930s to 1960s was routine (level
three). The exposure to PCBs in the 1970s and 1980s changed
to occasional (level two) and low/none (level one)
respectively (Table 4.5 and Figure 4.8 and 4.9). This was a
result of health concerns indicated by early studies showing 39 40
possible health risk resulting from PCB exposure. ' Thus,
there was change in use of PCB as an dielectric fluid.
Company B committee members indicated six occupational
categories were exposed to PCBs; 9-mechanics,
13-electricians, 14-linemen, 16-relay technicians, 20-substation operators, and 28-laborers. The members indicated that
exposure to these categories did not start until the 1950s
because the company did not use PCB containing equipment
until then. Routine exposure (level three) was assigned for
the entire study period starting at 1950 to three categories;
9-mechanics, 13-electricians, and 28-laborers. The other three categories were assigned occasional exposure (level two) for that same period (Table 4.6 and Figure 4.10). The members from company B felt no change in exposure assignment was needed because there was still enough PCB contaminated
equipment to keep exposure levels the same.
Solvents
Potential exposure to solvents encompassed a greater
number of occupational categories as indicated by the members
of each company committee. Company A indicated ten
Table 4.5 - PCS Exposure for Company A throughout Entire Study Period__________
Decade
1930's 1940's 1950's 1960's 1970's 1980's
PC* Exposure** Exposure** Exposure** Exposure** Exposure** Exposure**
11 1 1 1 1 1 11111 11111 11 1 1 1
II 1 1 1
11111
I 1 11 1
III 1 1 3 3 3 2 1
11111 11111
3 3 3 2 1 3 3 3 2 1 II 1 1 1 11 1 1 1
11 1 1 1
11 1 1 1 11111 3 3 3 2 1 11 1 1 1 11111
11 1 1 1
11111 11111
3 3 3 2 1
_____________________1__________1__________1__________1__________1 * Occupational Category Number
** Exposure Levels 3 - Routine, 2 -Occasional, and 1 - Low/None
1 1
2 1
3 1
4 1
5 1
6 1
7 1
8 1
9 3
11 1
12 1
13 3
14 3
15 1
16 1
17 1
19 1
20 1
21 3
22 1
23 1
25 1
26 1
27 1
28 3
29 1
Figure 4.8 - PCB Exposure for Company A during the
1930s to 19603
Occupational Category
28 .
25 :
21:
17 .
14 .
11 .
7: I
4 .
1:
Exposure Level
Figure 4.9 - PCB Exposure for Company A during the 1970s
Occuaptional
Category
28
26
23
21 ] 19 ]
16 J
14 ]12 j
9
7 ] 5 ]
3
1 ]
Table 4.6 - PCB Exposure for Company B throughout Entire Study Period
1930's
OC* Exposure**
Decade
1940's 1950's 1960's 1970's
Exposure** Exposure** Exposure** Exposure*'
1980's Exposure** 1 2 3 4 5 6 7 8 9 11 12 13 14 15 16 18 19 20 21 22 23 24 25 26 27 28 29 1 1 1 1 1 1 1 1 1 1 1 1 1 1 1 1 1 1 1 1 1 1 1 1 1 1 1 1 1 1 1 1 1 1 1 3 1 1 3 2 1 2 1 1 2 1 1 1 1 1 1 1 3 1 1 1 1 1 1 1 1 1 3 1 1 3 2 1 2 1 1 2 1 1 1 1 1 1 1 3 1 1 1 1 1 1 1 1 1 3 1 1 3 2 1 2 1 1 2 1 1 1 1 1 1 1 3 1 1 1 1 1 1 1 1 1 3 1 1 3 2 1 2 1 1 2 1 1 1 1 1 1 1 3 1
* Occupational Category Number
** Exposure Levels 3 - Routine, 2 -Occasional, and 1 Low/None
Figure 4.10 - PCB Exposure for Company B during the
1950s to 1980s
•
Figure 4.11 and 4.12). They were 8-services, 9-mechanics,12-boilermakers/steamfitters, 13-electricians, 14-linemen,
16-relay technicians, 21-riggers, 22-auto and truck
mechanics, 23/24-painter/pipe coverers, and 28-laborers. The
exposures assigned to these categories were occasional for the entire study period with the exception of relay
technicians because this category did not come into existence
until the 1960s.
Company B committee members also indicated numerous occupational categories exposed to solvents (Table 4.8 and
Figure 4.13). The members indicated seventeen categories had
exposure. They were 3-technical workers, 8-services, 9-mechanics, 11-machinists, 12-boilermakers/steamfitters, 13-electricians, 14-linemen, 15-instrument and control
technicians, 16-relay technicians, 18-cable splicers,
19-power plant operators, 20-substation operators, 22-auto and
truck mechanics, 23-painter, 24-pipe coverers, 28-laborers,
and 29-other crafts/trade workers. All of the categories
were assigned routine exposure (level three) except
20-substation operators, 24-pipe coverers, and 9-other
crafts/trade workers which were assigned occasional exposures
(level two).
Exposure by Person-Years
The person years information was applied to the
occupational categories with potential exposures to each
Table 4.7 - Solvent Exposure for Company A throughout Entire Study Period
Decade
1930's 1940's 1950's 1960's 1970'3 1980's
OC* Exposure** Exposure** Exposure** Exposure** Exposure** Exposure**
1 1 1 1
2 1 1 1
3 1 1 1
4 1 1 1
5 1 1 1
6 1 1 1
7 1 1 1
8 2 2 2 2 2 2
9 2 2 2 2 2 2
11 2 2 2 2 2 2
12 2 2 2 2 2 2
13 2 2 2 2 2 2
14 2 2 2 2 1 1
15 1 1 1 1 1
16 1 1 2 2 2
17 1 1 1 1 1
19 1 1 1 1 1
20 1 1 1 1 1
21 2 2 2 2 2 2
22 2 2 2 2 2 2
23 2 2 2 2 2 2
25 1 1 1 1 1 1
26 1 1 1 1 1 1
27 1 1 1 1 1 1
28 2 2 2 2 2 2
29 1 1 1 1 1 1
* Occupational Category Number
** Exposure Levels 3 - Routine, 2 -Occasional, and 1 - Low/None
Figure 4.11 - Solvent Exposure for Company A during the 1930s
to 1960s
Occupational
Category
28: 26: 23: 21:
16:
14:
12: 9:
7:
51
Occupational
Category
Exposure Level
Figure 4.12 - Solvent Exposure for Company A during the
1970s and 1980s
28:
25;
21:
14:
.
11
7i
i
1 2
Table 4.8 - Solvent Exposure for Company B throughout Entire Study Period
Decade
1930's 1940's 1950's 1960's 1970'3 1980's
OC* Exposure** Exposure** Exposure** Exposure** Exposure** Exposure**
1 2 3 4 5 6 7 8 9 11 12 13 14 15 16 18 19 20 21 22 23 24 25 26 27 28 29 1 1 3 1 1 1 1 3 3 3 3 3 3 3 3 3 3 2 1 3 3 2 1 1 1 3 2 1 1 3 1 1 1 1 3 3 3 3 3 3 3 3 3 3 2 1 3 3 2 1 1 1 3 2 1 1 3 1 1 1 1 3 3 3 3 3 3 3 3 3 3 2 1 3 3 2 1 1 1 3 2 1 1 3 1 1 1 1 3 3 3 3 3 3 3 3 3 3 2 1 3 3 2 1 1 1 3 2 1 1 3 1 1 1 1 3 3 3 3 3 3 3 3 3 3 2 1 3 3 2 1 1 1 3 2 1 1 3 1 1 1 1 3 3 3 3 3 3 3 3 3 3 2 1 3 3 2 1 1 1 2 2 * Occupational Category Number
** Exposure Levels 3 - Routine, 2 -Occasional, and 1 - Low/None
Figure 4.13 - Solvent Exposure for Company B throughout
Entire Study Period
years information for each occupational category for each decade of the study period. Table 4.10 shows the percent of exposure by person years for each decade. Percent of
exposure was determined by combination all person years of
those occupational categories with exposure of routine (level
three) and occasional (level two). Figures 4.14 - 4.17 shows
the percent of exposure for company A across the entire study
period for each chemical except benzene. The range of exposure was from fourteen to fifty-three percent with the
solvent having the greatest percentage of exposure. Creosote
and PCB had the same exposure while herbicide had the lowest
percentage of person years of exposure.
Table 4.11 and 4.12 shows company B's person years
information for each occupational categories for each decade
of the study period and its percent exposure information.
Figure 4.18 - 4.21 shows the percent of exposure for company
B across the entire study period for each chemical except
benzene. The range of exposure was from eighteen to
fifty-five percent. The distribution of exposure was similar to
company A with solvent having the greatest percentage of
exposure while creosote and PCBs had the similar exposure and
herbicides having the lowest percentage of person years of
Table 4.9-- Summary of Company A's Person Years for Entire Study Perioci Decade
1930's 1940'S 1950's 1960's 1970's 1980's Total
OC* Per-yrs Per-yrs Per-yrs Per-yrs Per-yrs Per-yrs Per-Yrs
1 245 436 489 586 1528 3385 6668
2 177 428 1121 1621 6406 12260 22013
3 59 157 455 543 1703 3449 6365
4 11 67 101 131 650 969 1929
5 10 91 138 296 907 1436 2879
6 175 426 1303 1277 1817 2717 7715
7 57 104 312 647 611 424 2155
8 41 189 341 319 279 193 1362
9 87 326 511 653 2013 3623 7213
11 0 11 5 0 37 64 118
12 0 37 46 0 0 0 83
13 67 293 710 74 1722 1892 4759
14 433 1159 3059 3337 5421 6280 19689
15 0 0 23 40 449 1553 2066
16 0 2 1 11 149 343 506
17 0 10 22 12 272 626 943
19 108 357 864 938 1559 2292 6117
20 38 151 200 245 528 206 1367
21 0 0 0 2 68 107 177
22 167 509 58 17 81 599 1431
23 8 41 105 104 136 259 653
25 0 2 0 0 0 8 9
26 7 95 229 193 187 210 921
27 11 39 101 169 533 943 1798
28 110 281 726 645 716 395 2873
29 96 150 121 50 129 126 672
Total 1905 5363 11043 11910 27902 44359 102481
Occupational Category Niomber
Table 4.10 - Company A's Percent of Person Years Exposure for Each Chemical*
Decade
Chemical 1930'3 1940'3 1950'3 1960's 1970's____19 80's Overall
Creosote 37 38 45 40 36 28 34
Herbicides 14 17 18 12 0 0 15
PCBs 37 38 45 40 36 28 34
Solvents 48 53 50 43 38 30 37
* Percent of exposure was calculated by combining all the person years from the occuaptional categories indicated to have potential exposure (only routine and occasional exposures) to the chemical then dividing by the total person years for that decade.
Figure 4.14 - Herbicide Exposure for Company A by % of Per-Yrs for Each Decade of the Study Period
% of Total
Per-Yrs
>i f\ ͣ
•3 (^ .
?n .
10 ͣ
0 ͣ
-
ͣ
-
_HL
30 40 50 60
Decade
70 80
Figure 4.15 - Creosote Exposure for Company A by % of
Per-Yrs for Each Decade of the Study Period
% of Total
Per-Yrs
60
50
40
30
20
10
^^
ͣ
i
^^1
ͣͣ
IBBI
HH
\^^M Ijj^l
f"^
IHH
I^B
1 1
I 1
II 1
1 1
1 1
1 1
1 1
1
1
1
1 1
II II
II 1
II 1
II II
li^H
1 1
in
1 1
1 1
II 1
II 1
30 40 50 60
Decade
Figure 4.16 - PCB Exposure for Corrpany A by % of
Per-Yrs for Each Decade of the Study Period
% of Total
Per-Yrs
Figure 4.17 - Solvent Exposure for Company A by % of
Per-Yrs for Each Decade of the Study Period
% of Total
Per-Yrs
Table 4.11 - Summary of Company B's Person Years for Entire Study Period
Decade
1930's 1940*3 1950'3 1960's 1970's 1980's Total
OC* Per-yrs Per-yrs Per-yrs Per-yrs Per-yrs Per-yrs Per-Yrs
1 986 1478 2197 2568 2494 2234 11958
2 1792 3088 6481 8432 10298 11902 41993
3 1801 2060 3226 4223 5379 5497 22185
4 771 1109 1933 2797 3904 3672 14186
5 802 1200 1901 2520 2373 2047 10843
6 5168 5175 6760 7972 9800 9576 44452
7 954 1262 1624 2446 2265 1891 10443
8 878 1430 2956 3775 3410 1726 14176
9 851 1180 2735 5204 7022 6087 23079
11 315 625 950 1048 1392 888 5218
12 229 959 1660 1472 1232 955 6507
13 1110 1251 1812 1867 2147 1829 10016
14 1821 3469 6036 9136 10358 7288 38108
15 81 111 83 146 80 29 530
16 127 181 166 4 0 0 478
18 237 393 758 946 986 651 3971
19 217 981 1649 1632 2108 3193 9780
20 891 1215 1514 1585 1209 515 6929
21 5 66 256 368 412 579 1686
22 289 308 503 740 1261 1046 4147
23 98 186 240 221 147 28 920
24 10 36 58 88 149 309 648
25 105 300 540 761 979 1018 3702
26 195 170 178 108 166 53 870
27 927 1371 2455 2493 2628 2577 12451
28 1095 1014 1931 3173 4374 3264 14853
29 946 1262 1524 1580 1433 748 7494
Total 22701 31881 52125 67305 78006 69603 321622
* Occupational Category Number
Table 4.12 - Company B's Percent of Person Years Exposure for Each Chemical*
Decade
Chemical 1930's 1940's 1950's 1960's 1970's 1980's Overall
Creosote 18 19 22 27 29 25 25
Herbicides 25 26 29 34 34 27 30
PCBs 26 26 27 31 32 27 29
Solvents 48 52 53 55 55 49 53
* Percent of exposure was calculated by combining all the person years from the
occuaptional categories indicated to have potential exposure (only routine and occasional exposures) to the chemical then dividing by the total person years
Figure 4.18 - Herbicide Exposure for Company B by % of Per-Yrs for Each Decade of the Study Period
of Total Per-Yrs
DU ͣ
DU '
40 ͣ
•5 n . ^~ ͣ""
1
20 ͣ10 •
n ͣ
—
1
f
—
H
30 40 50 60
Decade
70 80
Figure 4.19 - Creosote Exposure for Company B by % of
Per-Yrs for Each Decade of the Study Period
of Total
Per-Yrs
Figure 4.20 - PCB Exposure for Company B by % of Per-Yrs for Each Decade of the Study Period
% of Total
Per-Yrs
DU ͣ an .
30 "
20 ͣ
10 ͣ
n ͣ
—— ——
1
_— —
1
—ͣ
30 40 50 60
Decade
70 80
Figure 4.21 - Solvent Exposure for Company B by % of Per-Yrs for Each Decade of the Study Period
% of Total
Per-Yrs
30 40 50 60
Chapter V - Discussion
The exposure to benzene is of great concern because of
its strong association with leukemia. The use of benzene in
the early decade of the study is vague. Those members from
both companies with over thirty years of experience indicated
the reluctance of using benzene dating back to 1950 because
of its high flammability. Most often chlorinated solvents,
carbon tetrachloride, were used instead of benzene. However,
further investigation by interviewing retired employees is
needed especially for those isolated groups of workers in
laboratories and repair shops who may have potential benzene
exposure.
Further investigation is also needed for those
occupational categories with herbicide exposure. Detailed
information concerning frequency of exposure is needed since previous studies show an increasing risk of leukemia with
increasing frequency of exposure. A recent French study by
Bastuji-Garin of workers exposed to electromagnetic fields
indicates a possible relationship between exposure to
weed-46
killers (herbicides) and acute leukemia.
Discrepancies between the two companies in the
determination of exposure to the five chemicals may have
resulted from various factors. These factors were
in tasks performed by the most common job titles in
occupational categories, regulatory changes and their
effects, technological changes, and unclear definitions of
exposure levels.
There are bound to be discrepancies arising from
differences between the company committees and their members.
The committee for company A consisted of fewer members so
that the decision making process was less cumbersome. Unlike
company A, the committee for company B consisted of thirteen
members which made the decision making process more
difficult. For example, the exposures assigned for PCBs at
company A were reduced during the 1970s and 1980s as a result
of regulatory limits on PCBs and work practices reducing
exposure. Company B's assignment of exposures to PCB
remained constant throughout the entire study period because
the majority of the members felt that PCB contaminated
equipment was still abundant and exposure was significant.
This also occurred for creosote except the change in exposure was a result of the use of different types of wood
preservatives for utility pole and railroad ties. The
majority of the members from company B felt the changes in
wood preservative was not enough to reduce the exposure to
those specified occupational categories.
These regulatory and technological changes contributed
to the differences between the company committees. The
significance of these changes in terms of their impact on
of PCBs, which was banned from commercial use, the allowable
limit of PCB contamination in transformer oil is 50 ppm.
Transformer oil is recycled so contamination of other
equipment•is likely to occur. Thus, company B may be valid by not reducing exposure in the 1970s and 1980s because PCB
exposure may still be significant.
Similar to regulatory changes, technological changes may
have had similar impact on the exposure results. Creosote
exposure involves contact with creosote treated wood products
including utility poles and railroad ties used for supporting
transformers and capacitors. The reduction in the use of
creosote treated poles did not start until the 1970s. Some
of the compounds used as alternatives were zinc chloride,
mercuric chloride, copper sulphate, sodium flouride, and
arsenic. The reduction in creosote treated poles was not
significant in the minds of those committee members in
company B and made no change in exposure for the 1970s and and 1980s unlike company A which reduced their assigned
exposure.
The differences in tasks performed by the most common
job titles within occupational categories may help explain
why for each chemical except benzene, for which no
assignments were made, there were always different groups of occupational categories that were assigned exposure to the
same chemical for each company. In the case of herbicides,
category 8 (services) for company B and category 21 (riggers)
for company A were assigned exposure because their job task
caused potential exposure to herbicides. Services for
company B are sometimes involved with the landscaping of
areas around company facilities. Riggers for company A are involved with right of way construction where there is
potential of exposure to herbicide residual on dead foliage.
Unclear descriptions of potential exposure levels may have contributed to different assignment exposures,
especially for solvents. The exposures assigned by the
members from company B were mostly routine compared to company A which were mostly occasional. Some of the
occupational categories for company B like 9-mechanics,
13-electricians, 16-relay technicians, and 18-cable splicers
because of their work in underground substation vaults have
greater potential for solvent exposure in their confined work
environment. The routine exposures assigned to other
occupational categories may be debatable. One criterion for
exposure was the presence of the chemical in the work
environment. This may have been misinterpreted by the
company B committee members. The chemical, in this case
solvents, may be present in the work environment but in order
for exposure to occur the potential for exposure to a worker
to the chemical needs to exist.
Despite the discrepancies in the results, the company committees were able to provide some information on the
the inability to fully understand all the job tasks and which
job titles performed them.
The use of person-years did relieve some of the burdens
in distinguishing between job titles and assigning the proper exposure to occupational categories. Misclassification of
exposure is difficult to prevent in historical exposure
assessment. The person-years information was used to find the most common job titles which were supplied to the the committees in the assignment of exposures. Thus, the
exposures assigned to the occupational categories were based
on the most common job titles. This allowed the
misclassification of exposure to be isolated to those job
titles that were less likely to occur.
The person years were used to determine the percentage
of exposure and showed differences between the two companies. For company A, figures 4.14 - 4.17 show high percentage of exposure in the 1950s and a subsequent decline. This may have resulted from the need for workers with more specialized skills such as engineers and specialist, especially with the growth of the company and the use of nuclear power.
As for company B, figures 4.18 - 4.21 show high
percentage of exposure in the 1970s then a decline in the 1980s. Company B has a great dependence on the city that is part of their service area. The metropolitan area may have restricted the technological growth of the company.
Retrofitting old plants and underground systems would be
difficult in a city.
The reliability of the exposure assignments made by the
company committees is still undetermined so the accuracy of
the exposure information unknown. Despite this, the use of
committees to assess exposures was advantageous in terms of
saving both money for the study and time when company
personnel provided their assistance, knowledge, and
experience to accomplish the difficult task of exposure
Chapter VI - Conclusions
It is important to understand that the assigned exposure levels by the company committees are indications of potential exposures to the five specific chemicals. The members have
no way of accurately assessing actual exposure levels,
especially historical exposures. The intent of the study was
not to obtain actual exposure levels but to gather potential exposure information to determine if a relationship exists between exposure to chemicals and the diseases of interest
(leukemia and brain cancer).
The results were useful in indicating those occupational categories with potential exposure to the creosote,
herbicides, PCBs, and solvents. Occupational categories in
company B appeared to have greater potential for exposure than company A. This may be due to some problems in the strategy which utilized expert judgment to assess potential exposure levels or it may be due to the fact that the
companies are just different.
Refinements in the current strategy can strengthen the accuracy of the exposure information since the use of expert
judgment by company committees raises questions concerning
the reliability of the exposure assignments. Questionnaires,
interviews, and walk through surveys can be used prior to the
information about job tasks, chemicals used, frequency of
exposure to specific chemicals, work practices, and
historical changes. All of this information can then be used
to improve the assignment of exposures by the company
committees. Better understanding of the different companies and job tasks performed can bring about more concise
questions further isolating potential exposures. The change
in strategy makes the company committee serve as a validation
committee which would review all the exposure information
obtained from the questionnaires, interviews, and walk
through surveys.
For the purpose of validation, monitoring data can be obtained. This information would only be relevant to current exposure and serve to validate only those exposures. The data might show low exposure intensity but can show the
presence of the chemicals in the work environment. The
combination of monitoring data and information gathered from questionnaires, interviews, and walk through surveys can serve to validate current exposure levels. This validation
of current exposures would then increase the reliability of
the past exposure estimates.
The validity of the exposure information is important because of its implications to the effects of electric and magnetic fields exposure. Chemicals may confound the
association between electric and magnetic fields exposure and
cancer for those occupational categories who are involved
#
distribution. These categories include 9-mechanics, 13-electricians, 14-linemen, and 28-laborers. These categorieshave fairly routine potential exposure to creosote,
herbicides, polychlorinated biphenyls, and solvents and are
involved with various aspects in transmission and
distribution of electricity.
The application of the strategy to the other three
utility companies involved in the electric and magnetic
fields study can bring more information and help answer the
questions concerning similarities and differences between
electric utility companies and potential confounding by the
chemicals of interest.
References
1. Stewart, P. A. and R. F. Herrick. Issues in Performing
Retrospective Exposure Assessment. Applied Occupational
and Environmental Hygiene. 6:421-427 (1991) .
2. Kromhout, H., Y. Oostendrop, D. Hee derik, and J. S. M.
Boleij. Agreement between Qualitative Exposure Estimates
and Quantitative Exposure Measurements. American Journal
of Industrial Medicine. 12:551-562 (1987),
3. Teschke, K., C. Hertzman, H. Dimich-Ward, A. Ostry, J. Blair, and R. Hershler, A Comparison of Exposure
Estimates by Worker Raters and Industrial Hygienist.
Scandinavian Journal of Work, Environment, and Health.
15:424-429 (1989).
4. Hertzman, C, K. Teschke, H. Dimich-Ward, and A. Ostry.
Validity and Reliability of a Method for Retrospective Evaluation of Chlorophenate Exposure in the Lumber
Industry. American Journal of Industrial Medicine.
14:703-713 (1988).
5. Esmen, N. A. Retrospective Industrial Hygiene Surveys. American Industrial Hygiene Association Journal.
40:58-65 (1978) .
6. Stewart, P. A., A. Blair, D. A. Cubit, R. E. Bales, S. A. Kaplan, J. Ward, W. Gaffery, M. T. O'Berg, and J. Walrath. Estimating Historical Exposures to
Formaldehyde in a Retrospective Mortality Study. Applied Industrial Hygiene. 1:34-41 (1986).
7. Dosemeci, M., P. A. Stewart, and A. Blair. Three
Proposals for Retrospective, Semiquantitative Exposure Assessments and their Comparison with the other
Assessment Methods. Applied Occupational and
Environmental Hygiene. 5:52-59 (1990).
8. Dement, J. M., R. L. Harris, M. J. Symons, and C. M. Shy. Exposures and Mortality Among Chrysotile Asbestos
Workers. Part I: Exposure Estimates. American Journal
of Industrial Medicine. 4:399-419 (1983).
9. Van Ert, M. D., E. A. Arp, R. L. Harris, M. J. Symons, and T. M. Williams. Worker Exposure to Chemical Agents