Political and social changes in South Africa over the last decade have also impacted on psychological test development and testing practices (Claassen, 1997; Foxcroft, 1997; Owen, 1998). According to the Professional Board for Psychology of the Health Professions Council of South Africa (HPCSA) (HPCSA, 1998, p. 1) “past apartheid policies impacted negatively on test development and use in South Africa … (and there is a) … need to adapt and develop culturally appropriate measures”. An additional complicating issue is that the differences between groups are constantly changing (Verster & Prinsloo, 1988). Shuttleworth-Jordan (1996, p. 97) speaks of “signs of a narrowing and possibly disappearing gap across race groups on cognitive test results in association with a reduction in socio-cultural differences …”. These factors in the South African context, with its numerous race groups and people from very diverse backgrounds, present a unique challenge.
When psychological tests are used, one of the core issues in comparing individuals and groups is to ensure that item bias (and test bias) is investigated in order to minimise inappropriate interpretations. The Employment Equity Act 55 of 1998 specifically prohibits the use of psychological tests and other such measures unless it can be shown that they are not biased, do not discriminate against any group and can be used fairly for all (employees). When tests are labelled “biased”, the accusations often have to do with the instruments chosen for a particular context, the way in which these tests are administered or the way in which the results are interpreted and/or used. These broader issues are often far removed from the actual instrument itself and its inherent properties. Osterlind (1983, p. 12) also warns that “bias is not the mere presence of a score difference between two groups”. The term “bias” has largely been replaced by that of “differential item functioning or DIF”, which indicates differences in performance levels of comparison groups of the same ability level.
Less than 10 years ago, Owen and Taljaard (1996, p. 79) described bias research in South Africa as “still in its infancy”. One of the reasons for that was that in the past, separate tests were constructed for different subgroups, which negated the
need for bias analysis. However, with the South African society becoming more integrated, there is currently a strong need for item bias analysis during test construction and for the evaluation of possible test bias in terms of the validity of instrument(s). Such research is strongly recommended by the Psychometrics Committee of the Board of Psychology of the HPCSA. Earlier research showed distinct differences between cultural groups, even on measures traditionally considered to be culture-fair (Owen, 1992a). However, new psychometric techniques allow for more sophisticated investigation of test and item bias (Embretson, 1996; Reckase, 1996). Factors that typically need to be considered as causes for item and/or test bias are culture, socioeconomic status, level of education or language (Owen, 1992b; Van de Vijver, 1998; Van Zyl & Visser, 1998). However, score comparability can only be investigated meaningfully after construct comparability has been shown. According to Owen (1998), construct comparability is the most fundamental issue, because it concerns the nature and essence of what is being measured. This can be assessed by, for instance, factor analysis and comparison of reliabilities for different groups. In the case of the Learning Potential Computerised Adaptive Test (LPCAT), a clear one-dimensional factor structure was shown for the LPCAT items for all groups concerned and comparable reliabilities for various subgroups were found (De Beer, 2000b). Van de Vijver and Poortinga (1997) distinguish between three forms of bias that need to be considered, namely construct bias, method bias and item bias. The focus of the present article is on item bias or DIF. It is necessary to distinguish between bias, which, from a technical and statistical perspective, can be measured objectively, and fairness which often concerns a subjective contextual evaluation. A significant feature of fairness is that it cannot be described in absolute terms. One cannot therefore refer to a test as either fair or not fair - one should rather describe it as fair to a greater or lesser degree. What is of practical importance is not only the test characteristics, but the decisions based on the test scores since it is in these decisions that people’s lives are affected in a fair or unfair manner. The present article deals with one particular aspect of the process, namely that of DIF analysis during test development. The social consequences of test use and predictive validity results in particular are not discussed here.
MARIÉ DE BEER
Department of Industrial and Organisational Psychology UNISA
ABSTRACT
When differential item functioning (DIF) item analysis procedures based on item response theory (IRT) are used during test construction, it is possible to draw item characteristic curves for the same item for different subgroups. These curves indicate how each item functions at various ability levels for different subgroups. DIF is indicated by the area between the curves. In the construction of the Learning Potential Computerised Adaptive Test (LPCAT), this method was used to identify items that indicated bias in terms of gender, culture, language or level of education. Items that exceeded a predetermined amount of DIF were discarded from the final item bank, irrespective of which subgroup was being advantaged or disadvantaged. The process and results of the DIF analysis are discussed.
OPSOMMING
Waar differensiële itemfunksioneringsprosedures (DIF-prosedures) vir itemontleding gebaseer op itemresponsteorie (IRT) tydens toetskonstruksie gebruik word, is dit moontlik om itemkarakteristiekekrommes vir dieselfde item vir verskillende subgroepe voor te stel. Hierdie krommes dui aan hoe elke item vir die verskillende subgroepe op verskillende vermoënsvlakke te funksioneer. DIF word aangetoon deur die area tussen die krommes. DIF is in die konstruksie van die “Learning Potential Computerised Adaptive test (LPCAT)” gebruik om die items te identifiseer wat sydigheid ten opsigte van geslag, kultuur, taal of opleidingspeil geopenbaar het. Items wat ’n voorafbepaalde vlak van DIF oorskry het, is uit die finale itembank weggelaat, ongeag die subgroep wat bevoordeel of benadeel is. Die proses en resultate van die DIF-ontleding word bespreek.
USE OF DIFFERENTIAL ITEM FUNCTIONING (DIF) ANALYSIS FOR
BIAS ANALYSIS IN TEST CONSTRUCTION
Requests for copies should be addressed to: M De Beer, Department of Industrial and Organisational psychology, UNISA, PO Box 392, UNISA, 0003
Apart from the contextual issues which have to be addressed in other ways, one way in which we can attempt to investigate the accusation that tests are biased is to examine the test items themselves – without reference to external criterion measures. Test item bias or DIF typically refers to some form of systematic error and involves the psychometric properties of the items themselves which indicate that they do not measure equally for different subgroups. According to Osterlind (1983, p. 11), “a test item is said to be unbiased when the probability for success on the item is the same for equally able examinees of the same population regardless of their subgroup membership”. DIF should be investigated during the test construction process and then, when those items that have withstood the DIF scrutiny, have been used to compile the test, test bias (predictive bias) should also be investigated. According to Osterlind (1983, p. 8), “tests should be constructed so that when an inequality exists between the test scores of groups, the disparity is due primarily to differences in whatever it is the test purports to measure”. By identif ying and eliminating DIF, improved tests can be constructed. In this regard, it is essential to also evaluate differential validity – to ensure that appropriate (and accurate) predictions based on empirical research results, can be made from test results. Although the final concern is the evaluation of test bias, the process has to start with the investigation of item bias or DIF. During test construction, item analysis is used to identify items that do not adhere to acceptable psychometric requirements. It is not unusual to lose approximately one-third of the initial set of items in this process, because of various factors affecting the performance of items (McBride, 1997). This article deals only with the initial phase of test construction, namely test item bias analysis by means of item response theory (IRT) based DIF analysis.
Test item bias or DIF
Osterlind (1983) describes test item bias as a systematic error in the measurement process which affects all measurements in the same way – sometimes increasing and at other times decreasing it. In layman’s terms, the presence of test item bias or DIF means that two people who are at similar levels of the latent construct being measured but who belong to two different cultural, race or gender groups, respond differently to a particular question purporting to measure that construct, resulting in differences in the level of “performance” measured. Assuming that the actual level of the two individuals from different subgroups is the same, the “artificial” difference in the measured level is interpreted as an effect of something in the item that is unrelated to the construct being measured, but which results in the difference in the responses of the two individuals. A biased or DIF item is therefore one for which the probability of success is not the same for equally able test takers of different subgroups. When membership of a subgroup influences performance on an item that is not explained by the latent trait in question, the item indicates bias or DIF. Ertuby and Russel (1996) suggest that because of their greater sophistication, IRT procedures provide the best results for detecting cultural differences on particular items.
Item response theory (IRT) models
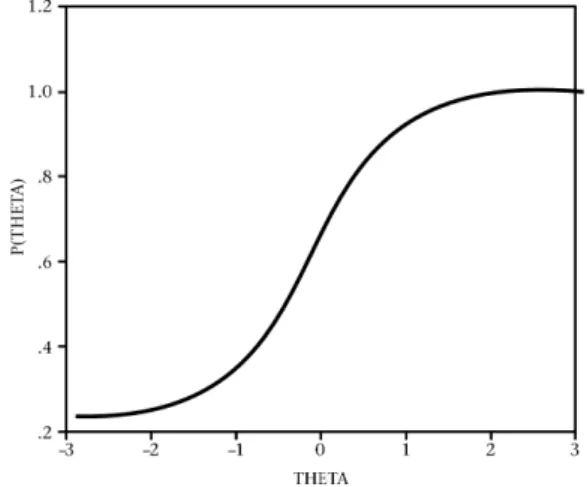
Much of educational and psychological measurement concerns underlying (latent) variables of interest and involves determining how much of such a latent trait a person possesses (Hambleton, 1994; Hambleton & Slater, 1997; Hambleton & Swaminathan, 1985; Lord, 1980). A correct response depends on both the characteristics of the item and the person’s ability. The probability of a correct response is expressed as a mathematical function of examinee ability and item characteristics – also known as the item characteristic curve (ICC). The ICC graphically represents the regression of the item score on examinees’ ability, which is known as the item response function. This function is plotted with the ability level of examinees along the X-axis, against the
probability of answering an item correctly on the Y-axis. Each examinee is considered to have an ability score which places him or her somewhere on the ability scale. An examinee’s ability is denoted by the Greek letter theta (q). At each ability level there is a certain probability that an examinee with that ability will answer the item correctly. This probability is indicated by P(q). In typical items, this probability is smaller for individuals with low ability than for those with higher ability levels. Therefore, if the probability function P(q) is plotted against ability level, the result is the typical S-shaped form of the ICC (see Figure 1). Each item will have its own ICC, the shape of which, in the case of the three-parameter model, is determined by the following three item parameters (Baker, 1985; Lord, 1980; Warm, 1978):
The b-parameter (difficulty value)
One way in which ICCs differ from one another, is in the horizontal location of the inflection point on the ability or theta axis. This is the point where the ICC changes form from concave to convex and indicates the difficulty level of the item. The horizontal position of the inflection point is called the “b-parameter” or “b-value”, reflecting the difficulty levelof the item. The b-value represents the point on the standardized (0,1) ability scale where the probability of a correct response is 0,50 (ie a 50% chance of getting the item correct). The larger the b-value, the more difficult the item will be. Although b-values theoretically range from –¥to +¥, typical b-values range from -2,5 to +2,5. A b-value of -2,5 indicates a very easy item, while a b-value of +2,5 indicates an extremely difficult one.
The a-parameter (discrimination value)
The second parameter of the three-parameter IRT model is the “a-parameter” or “a-value” which is related to the slope of the ICC at the inflection point (b-value) and indicates the precision of measurement at the particular difficulty level of the item. The a-parameter is called the “discrimination index” of the item response function. The steeper the slope of the curve, the greater the discrimination will be, but the smaller the range of discrimination. Theoretically the a-value may range from 0 to +¥, but a-values typically range between 0,0 and 2,0 with values exceeding 2,0 seldom being found. Items with a-values below 0,5 are insufficiently discriminating for most testing purposes. With a high a-value, the item has a steep ICC and discriminates well, but over a small range of theta. The larger the discrimination value, the better the item can separate examinees into different ability levels in the region of the item difficulty level.
The c-parameter (pseudo-chance level)
The three general IRT models vary in terms of the item characteristics they include. The one-parameter model is based on only the item difficulty value. This model is the simplest in that only the difficulty level (b-value) of a test item and the examinee’s ability level are taken into consideration. This model, while allowing differences between items in terms of their difficulty level, does not allow differences in other characteristics of items (Weiss, 1983). In the two-parameter model, the item discrimination (a-value: the rate of change of the probability of a correct response as a function of the underlying trait level) is also considered, together with the difficulty level of the item. When multiple-choice items are used and items can be answered correctly by guessing, the third parameter, namely the pseudo-chance parameter (c-value), can be added to form the three-parameter model. In the one-parameter (Rasch) model, only the b-value varies, while the a-value and c-a-value are taken as constants (usually the a-a-value is set at 1,00 and the c-value at 0,0). In the two-parameter model, both the b-value and the a-value vary, while the c-value is still set at 0,0. The three-parameter model allows all three parameters (a, b and c) to vary.
For the three-parameter model in particular, stable and accurate estimation of the item parameters requires large numbers of examinees over a broad range of ability. It is generally recommended that samples of at least 1 000 be used for the three-parameter model (Baker, 1985; Hambleton, 1994; Hambleton & Swaminathan, 1985; Weiss, 1983). The accurate estimation of the c-parameter also requires large numbers of examinees at (very) low ability levels. Nevertheless, the advantages offered by these models far outweigh the efforts involved in using them, despite drawbacks concerning the sample sizes required and the mathematical/statistical complexity of the theory.
Measurement of DIF using ICCs
IRT has brought about significant changes in psychometric theory and test development. In its most basic form, it postulates that a single ability underlies examinee performance on a test and that the probability of a correct response on an item is a monotonically increasing curve (Hambleton & Slater, 1997). IRT offers a powerful method of investigating item bias – also referred to as differential item functioning (DIF). The ICC of an item plots the probability of the “correct” response against the magnitude or level of the underlying (latent) trait being measured. Osterlind (1983) describes ICCs as the most elegant of all the models to tease out item bias. IRT models assume unidimensionality, local independence of items and the fact that the probability that an examinee will respond correctly to a particular item depends upon the shape of the curve and the individual’s level with regard to the underlying construct being measured. However, it is not dependent upon the individual’s performance relative to any particular group (Osterlind, 1983). One of the most useful features of IRT is that the examinee’s estimated ability level and item difficulty level are put on the same scale. This allows for the illustration of item difficulty and item discrimination simultaneously using ICC graphs to depict the characteristics of each item. This method provides a powerful base for assessing differential item functioning (item bias) by also using visual inspection. In IRT terms, the “overall notion is that the item characteristic curves generated for each of the two contrasting groups should be alike for an item to be considered unbiased” (Osterlind, 1983, p. 16).
The use of ICCs for DIF detection concerns the comparison of differences in the ICCs for different subgroups. Only two groups can be compared at a time, but a particular sample can be divided into various subgroups for such comparisons. “The area between the equated ICCs is an indication of the degree of bias present in a considered test item” (Osterlind, 1983, p. 61). Although both groups are on essentially the same scale, they
need to be equated by means of a linear transformation. The difference in scales is caused by the fact that theta is arbitrarily defined as having a mean of 0 and a standard deviation of 1 in each separate group (Owen, 1992b). Despite the fact that the a-and b-parameters are invariant from group to group, they are not invariant when the origin of theta changes arbitrarily in each new parameterisation. The scales of two different groups then have to be equated before the respective parameters can be compared (Owen, 1992b). Once the theta scales have been equated, meaningful comparison of the ICCs of the two groups is possible (Osterlind, 1983). Bias is inferred when the ICCs differ. Procedures for decision making may include simply inspecting the graphs visually or calculating the actual differences. Limits or cut-off criteria are arbitrary because no specific significance test is available to test differences between estimates of area (Osterlind, 1983).
Figure 1: An example of an item characteristic curve (ICC)
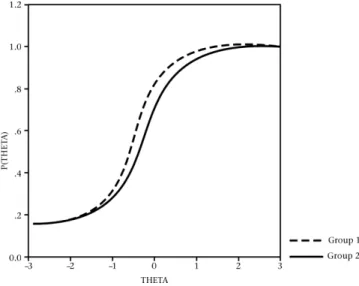
The information can also be provided for two subgroups at a time, which results in two plotted graphs clearly indicating subgroup performance over the spectrum of levels of the underlying trait. This allows for comparison of subgroup performance at various levels of the underlying trait. If the graphs of two subgroups fall on top of each other, the level of performance (probability of “correct” response) at that level of the latent trait is the same. When the graphs differ, this indicates differences in performance despite similarity in the latent trait being measured – thus giving evidence of test item bias or DIF. The extent of bias or DIF can be measured by the magnitude of the area between the two graphs. Since the ICC graph values for the respective comparison groups were known, the area between the two ICCs was calculated by dividing the area into small rectangular areas over the entire ability range and calculating and adding the areas formed between the ICCs.
Assessing item bias or DIF
The way in which IRT-based ICCs are used to evaluate DIF is to compare the ICCs of two groups (Osterlind, 1983). Various considerations make it extremely difficult to give one fixed magnitude at which an item should be considered biased or DIF. Visual inspection of the form of DIF, together with the magnitude of the area between the graphs of the two groups compared, is usually combined to determine whether an item should be flagged as biased.
another range of ability. Figure 3 illustrates an item that shows non-uniform DIF. Of course, the ideal is that there should be little difference between the ICCs of the two groups being compared – as illustrated in Figure 4.
Figure 2: Item showing uniform DIF
Figure 3: Item showing non-uniform DIF
Figure 4: Item showing no DIF
In DIF analysis, the examinee group of interest is referred to as the focal group, while the group with which its performance on the item is being compared is called the reference group. After
calculating the IRT item parameters separately for the two groups, the theta scales are equated (Lord, 1980). The ICCs can then be drawn on the same graph and compared for DIF. If a test item has exactly the same item response function for each group, persons at any given level of ability will have exactly the same probability of getting the item right. This would be true even though one group may have a lower mean theta, and thus lower test scores than the other group (Lord, 1980). The basic approach to the measurement of DIF therefore lies in the difference between the probability of getting an item correct if one is a member of one (focal) group, in contrast with what would have been the probability of a correct response if one were a member of the other (reference) group. An important precondition in DIF is that only examinees with the same ability level are compared with one another (Owen, 1992b).
According to Owen (1992b), the aim of research into item bias is not simply to provide guidelines for identifying and eliminating apparently biased items, but also to identify variables or factors that may be responsible for bias with respect to specific groups. For the current research, the intention was to investigate whether some types of items were more susceptible to DIF by taking into consideration how many items of the three item formats used showed DIF and which group was advantaged in those items that were identified as indicating DIF.
METHOD
During the development of the LPCAT, the three-parameter IRT model was used to analyse items. Items were analysed in terms of classical test theory criteria, IRT item parameter requirements as well as DIF. In the case of the present project, comparison groups based on level of education, gender, culture and language were used.
Sample
DIF analysis was conducted using a sample of 2 554 secondary school pupils from grade 9 and grade 11. The samples were large enough to analyse items by means of the three-parameter IRT model, which is best for analysing multiple-choice items (McBride, 1997). Although item parameters obtained from paper-and-pencil administration may differ from those obtained in computer administration, practical considerations made it impossible to administer LPCAT items by computer for item analysis purposes. However, according to Hetter, Segall and Bloxom (1997), item parameters calibrated from paper-and-pencil administration of items can be used in power CATs of cognitive constructs without changing the construct being assessed and without reducing reliability.
In IRT, the population used for determining the item parameters requires that a group roughly comparable to the target population be used in order to obtain accurate estimation of item parameters (Green, Bock, Humphreys, Linn & Reckase, 1984). This sample forms the norm group against whose general performance eventual test scores are interpreted. Psychological test norms are based on the test performance of individuals of the standardisation sample – hence the need to obtain a sample that is representative of the population for which the test is designed. Although only three of the 10 provinces were included in the item analysis sample, there is no reason to believe that the pupils in these provinces are any different from those in the other provinces.
pupils, half the examinees were boys and half girls. In each grade sample group of 30, Form A and Form B of the test were alternated, thereby ensuring an equal distribution of the two forms between both the gender and the grade groups.
Of the four main cultural groups in South Africa (Black, Indian, Coloured and White), all but the Indian group were included in the paper-and-pencil sample (see Table 1). The reason for the exclusion of the Indian group was threefold. Firstly, they form only 2,5 percent of the South African population (CSS, 1996). Secondly, in cognitive test performance as well as in socioeconomic status and educational attainment, they are very similar to the white group (CSS, 1996). Thirdly, the province with the highest representation of the Indian population was not one of the three provinces included for the item analysis test administration. Indian examinees were later included in the validation of the LPCAT in its computerised format (De Beer, 2000b).
TABLE1 ITEM ANALYSIS SAMPLE
Group Black Coloured White Total
Male 600 300 328 1 228
Female 597 299 330 1 226
Total 1 197 599 658 2 454
Measuring instruments
The present project concerned the investigation of item bias or DIF and the items used were constructed for the development of the LPCAT. A total of 270 new items was constructed – 90 each of the item types figure series, figure analogies and pattern completion, respectively. These items measure fluid ability by means of general non-verbal figural reasoning. The items were aimed at the average to lower-ability levels, although an attempt was made to have items of each of the three types available at all ability levels. Items were checked and face and content validity evaluated by a committee of specialists on cognitive assessment. Changes were then made on the basis of the feedback received. (Construct, concurrent and predictive validity of the final test were investigated in follow-up studies [De Beer, 2000b, 2002]). The number of items that needed to be administered was too large to administer to examinees in a single test session. This necessitated the construction of two paper-and-pencil forms with sufficient anchor items – items answered by both groups – to calculate IRT item parameters on the same scale. A group of 66 anchor items (22 from each of the three item types) was used so that the IRT item parameters for the entire pool of items could be put on the same scale – despite the fact that the items were administered in two forms (De Beer, 2000a, 2000b). These items were administered in paper-and-pencil format for item analysis purposes. Items were analysed by means of classical item analysis, IRT item analysis and DIF analysis in particular. Information from all three approaches was used in the selection of items for the final test item banks (De Beer, 2000b).
Procedure
Items were administered in two groups, each containing the 66 anchor items. Anchor items are used to transform IRT item parameters for the total group of items to the same scale. For classical item analysis, the items in the two forms were used separately, with the result that for the anchor items, two sets of item parameters were available.
Classical test theory item analysis (ITEMAN of MicroCAT – Assessment Systems Corporation, 1995) and the three-parameter IRT item analysis (ASCAL of MicroCAT) were used to calculate the item parameters for the total group. Thereafter, the total sample was divided into various subgroups to investigate DIF for level of education, gender, language groups and cultural groups.
Statistical analysis
The ITEMAN program provides the classical test theory difficulty (p) and discrimination (rit) values for items, while the ASCAL program provides the IRT difficult y (b), discrimination (a) and guessing (c) parameters based on the three-parameter model. Furthermore, the area between the ICC graphs for the different comparison groups was calculated to provide indices for the magnitude of DIF for both uniform and non-uniform DIF items. In the case of non-uniform DIF, the two separate areas were added together, despite the fact that they represented opposing patterns of which group was advantaged at different levels.
RESULTS
The IRT parameters for the total pool of items are given in Table 2.
TABLE2
DESCRIPTIVE STATISTICS OF THE PARAMETERS OF THE ITEMS SUBJECTED TOIRT ANALYSIS
IRT parameters N Mean SD Min Max
a-value 265* 1,435 0,486 0,442 2,500
b-value 265 -0,231 0,829 -1,558 3,000
c-value 265 0,179 0,0853 0,000 0,470
* Five of the 270 items were discarded during IRT item analysis.
In the analysis of the items, particular attention was paid to DIF analysis results for the following comparison groups:
education groups: grade 9 versus grade 11
gender groups: male versus female
culture groups: black versus white
language groups: African language versus English/ Afrikaans
The education group comparison was included since the LPCAT was intended to measure learning potential and formal level of education should not affect the general reasoning performance measured.
Based on the descriptive values of the resulting areas between ICC graphs for all items for the four comparison groups respectively (see Table 3), as well as visual inspection, a cutoff of 0,5 was determined for flagging items as DIF. This is also in line with values used by other researchers (Kanjee & Van Eeden, 1998). An item was flagged as showing DIF, if on any one or more of the four indices obtained from the DIF analysis of the four comparison groups, the magnitude of the area between the two graphs exceeded the value of 0,5.
TABLE3
DESCRIPTIVE STATISTICS IN RESPECT OF THEDIF AREAS BETWEEN ICCS FOR DIFFERENT COMPARISON GROUPS– ALL ITEMS INCLUDED
DIF comparison groups N Mean SD Min Max
Grade groups 265 0,1789 0,1471 0,0025 1,2338 (grade 9 versus grade 11)
Gender groups 265 0,1672 0,1616 0,0089 1,4375 (male versus female)
Culture groups 265 0,3307 0,2081 0,0254 1,4050 (Black versus white)
Language groups 265 0,2336 0,1570 0,0083 0,9762 (African versus
Using the total group of items developed, on average, more DIF was evident in respect of the culture and language groups than for the gender and education groups. Of the 270 new items that were analysed, 82 were discarded on the basis of various factors. Five items were discarded during the IRT analysis and another 77 on the strength of the psychometric and DIF results. Items were discarded on the basis of the following criteria:
IRT: c-values: c > 0,3
IRT: a-values: a < 0,80
CTT: rit < 0,3 unless IRT a > 1,0
DIF: area between the ICCs of any of the four DIF comparison groups > 0,5
The remaining 188 items which met the criteria set for inclusion, were included in the final test.
Table 4 provides a summary of the items that were discarded and the reasons for this.
TABLE4
ITEMS DISCARDED AND REASONS FOR THEIR BEING DISCARDED
Procedure Figure Figure PatternTotal series analogies completion
Item analysis 17 15 15 47
(IRT & CTT)
Bias analysis 8 17 10 35
TOTAL 25 32 25 82
REJECTION CATEGORIES
IRT a < 0,8 4 4 10 18
IRT c > 0,3 11 6 0 17
Education DIF 0 0 1 1
Gender DIF 0 0 0 0
Culture DIF 4 12 6 22
Language DIF 2 0 1 3
DIF for 2+ groups 2 4 2 8
IRT and DIF 2 4 2 8
The pattern of DIF indicates that more figure analogy items (N=32) were flagged as indicating DIF than for the other two item types (figure series [N=25] and pattern completion [N=25]). Considering only the discarded figure analogy items, more than one-third showed DIF when the culture groups were compared. Despite the content of the items having been chosen because it was considered to be the least subject to cultural influence, culture nevertheless seemed to play a major role in DIF. It should be kept in mind that the direction of DIF is not considered here – and from Tables 5 and 6 it can be seen that in respect of the discarded items, more favoured the black than the white group. Some could argue, that in a country such as South Africa, where the black group is clearly identified as the disadvantaged group, one might even consider including items that show DIF if it is the black group being favoured. However, in the case of the LPCAT items, for the sake of transparency, it was decided to use the same cut-off for all items, irrespective of which group was being advantaged or disadvantaged.
In Tables 5 and 6, summaries of the direction of DIF for included and discarded items are provided. There are some surprising results in respect of the discarded items. Firstly, in the grade group category, more discarded items favoured the grade 9 group than the those favouring the grade 11 group. In the gender comparison, in the discarded items, more favoured the female than the male group, while in the language group comparison, more of the discarded items favoured the African
compared with the English/Afrikaans language group. For the culture and language groups, these patterns were somewhat reversed in the group of items that were included (not discarded), although one should keep in mind that the amount of DIF for these items was not large enough to be flagged as DIF to merit being discarded.
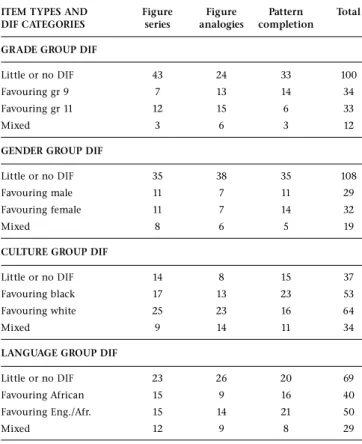
TABLE5
DIRECTION OFDIF FOR INCLUDED ITEMS(N=188)
ITEM TYPES AND Figure Figure Pattern Total DIF CATEGORIES series analogies completion
GRADE GROUP DIF
Little or no DIF 43 24 33 100
Favouring gr 9 7 13 14 34
Favouring gr 11 12 15 6 33
Mixed 3 6 3 12
GENDER GROUP DIF
Little or no DIF 35 38 35 108
Favouring male 11 7 11 29
Favouring female 11 7 14 32
Mixed 8 6 5 19
CULTURE GROUP DIF
Little or no DIF 14 8 15 37
Favouring black 17 13 23 53
Favouring white 25 23 16 64
Mixed 9 14 11 34
LANGUAGE GROUP DIF
Little or no DIF 23 26 20 69
Favouring African 15 9 16 40
Favouring Eng./Afr. 15 14 21 50
Mixed 12 9 8 29
TABLE6
DIRECTION OFDIF FOR DISCARDED ITEMS(N=77)
ITEM TYPES AND Figure Figure Pattern Total DIF CATEGORIES series analogies completion
EDUCATION GROUP DIF
Little or no DIF 13 12 8 33
Favouring gr 9 8 8 6 22
Favouring gr 11 1 5 4 10
Mixed 3 5 4 12
GENDER GROUP DIF
Little or no DIF 13 22 11 46
Favouring male 2 4 1 7
Favouring female 8 2 8 18
Mixed 2 2 2 6
CULTURE GROUP DIF
Little or no DIF 3 2 3 8
Favouring black 7 15 14 36
Favouring white 9 12 2 23
Mixed 6 1 3 10
LANGUAGE GROUP DIF
Little or no DIF 9 7 3 19
Favouring African 7 8 11 26
Favouring Eng/Afr 4 8 5 17
DISCUSSION
IRT-based DIF analysis provides useful information for assessing items. The use of this technique will probably increase over time as more researchers become familiar with it. Over time, this will probably change as more researchers start using these techniques.
The fact that approximately one-third (N=82) of the original 270 items were event ually discarded, based on their psychometric properties or because they showed more than the predetermined level of DIF, is in line with the general international findings (McBride, 1997). Researchers and test developers need to make use of the available techniques for DIF analysis to ensure compliance with the requirements set by the Employment Equity Act. The IRT-based DIF methods provide a useful visual representation of item bias which is easily understood. The information obtained in this manner can also be put to good use to identif y patterns of bias, which can again be used as input in future test and test item development.
It is important to recognise that our ultimate interest should lie with the quality of decisions based on the scores obtained from psychological tests since it is at this level where individual lives are affected – fairly or unfairly. After due consideration of DIF during the test development process, differential criterion-related test validity should thus be considered equally if not more important in decisions about the utility of psychological tests used.
REFERENCES
Assessment Systems Corporation. (1995). User’s manual for the MicroCAT testing system (Version 3.5). St Paul: Assessment Systems Corporation.
Baker, F.B. (1985). The basics of item response theory. Portsmouth, NH: Heinemann.
Claassen, N.C.W. (1997). Cultural differences, politics and test bias in South Africa. European Review of Applied Psychology,
47(4), 297-307.
Central Statistical Service of South Africa (1996). Census in Brief – Report number 1:03-01-11 (1996). Pretoria: Central Statistical Service.
De Beer, M. (2000a). Learning Potential Computerised Adaptive Test (LPCAT): User’s Manual. Pretoria: Unisa Press.
De Beer, M. (2000b). Learning Potential Computerised Adaptive Test (LPCAT): Technical Manual. Pretoria: Unisa Press. De Beer, M. (2002). Utility of Learning Potential Computerised
Adaptive Test (LPCAT) scores in predicting academic performance of bridging students: A comparison with other predictors. Paper presented at the 5th Annual Industrial Psychology Conference, Pretoria, CSIR, 13-14 June 2002. Embretson, S.E. (1996). The new rules of measurement.
Psychological Assessment, 8(4), 341-349.
Employment Equity Act, No 55 (1998). Government Gazette, 400 (19370). Cape Town, 19 October 1998.
Ertuby, C. & Russel, R.J.H. (1996). Dealing with comparability problem of cross-cultural data. Paper presented at the 26th International Congress of Psychology, Montreal, 16-21 August 1996.
Foxcroft, C.D. (1997). Psychological testing in South Africa: Perspectives regarding ethical and fair practices. European Journal of Psychological Assessment, 13(3), 229-235.
Green, B.F., Bock, R.D., Humphreys, L.G., Linn, R.L. & Reckase, M.D. (1984). Technical guidelines for assessing computerized adaptive tests. Journal of Educational Measurement, 21 (4), 347-360.
Hambleton, R.K. (1994). Guidelines for adapting educational and psychological tests: A progress report. European Journal of Psychological Assessment, 10(3), 229-244.
Hambleton, R.K. & Slater, S.C. (1997). Item response theory models and testing practices: Current international status and future directions. European Journal of Psychological Assessment, 13(1), 21-28.
Hambleton, R.K. & Swaminathan, H. (1985). Item response theory: Principles and applications. Boston: Kluwer-Nijhof Publishing.
Health Professions Council of South Africa. (1998). Policy on the classification of psychometric masuring devices, instruments, methods and techniques. Pretoria: HPCSA.
Hetter, R.D., Segall, D.O. & Bloxom, B.M. (1997). Evaluating item calibration medium in computerized adaptive testing. In W.A. Sands, B.K. Waters & J.R. McBride (Eds), Computerized adaptive testing: From inquiry to operation (pp. 161-168). Washington, DC: American Psychological Association. Kanjee, A. & Van Eeden, R. (1998). Item response theory and
measurement equivalence in personality assessment of a South African sample. Paper presented at the XIVth IACCP international Congress, Bellingham, 4 August 1998. Lord, F.M. (1980). Applications of item response theory to practical
testing problems. Hillsdale, NJ: Lawrence Erlbaum Associates. McBride, J.R. (1997). Technical perspective. In W.A. Sands, B.K.
Waters & J.R. McBride (Eds), Computerized adaptive testing: From inquiry to operation (pp. 29-44). Washington, DC: American Psychological Association.
Osterlind, S.J. (1983). Test item bias. Beverly Hills: Sage. Owen, K. (1992a). The suitability of Raven’s Standard
Progressive Matrices for various groups in South Africa.
Personality and Individual Differences, 13(2), 149-159. Owen, K. (1992b). Test-item bias: Methods, findings and
recommendations. Pretoria: Human Sciences Research
Council.
Owen, K. (1998). The role of psychological tests in education in South Africa: Issues, controversies and benefits. Pretoria: Human Sciences Research Council.
Owen, K. & Taljaard, J.J. (1996). Handbook for the use of psychological and scholastic tests of the HSRC. Pretoria: Human Sciences Research Council.
Reckase, M.D. (1996). Test construction in the 1990s: Recent approaches every psychologist should know. Psychological Assessment, 8(4), 354-359.
Shuttleworth-Jordan, A.B. (1996). On not reinventing the wheel: A clinical perspective on culturally relevant test usage in South Africa. South African Journal of Psychology, 26(2), 96-102.
Van de Vijver, F. (1998). Multicultural assessment: How suitable are Western tests? European Journal of Psychological Assessment, 14(1), 61.
Van de Vijver, F. & Poortinga, Y.H. (1997). Towards an integrated analysis of bias in cross-cultural assessment. European Journal of Psychological Assessment, 13(1), 29-37.
Van Zyl, E. & Visser, D. (1998). Differential item functioning in the figure classification test. Journal of Industrial Psychology,
24(2), 25-33.
Verster, J.M. & Prinsloo, R.J. (1988). The diminishing test performance gap between English speakers and Afrikaans speakers in South Africa. In S.H. Irvine & J.W. Berry (Eds),
Human abilities in cultural context(pp. 534-560). Cambridge: Cambridge University Press.
Warm, T.A. (1978). A primer of item response theory (Technical Report 941078). Oklahoma City, OK: US Coast Guard Institute.