Sharif University of Technology
Scientia IranicaTransactions C: Chemistry and Chemical Engineering http://scientiairanica.sharif.edu
A hybrid model of multi-objective dierential evolution
algorithm and various decision-making methods to
optimize the batch ABE fermentation process
M.H. Khademi
a;and S. Zandi Lak
ba. Department of Chemical Engineering, Faculty of Engineering, University of Isfahan, Isfahan, P.O. Box 81746-73441, Iran. b. Department of Chemical Engineering, Shiraz Branch, Islamic Azad University, Shiraz, P.O. Box 71987-74731, Iran. Received 12 February 2018; received in revised form 13 December 2018; accepted 28 September 2019
KEYWORDS ABE fermentation; Clostridium acetobutylicum; Optimization; Multi-objective dierential evolution; Decision-making method.
Abstract. In recent years, biofuels have attracted considerable attention as a renewable and clean source of energy and have been playing the role of suitable alternatives to fossil fuels. One of the most attractive types of biofuels is Acetone-Butanol-Ethanol (ABE), which is produced in a batch fermentation process by the anaerobic bacterium Clostridium acetobutylicum and sugar-based substrate as feedstock. In this paper, the optimization of this process was carried out according to a bi-objective function. A hybrid model of Multi-Objective Dierential Evolution (MODE) algorithm and distinguished decision-making methods, namely linear programming technique for multidimensional analysis of preference (LINMAP), Technique for Order of Preference by Similarity to Ideal Solution (TOPSIS), and Shannon's entropy, were applied to nd the nal optimal operating point. The initial concentration of substrate and the nal operating time of the process were selected as decision variables to maximize the two main objectives in terms of solvent yield and productivity. A Pareto optimal set presents a wide range of optimal operating points, and a proper operating condition can be selected based on the necessities of the applicant. The best optimal point obtained by TOPSIS, according to the lowest value of deviation index, was also compared with the results of the economy-based optimization.
© 2019 Sharif University of Technology. All rights reserved.
1. Introduction
Due to the rapid depletion of fossil fuel resources and the serious concerns over environmental pollution resulting from petroleum fuel emissions, the demand for biofuels is rising. Biobutanol is a valuable biofuel that can be used as a direct substitution of gasoline or as a fuel additive. Besides, butanol is used as a solvent in chemical industries and as an intermediate in
chem-*. Corresponding author. Tel.: +98 31 37934075 Fax: +98 31 37934031
E-mail address: [email protected] (M.H. Khademi) doi: 10.24200/sci.2019.50419.1697
ical synthesis and pharmaceutical manufacturing. In recent years, due to the increasing petroleum prices and energy requirement, cheaper separation technology, and growing demand for renewable energy resources, the ABE fermentation process as a common way to produce butanol has been taken into account [1].
ABE can be synthesized biologically by the anaer-obic bacterium Clostridium acetobutylicum and pro-duces three solvents (acetone, butanol, and ethanol), two intermediate metabolites (butyric acid and acetic acid), and two gases (carbon dioxide and hydrogen) [2]. In the ABE bioreactor, the substrate is the glucose syrup. The metabolic pathway of ABE production is divided into two separate phases: acidogenesis and solventogenesis. During the acidogenesis phase, the
bacterial culture mainly produces butyric and acetic acids and, during the solventogenic phase, acetic and butyric acids are converted to acetone and butanol, respectively [3].
To improve the performance of the ABE process, it is required to implement the process under opti-mal conditions by considering economic feasibility and safety. Several research studies have been conducted on the optimization of the ABE fermentation process for high butanol production. These studies can be divided into two categories: mathematical model-based opti-mization and experimental design-based optiopti-mization. Extensive studies have been performed on the optimization of the ABE process in the fed batch and continuous reactors based on the mathematical model, which are presented as follows. Dynamic optimization of the semi-batch ABE fermentation with in situ per-vaporation membrane separation was accomplished by Lin and Lee [4] to determine the optimal feeding prole through time. Sandu et al. [5] selected the substrate concentration, the inoculum volume, and the feed ow rate as decision variables to maximize the production of solvents in the ABE fed-batch biosynthesis. Grisales-Diaz and Olivar-Tost [6] optimized economically a process involving simultaneous saccharication, ABE fermentation from lignocellulose, and detoxication by liquid-liquid extraction using a simplex search method. Elmeligya et al. [7] proposed an articial neural network as a metamodel for optimizing the biobutanol production process via the integrated ABE fermentation-membrane pervaporation process. Kim et al. [8,9] suggested a model-based optimization strat-egy for the ABE fermentation process coupled with an ex-situ recovery system with periodically switched adsorption column for continuous biobutanol produc-tion. The Sequential Quadratic Programming (SQP) algorithm was used to search the optimal operating conditions, leading to the most protable cyclic steady state. Mariano et al. [10,11] performed a dynamic optimization for the continuous ABE fermentation process containing a fermentor, a cell retention system, and a vacuum ash vessel to maximize the butanol productivity using Particle Swarm Optimization (PSO) and SQP algorithms. Sharma and Rangaiah [12] optimized a three-stage fermentation process, which is integrated with cell recycling and inter-stage extraction for ethanol productivity and xylose conversion using MODE algorithm. Sharif Rohani [13] implemented the multi-objective optimization for the ABE continuous process coupled with an in situ separation unit, namely vacuum fermentation, gas stripping, and pervapora-tion, to determine the optimal operating conditions. The butanol specic productivity, average butanol concentration, and sugar conversion were selected as objective functions. The Pareto-optimal solutions obtained by Genetic Algorithm (GA) were ranked by
the Net Flow Method (NFM) to nd the best point. Generally, the experimental design-based opti-mization (second category) was carried out by sev-eral researchers using Response Surface Methodol-ogy (RSM) [14,15]. Wang and Blascheck [16] per-formed batch experiments by Central Composite De-sign (CCD) [15] and RSM optimization to evaluate the eect of initial glucose concentration, agitation rate, and PH on butanol production. YouSheng et al. [17] optimized experimental conditions for the production of butanol in a batch bioreactor based on enzymatic hydrolysis of corn stalk by adopting Plackett-Burman Design (PBD) [18] and CCD to screen the key factors. Singh et al. [19] used PBD and RSM methodology to optimize fermentation medium for enhancing butanol production from glucose by Clostridium beijerenckii strain CHTa. Optimization of the ABE batch process parameters containing acid concentration, tempera-ture, incubation time, algal hydrolysate concentration, inoculum size, and initial pH was carried out by Dubey et al. [20] to enhance biobutanol production from Sargassum wightii hydrolysate. Kumar et al. [21] suggested the utilization of the agro residue corncob for the production of the ABE using Clostridium aceto-butylicum and optimized this batch bioreactor through RSM. Zheng et al. [22] enhanced the ABE production from eucalyptus hydrolysate with optimized nutrient supplementation containing FeSO4.7H2O, tryptone,
and yeast extract through statistical experimental de-signs. Al-Shorgani et al. [23-25] used PBD to optimize the batch ABE culture conditions in order to screen the most signicant factors aecting the biobutanol production by various anaerobic bacteria. Recently, Khunchantuek and Fiala [26] and Sirisantimethakom et al. [27] investigated the optimization of the various key factors aecting butanol production from sugarcane juice and sweet sorghum stem juice, respectively, by Clostridium beijerinckii TISTR 1461 using RSM.
Continuous and fed-batch cultures are alterna-tives for the ABE process, yet with their own intrinsic disadvantages. The ABE fermentation was imple-mented widely in the batch reactor during its commer-cial production years. The batch fermentation is easier to operate and less likely to be contaminated [28]. Ac-cording to the content mentioned in the previous para-graph, all studies on the optimization of the ABE batch process are based on the experimental design. To the best knowledge of the authors, this is the rst time the optimization of the ABE batch fermentation process has been conducted based on a mathematical model. In this regard, it is essential to assess the response of optimization techniques for the ABE fermentation process, which can be a very eective tool in the search for economic feasibility of the ABE fermentation plants by operating under optimal conditions.
algo-Table 1. The kinetic rates for the batch ABE fermentation process proposed by Votruba et al. [2].
Equation Denition
rX= (y (t) 1) CX(t) k2CX(t) CB(t) Rate of biomass growth
rS= k3CS(t) CX(t) k4ksC+CS(t)S(t)CX(t) Rate of substrate utilization
rBA= k5CS(t)kI+CkIB(t)CX(t) k6kBAC+CBABA(t)(t)CX(t) Rate of butyric acid production
rB= k7CS(t) CX(t) 0:841rBA Rate of butanol production
rAA= k8kSC+CS(t)S(t)kI+CkIB(t)CX(t) k9kAAC+CAAAA(t)(t)kSC+CS(t)S(t)CX(t) Rate of acetic acid production
rA= k10kSC+CS(t)S(t)CX(t) 0:484rAA Rate of acetone production
rE= k11kSC+CS(t)S(t)CX(t) Rate of ethanol production
rCO2 = k12kSC+CS(t)S(t)CX(t) Rate of carbon dioxide production
rH2= k13kSC+CS(t)S(t)CX(t) + k14CS(t) CX(t) Rate of hydrogen production
rithm for solving optimization problems was proposed by Storn and Price [29] for the rst time. The DE method is a stochastic optimization algorithm for minimizing an objective function subject to a number of linear or nonlinear constraints. DE has been success-fully used by several researchers such as Babu et al. [30-32] and Khademi et al. [33-36] in various elds. After that, MODE algorithm, as an extended DE method, proposed by Babu et al. [37] has been successfully used to handle multi-objective optimization problems.
In this paper, a dynamic mathematical model is considered for the ABE batch fermentation process. The model is implemented with the aim of identifying important parameters containing an initial concen-tration of substrate and operating time aecting the biosynthesis of products in the fermentation process. A study on the optimization of ABE fermentation process is carried out according to two categories: (1) A multi-objective optimization using the MODE algorithm as an exceptionally simple evolution strategy. In this way, an optimum value is selected from the Pareto-optimal front using a set of decision-making tools, namely TOPSIS [38], LINMAP [39], and Shannon's entropy [40] methods, based on deviation index, and (2) An economy-based optimization using the DE algorithm.
2. Mathematical model
The mathematical model represents the biochemical kinetics and culture-related physiological aspects of the batch ABE fermentation process. The kinetic model used in this study was developed by Votruba et al. [2] based on the following assumptions: (i) There are no culture restrictions by phosphate, ni-trogen, trace elements, and growth factors; (ii) Sugar (glucose) is the only limiting substrate in the batch fermentation process. The mathematical modeling accomplished by other researchers such as Yerushalmi et al. [41,42], Mulchandani and Volesky [43], Srivastava
Table 2. Constants for the kinetic model proposed by Votruba et al. [2].
Parameter Value Unit
k1 0.0090 L/g substrate.h.
k2 0.0008 L/g butanol.h
k3 0.0255 L/g biomass.h
k4 0.6764 g substrate/g biomass.h
k5 0.0136 g butyric acid
L/g substrate g biomass h k6 0.1170 g butyric acid/g biomass. H
k7 0.0113
g butanol L/g substrate g biomass H
k8 0.7150 g acetic acid/g biomass.h
k9 0.1350 g acetic acid/g biomass.h
k10 0.1558 g aceton/g biomass.h
k11 0.0258 g ethanol/g biomass.h
k12 0.6139 g CO2/g biomass.h
k13 0.0185 g H2/g biomass.h
k14 0.00013 g H2.L/g substrate.g biomass.h
kI 0.833 g butanol/L
kS 2.0 g substrate/L
kAA 0.5 g acetic acid/L
kBA 0.5 g butyric acid/L
0.56 {
and Volesky [44], and Sandu et al. [5] is on the basis of the kinetic model proposed by Votruba et al. [2].
The kinetic rates for the batch culture are sum-marized in Table 1. These equations represent ki-netic rates for the biomass, substrate, intermediate compounds, and key products (acetone, butanol, and ethanol). The constants that appear in kinetics expres-sions are tabulated in Table 2.
A hyperbolic relation for product inhibition and a linear relation of the culture physiological state (y) with respect to substrate concentration are added to this model. Variation of y versus time was reported by
Votruba et al. [2] as follows: dy(t)
dt =
k1CS(t)k kI
I+ CB(t) (y(t) 1)
y(t): (1) A dierential mass balance equation to describe the dynamic of the process is expressed as follows:
dCi(t)
dt = ri(t); (2)
where i denotes biomass (X), glucose (S), butanol (B), acetone (A), ethanol (E), Butyric Acid (BA), Acetic Acid (AA), carbon dioxide (CO2), and hydrogen (H2).
3. Optimization
3.1. Dierential evolution algorithm
Dierential Evolution (DE) is an eective intelli-gent optimization algorithm and a population-based stochastic search method. This technique has been pre-sented as an ecient, fast, robust, and simple method for stochastic global optimization. The main algorithm of DE can be found in the literature [37,45], and it consists of a four-step procedure: (1) random choice of an initial population vector, (2) mutation/perturbation (3) crossover/recombination, and (4) selection. 3.2. Various strategies of DE
The DE algorithm can support various strategies de-pending on the specic problem applied. Related strategies can be dierent based on the vector to be mutated, the number of dierence vectors selected for mutation, and nally the pattern of the recombination used. Ten various strategies with the symbolic form DE=x=y=z were designed by Price and Storn [46]. DE stands for dierential evolution, x denotes the vector to be mutated that can be the best member of the previous population or can be selected at random (best or rand, respectively), y represents the number of dierence vectors for mutation of x (1 or 2), and z stands for the type of the recombination used (exp: exponential; or bin: binomial). In this study, DE/best/1/bin strategy is used due to its simple form and performance.
3.3. Choosing DE parameters
Some general instructions are available for selecting the crucial parameters such as crossover probability constant (CR), population size (NP), and scaling factor (F) that aect the performance of DE. Mostly, popu-lation size must be roughly 5-10 times the number of decision variables [30]. F is situated in the domain of 0.4 to 1.0. At rst, a scaling factor equal to 0.5 can be tested; then, F and/or NP increase(s) if the population converges before the usual time. Moreover, CR should be in the range of 0.1 to 1.0 [30]. More aspects of the pseudo-code of DE, its strategies, and the parameters
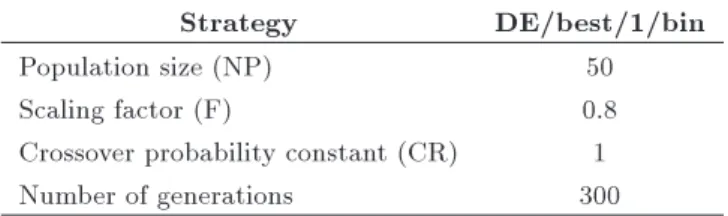
Table 3. Strategy and parameters applied to DE.
Strategy DE/best/1/bin
Population size (NP) 50
Scaling factor (F) 0.8
Crossover probability constant (CR) 1
Number of generations 300
were published by Babu and Munawar [30] and Babu and Angira [31,32]. In the present work, the strategy and parameters used for DE are presented in Table 3. 3.4. Multi-Objective Dierential Evolution
(MODE)
Simultaneous optimization of several objectives can be performed by either a single-objective function, in which a weighted average is used for a combination of the individual objectives (known as the weighted-sum method) or multi-objective functions capable of supporting the simultaneous optimization of two or more incompatible objectives [47]. Such objective functions are often in conict with each other. The trade-o between multiple objectives creates a set of optimal solutions, namely \Pareto-set". The MODE, which is an extension of DE, is used to solve the multi-objective optimization problems.
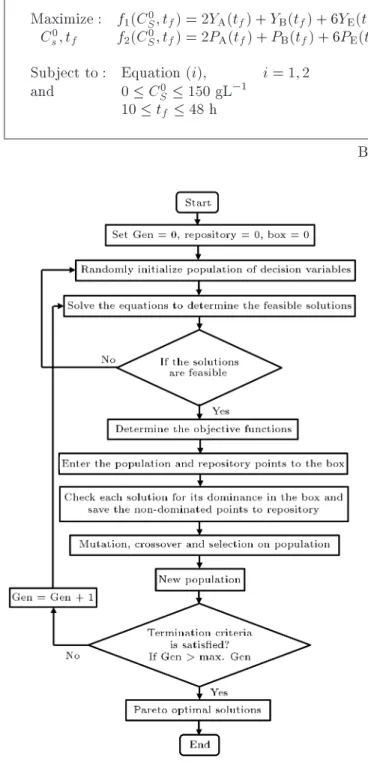
Figure 1 presents the steps involved in the MODE algorithm. The algorithm can be summarized as follows: An initial population is randomly generated in the feasible region. All dominated points are eliminated from the population. The rest of the non-dominated points are maintained for crossover and are allowed to undergo DE operations. Three parent vectors are randomly chosen. A child vector is created from the three-parent vectors and is put into the population if it dominates the rst parent vector; otherwise, a new selection process has been accomplished [45]. The termination criterion of this procedure is an assigned number of generations. A detailed representation of MODE algorithm using DE approach and the general pseudo-code for MODE can be found in the litera-ture [37,48].
3.5. Optimization problem formulation
In this study, two types of the optimization problem are considered: multi-objective optimization and economy-based optimization. In the economy-economy-based optimiza-tion, practically, the value of a bio-species can vary signicantly, sometimes from one to ten-fold, depend-ing on the economical evaluation methods. Therefore, the results of the economy-based optimization severely depend on the value of species over time. Instead, a multi-objective optimization considerably increases the role of a decision-maker to select the optimal point from the Pareto-set, and its results do not change over the
Maximize : f1(C0
S; tf) = 2YA(tf) + YB(tf) + 6YE(tf) C0
s; tf f2(CS0; tf) = 2PA(tf) + PB(tf) + 6PE(tf) Subject to : Equation (i); i = 1; 2
and 0 C0
S 150 gL 1 10 tf 48 h
(3) Box I
Figure 1. Flowchart of the MODE algorithm.
years. Nevertheless, both optimizations are performed and their results are compared together.
3.5.1. Bi-objective optimization
In this process, 6 variables including yield and pro-ductivity of acetone, butanol, and ethanol can be considered as objective functions; however, since it is dicult to discuss and visualize the optimal results of 6 objectives, the number of objectives is reduced to 2 by weighting. The weighted-sum method is applied to each function. A general form of this constrained
optimization problem is obtained by Eq. (3) as shown in Box I.
The 3:6:1 solvent concentration ratio of acetone, butanol, and ethanol is commonly observed at the nal stage of the batch ABE fermentation process by C. acetobutylicum [3,49]. In other words, CB=CE= 6 and
CB=CA= 2. Therefore, the objective functions f1 and
f2 are considered, i.e., the summation of the solvent
yield and productivity with weighting factors of 2, 1, and 6 for acetone, butanol, and ethanol to equalize the orders of the magnitude of each term. Eqs. (1) and (2) and the kinetic rates represented in Table 1 are the equality constraints of this problem.
Two decision variables including the initial con-centration of substrate, C0
s, and nal operating time
of batch fermentation process, tf, are considered for
maximizing these two objective functions. Since C0 s
is an important parameter and has a direct eect on the solvent yield, this variable is chosen as a decision variable. The range of this parameter is selected based on the information in the literature [2,50]. Functional relationships presented by Votruba et al. [2] for the batch ABE fermentation are reliable for the glucose concentration in the range of 0-50 gL 1. Moreover,
butanol production was studied by Nanda et al. [50] with glucose as a control substrate at levels varying from 50-150 gL 1. Therefore, an upper bound of
150 gL 1 is chosen for the initial concentration of
substrate.
In order to allow for cell growth and solvent production, fermentation time was set to 48 h. In the incomplete fermentation of ABE, the process was allowed to proceed for another 48 h. No further changes were observed during this additional time, as reported by Yerushalmi and Volesky [51]. Therefore, the upper bound of the nal operating time is set to 48 h. The lower bound for the nal operating time has been selected with no prior intention.
3.5.2. Prot function
A simplied prot function is considered as a single-objective function for the economy-based optimization of the batch biological reactor. This constrained optimization problem is generally formulated obtained by Eq. (4) as shown in Box II, where NA is the
Maximize: C0
s; tf Prot(C 0
S; tf) = 10 3
365 24 tf+ tc
CA(tf)NA+ CB(tf)NB+ CE(tf)NE (C0
S CS(tf))NS
US$L 1year 1 Subject to : Equation (i); i = 1; 2;
and : 0 C0
S 150 gL 1 10 tf 48 h;
(4) Box II
price of acetone (=US$0.38 kg 1), N
B is the price of
butanol (=US$0.34 kg 1), N
E is the price of ethanol
(=US$0.28 kg 1), N
S is the price of glucose. Economic
calculation is carried out based on the production of ABE from corn. The prices of corn, acetone, ethanol, and butanol are the same as those assumed by Qureshi and Blaschek [52]. Corn of 5:14 108 kg (moisture
14%) will result in 3:65 108 kg glucose; in addition,
the price of corn is considered US$0.07923 kg 1 [52].
Therefore, the price of glucose is US$0.111 kg 1. Of
note, the prot function does not include the cleaning cost in each cycle, bacterial culture and nutrition costs, and separation costs in the separation of by-products (acetic acid and butyric acid) from the ABE and unreacted materials.
4. Decision-making method
The process of decision-making is necessary for se-lecting the best optimal solution from available points located at Pareto-set. In this research, three decision-making approaches including LINMAP, TOPSIS, and Shannon's entropy are used. Before implementing any decision-making process, it is compulsory to unify the scale and dimension of all the objectives by one of the Euclidean, linear, or fuzzy non-dimensioned methods [53].
4.1. Euclidian approach
In this study, the solvent yield has no unit while the unit of solvent productivity is gL 1 h 1. The
non-dimensionalized Euclidean approach is applied to unify the dimension of these objective functions as follows [53]:
Fkj= qP fkj m
k=1(fkj)2
j = 1; 2; (5)
where Fkj is the element of non-dimensionalized
ob-jective matrix, fkj is the element of the objectives
matrix at various optimal solutions of the Pareto-optimal front, k is the index of various points on Pareto front, m is the total number of points on Pareto front, and j stands for the index of each objective.
4.2. LINMAP method
In the multi-objective optimization, the ideal solution does not lie on the Pareto-set. An ideal solution is a point that optimizes each objective regardless of other objectives. In the LINMAP decision-making approach, the Euclidian distance of each solution on the Pareto-set from the ideal solution, Dideal
k , is computed as
follows: Dideal
k =
q
(Fk1 F1ideal)2+ (Fk2 F2ideal)2; (6)
where Fideal
1 and F2ideal are the ideal solutions for f1
and f2. In the LINMAP approach, the point with
minimum distance from the ideal solution is chosen as a desired ultimate solution [54]; therefore, knal =
arg mink(Didealk ):
4.3. TOPSIS method
In the TOPSIS decision-making approach, a non-ideal solution in addition to the ideal solution is considered.
Dk = D
non ideal k
Dideal
k + Dnon idealk
; (7)
Dnon ideal
k =
q
(Fk1 F1non ideal)2+ (Fk2 F2non ideal)2; (8)
where Dnon ideal
k is the Euclidian distance between
each point and non-ideal solution, and Fnon ideal
1 and
Fnon ideal
2 are the non-ideal solutions for f1 and f2,
respectively. The TOPSIS approach computes the nal solution on Pareto front with maximum Dk [55];
therefore, knal= arg maxk(Dk).
4.4. Shannon's entropy method
Shannon's entropy method is established based on the weight of each objective function. The linear normalization of the jth objective for the kth point, Lkj, is evaluated as follows:
Lkj= PmFkj k=1Fkj
k = 1; 2; : : : ; m j = 1; 2; (9)
DDj= 1 +
Pm
k=1Lkjln Lkj
Wj= P2DDj j=1DDj
; (11)
Skj= WjLkj: (12)
Shannon's entropy decision-making approach com-putes the nal desired optimal solution on Pareto-set based on the maximum Sk [40]; hence, knal =
arg maxk(Skj).
4.5. Deviation index
A criterion for selecting a nal optimal solution from the optimum points obtained by LINMAP, TOPSIS, and Shannon's entropy decision-making methods is `Deviation Index' (DI). The deviation index of opti-mal outcome with respect to the ideal and non-ideal solutions can be given as follows:
DIi 1=
q (Fi
1 F1ideal)2+ (F2i F2ideal)2; (13)
DIi 2=
q (Fi
1 F1non ideal)2+(F2i F2non ideal)2; (14)
DIi = DIi1
DIi 1+ DIi2
i = 1; 2; 3; (15)
where DIi represents the deviation index of optimal
point for the ith decision-making approach (i = 1; 2, and 3 denote the LINMAP, TOPSIS, and Shannon's entropy decision-making methods, respectively). The nal optimal solution from the Pareto-set and the more appropriate decision-making technique is recognized with the lowest value of the deviation index [56]; therefore, inal= arg mini(DIi).
5. Numerical solution
The mathematical model of the batch culture con-sisting of 10 Ordinary Dierential Equations (ODEs) (see Eqs. (1) and (2), as well as Table 1) and the relevant initial conditions generated an initial value problem. The initial conditions are C0
X = 0:03 gL 1,
C0
S = 50 gL 1, and y0= 1; the concentration of other
components is equal to zero. The ODEs with the initial conditions are simultaneously solved by the Runge-Kutta method of the fourth order in the MATLAB programming environment.
6. Results and discussion
In this section, dynamic behavior and eect of the initial substrate concentration on the performance of the batch bioreactor are investigated. The performance of the bioreactor is analyzed in terms of solvent yield, substrate conversion, and solvent productivity as fol-lows:
Solvent yield = Csolvent(t) C0
S ; (16)
Substrate conversion = CS0 CS(t)
C0
S ; (17)
Solvent productivity = Fermentation timeCsolvent(t) : (18) 6.1. Model validation
In Figure 2, the mathematical model is validated against the experimental data reported by Votruba et al. [2]. This validation is carried out for the solvents, sugar, and biomass concentrations. It is observed in Figure 2 that the batch model agrees well with the experimental data.
6.2. Eect of the initial concentration of substrate
Figure 3(a) and (b) show the eect of the initial con-centrations of substrate 25, 50, 100, and 150 gL 1 on
the butanol and acetone yield, respectively, at various operating times. At a constant initial concentration of substrate, the solvent yield increases until the reaction rate approaches zero. According to Figure 3(a), in-creasing the initial concentration of substrate from 25 to 150 gL 1 leads to an increase in the butanol yield
from 0.16 to 0.31 (nearly two folds) in the stationary non-equilibrium state. The increasing rate of butanol yield increases rapidly with an initial concentration of substrate. As seen in Figure 3(b), the acetone yield in the stationary non-equilibrium state increases to reach a certain value and, then, begins to decrease as a result of increasing the initial concentration of glucose from 25 to 150 gL 1. This could be due to butanol
inhibition/toxicity and, also, the inhibitory eect of the substrate. Behavior similar to the trend of acetone yield occurs for the ethanol yield at dierent initial concentrations of substrate. Therefore, C0
S has a large
Figure 2. Comparison between simulation results (solid lines) and experimental data (marker) reported by Votruba et al. [2] for C0
Figure 3. Eect of the initial concentration of substrate on the (a) butanol yield and (b) acetone yield at various operating times.
eect on the solvent yield and must stay on the list of optimization parameters.
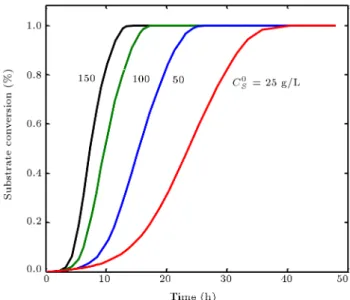
Figure 4 represents the time variations of sub-strate conversion at the initial subsub-strate concentra-tions of substrate 25, 50, 100, and 150 gL 1. At a
given initial concentration of glucose, the substrate conversion increases during the operating time and, then, reaches the stationary non-equilibrium state. Increasing the initial concentration of substrate shifts the S-shaped conversion prole to the left. This trend also occurs for the prole of solvent yield (see Figure 3). The system approaches the stationary non-equilibrium state after 40, 25, 18, and 15 h at C0
S = 25, 50, 100,
and 150 gL 1, respectively. Therefore, increasing the
initial substrate concentration leads to a decrease in the time to the stationary non-equilibrium state. Finally, in the stationary non-equilibrium state, the substrate conversion reaches 1 for all initial concentrations of substrate.
The eect of the initial concentration of substrate
Figure 4. Eect of the initial concentration of substrate on the substrate conversion at the various operating times. on the butanol and acetone productivity is illustrated in Figure 5(a) and (b), respectively. According to these gures, at a given initial concentration of substrate, the solvent productivity increases during the initial period of the operating time and a peak spot develops and, then, decreases monotonically. The butanol and acetone (also ethanol) productivity increases with the initial concentration of substrate from 25 to 150 gL 1.
Increasing the initial concentration of substrate causes the migration of the peak spot to the left in addition to causing an increase in the solvent productivity at this peak spot. At C0
S = 100 gL 1, this peak
spot occurs at the operating times of 13.31, 15.75, and 15.96 h for the butanol, acetone, and ethanol, respectively. Therefore, the operating time plays an important role in the solvent productivity. As the peak spots arise at dierent operating times for each solvent, a proper objective function (like f2) must be dened to
determine the optimal nal operating time. 6.3. Bi-objective optimization results
With due attention to the subjects of Section 3.5.1 and the parametric sensitivity analysis performed in Section 6.2, the bi-objective optimization approach is used to nd the optimal initial concentration of substrate and the nal operating time to maximize simultaneously f1 and f2, subject to dierential mass
balance equations as the equality constraints. In order to optimize the ABE fermentation process, the MODE code is integrated with a set of ordinary dierential equations (Eqs. (1) and (2)).
The objective function f1 versus f2 is plotted,
as indicated in Figure 6. The curve in this gure is introduced as a Pareto set, and each point in the Pareto set corresponds to an optimal solution and certain values of decision variables. It is obvious that the
Figure 5. Eect of the initial concentration of substrate on the (a) butanol productivity and (b) acetone
productivity at the various operating times.
Figure 6. Pareto-optimal front in objective space.
suggested algorithm is able to generate a set of optimal solutions, not a unique solution. The obtained Pareto-optimal front is well distributed, which means that MODE performs well and is successful for this problem. Twelve non-dominated optimum points are obtained by the optimization algorithm. These points are equally good and have optimum values of both solvent yield and productivity. Shifting from one point to another leads to the enhancement of one objective function at the expense of the other. Three points A, B, and C are considered in this set. For instance, when shifting from point A to C, the objective function f1 increases
and f2 decreases. The comparison of the experimental
data and the optimum points in Figure 6 shows that the experimental data lie below the Pareto-optimal front, meaning that these data were not taken in optimal con-ditions. Votruba et al. [2] reported these experimental data at C0
S = 50 gL 1and nal fermentation time of 27
and 32 h. Table 4 represents the optimal values of the initial concentration of substrate and nal operating time, as well as the objective functions (f1and f2), for
three chosen points, A, B, and C (shown in Figure 6). Point A shows the optimal operating conditions for the maximum solvent productivity, and point C illustrates the optimum operating conditions corresponding to the maximum solvent yield.
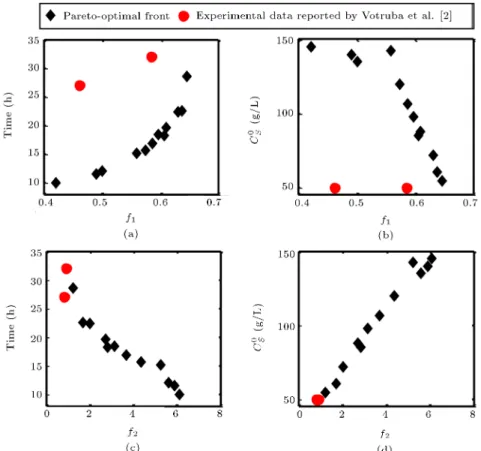
Table 4 veries the fact that the two decision variables are in contrast in nature with respect to the objective functions. In order to determine the contrasting parameters and obtain a further under-standing of the problem, the optimal decision variables are drawn against both objective functions, as shown in Figure 7(a)-(d). Figure 7(b) and (c) illustrate that C0
S and tf have a strong opposing eect on f1 and f2,
respectively. An increase in the initial concentration of substrate and the nal operating time leads to a decrease in the solvent yield and solvent productivity, respectively. Figure 7(a) and (c) reveal that when the nal operating time increases from lower bound to upper bound, f1 increases from 0.42 to 0.64; however,
f2 decreases from 6.10 to 1.23. The optimum value of
the initial concentration of glucose is found to vary from 54.72 to 145.36 gL 1, whereas the optimal nal
oper-ating time is found to change between 10 and 28.56 h. Therefore, it should be taken into consideration that even the higher nal operating time is favored for the solvent yield, which in turn decreases the solvent productivity. An opposing trend is observed for C0
S.
Increasing the initial concentration of substrate will lead to higher solvent productivity and, yet, lower solvent yield.
The Pareto-optimal front supplies a vast-ranging optimum set of operating conditions, where all points have the potential to give a nal solution. The impor-tance of the objective functions, design conditions, and demands of the user are the criteria for the selection
Figure 7. Values of decision variables corresponding to the points on a Pareto set in Figure 6 versus objective functions. Table 4. Operating conditions, objective function, and deviation index corresponding to LINMAP, TOPSIS, and
Shannon's solutions and points A, B, and C in Figure 6. Optimization Decision-making
methods
Decision variables Objective functions Deviation index C0
S (gL 1) tf (h) f1 f2 (gL 1h 1)
Bi-objective Point A 145.36 10 0.420 6.109 0.245
Point B 142.53 15.15 0.557 5.247 0.204
Point C 54.72 28.56 0.644 1.234 0.754
LINMAP 142.53 15.15 0.557 5.247 0.204
TOPSIS 139.56 11.56 0.489 5.909 0.191
Shannon's entropy 145.36 10 0.420 6.109 0.245
Ideal solution { { 0.644 6.109 0
Non-ideal solution { { 0.420 1.234 1
Single-objective based on maximum solvents yield 52.36 45.53 0.644 0.741 0.763 Single-objective based on maximum solvents productivity 150 11.16 0.451 6.579 0.198 of a proper solution from Pareto-optimal front.
How-ever, a suitable decision-making process is required for selecting the best solution from the Pareto set. In this study, the nal optimal point has been chosen using three decision-making methods of TOPSIS, LINMAP, and Shannon's entropy. The nal optimum solution reected by TOPSIS, LINMAP, and Shannon's entropy decision-making approaches and the ideal and non-ideal solutions are represented in Figure 6. The optimal values of the two objective functions, the
initial concentration of substrate, nal operating time, and deviation index obtained through these decision-making approaches are listed in Table 4. The lowest value of deviation index describes the closeness of each point to the ideal solution and its distance from the non-ideal solution. According to the values of the deviation index, the optimum point obtained by TOPSIS with DI = 0:191 is more suitable than that found by LINMAP and Shannon's entropy approach with DI = 0:204 and 0.245, respectively. Therefore,
a combination of the bi-objective optimization results and the decision-making methods shows that the sub-strate initial concentration of 139.56 gL 1and the nal
operating time of 11.56 h are the best feasible points for the ABE fermentation process. At this point, the solvent yields including YA= 0:073, YB = 0:283, YE=
0:010 and the solvent productivities including PA =
0:881, PB= 3:415, PE = 0:122 g L 1h 1are achieved.
The last two rows of Table 4 indicate the results of single-objective optimization based on maximum solvent yield and maximum solvent productivity, sep-arately. Lower deviation indexes for the bi-objective optimization in comparison with the corresponding values for single-objective conclude that the results of bi-objective optimization are more favorable.
6.4. Economy-based optimization results The economy-based optimization of the ABE fermen-tation process is carried out using the DE algorithm. From a prot function point of view, results show that the initial concentration of 150 gL 1and the nal
oper-ating time of 11.52 h are the most economical operoper-ating points, in which the solvent yields are YA = 0:073,
YB= 0:295, YE = 0:010 and solvent productivities are
PA = 0:957, PB = 3:842, PE = 0:135 gL 1 h 1. At
this point, the prot value is US$2.62 L 1year 1.
6.5. Comparison between TOPSIS solution and economy-based optimization
A comparison between the results of economy-based optimization and TOPSIS solution as an optimal point of bi-objective optimization is shown in Table 5. Al-though the amounts of solvent yield are almost the same in both optimizations, the amounts of solvent productivity in the economy-based optimization are more than those in TOPSIS solution. The nal fer-mentation time in TOPSIS solution is nearly identical to that in economy-based optimization; however, the substrate consumption in TOPSIS solution is 7% lower than that in the economy-based optimization. In the Table 5. Comparison between TOPSIS solution and the economy-based optimization.
TOPSIS solution
Economy-based optimization C0
S(gL 1) 139.56 150
tf (h) 11.56 11.52
YA 0.073 0.073
YB 0.283 0.295
YE 0.010 0.010
PA(gL 1h 1) 0.881 0.957
PB (gL 1h 1) 3.415 3.842
PE (gL 1h 1) 0.122 0.135
Prot (US$L 1 year 1) 2.319 2.62
last row of this table, the prot value of economy-based solution is 13% higher than that of TOPSIS solution. Hence, the optimal point obtained through the economy-based optimization is a more economical operating point compared with the TOPSIS solution. 7. Conclusion
This study investigated the bi-objective optimization and economy-based optimization of a batch ABE bio-logical reactor by a dynamic mathematical model. The model was validated against the experimental data, as reported by Votruba et al. [2], and good agreement was obtained. The eect of the initial concentration of substrate on substrate conversion, solvent yield, and solvent productivity was investigated. The MODE algorithm, as an eective and robust optimization method, was used to specify the optimal operating conditions, namely initial concentration of substrate and nal operating time of the process; in this re-gard, two objective functions were dened in terms of solvent yield and productivity. A Pareto optimal set was achieved, and a nal optimum point was chosen through TOPSIS, LINMAP, and Shannon's entropy decision-making methods. The following key results are achieved:
The butanol yield increased with the initial con-centration of substrate; however, the acetone and ethanol yield rstly increased and, then, decreased;
The maximum value of the solvent productivity could be increased by increasing the initial concen-tration of substrate; this maximum point occurred in a shorter operating time period;
Based on the economy-based optimization, the most economical operating condition was found at an initial concentration of 150 gL 1 and the nal
operating time of 11.52 h;
The best optimal point obtained by TOPSIS decision-making approach according to the lowest value of deviation index was achieved at an initial substrate concentration of 139.56 gL 1and the nal
operating time of 11.56 h. However, the application of multi-objective optimization can considerably aid decision-maker in choosing any one of the optima from the Pareto set corresponding to his/her interest in order to maximize a specic objective.
Nomenclature
C Concentration, g L 1
DDj deviation degree of the jth objective
function
DI Deviation Index F Objective function
F Non-dimensionalized objective function K Kinetic constant in the models
kI Inhibition constant
kS Saturation constant for substrate
(glucose)
kAA Saturation constant for acetic acid
kBA Saturation constant for butyric acid
N Cost, US$kg 1
P Productivity, g L 1h 1
R Rate of reaction, g L 1h 1
T Time, h
tc Cleaning time in each cycle (= 2 h)
tf Final operating time (h)
Wj Weight of jth objective function
Y Yield
y Marker of the physiological state of the culture
Greek letters
Number of bacterial culture Superscripts
0 Initial conditions Subscripts
A Acetone
AA Acetic Acid
B Butanol
BA Butyric Acid CO2 Carbon dioxide
E Ethanol
H2 Hydrogen
S Substrate (glucose)
X Biomass
References
1. Mansur, M.C., O'Donnell, M.K., Rehmann, M.S., and Zohaib, M., ABE Fermentation of Sugar Cane in Brazil, University of Pennsylvania, Department of Chemical and Biomolecular Engineering, Senior Design Reports (CBE) (2010).
2. Votruba, J., Volesky, B., and Yerushalmi, L. \Math-ematical model of a batch acetone-butanol fermenta-tion", Biotechnol. Bioeng, 28, pp. 247-255 (1986).
3. Jones, D.T. and Woods, D.R. \Acetone-butanol fer-mentation revisited", Microbiol. Rev., 5, pp. 484-524 (1986).
4. Lin, T.Ch. and Lee, Y.H. \Modeling and dynamic optimization of semi-batch acetone-butanol-ethanol fermentation with in-situ pervaporation membrane separations", Smart Science, 5(4), pp. 179-193 (2017).
5. Sandu, B., Dobre, T., and Parvulescu, O.C. \Mod-elling and optimization of acetone-butanol-ethanol fed-batch biosynthesis", U.P.B. Sci. Bull., Series B, 76(4), pp. 45-58 (2014).
6. Grisales-Diaz, V.H. and Olivar-Tost, G. \Economic optimization of in situ extraction of inhibitors in acetone-ethanol-butanol (ABE) fermentation from lig-nocellulose", Process Biochemistry, 70, pp. 1-8 (2018).
7. Elmeligy, A., Mehrani, P., and Thibault, J. \Articial neural networks as metamodels for the multi-objective optimization of biobutanol production", Appl. Sci., 8(961), pp. 1-16 (2018).
8. Kim, B., Eom, M.H., Jang H., and Lee, J.H. \Opti-mization of the cyclic operation of a continuous biobu-tanol fermentation process integrated with ex-situ adsorption recovery", IFAC-Papers On Line, 48(8), pp. 1204-1209 (2015).
9. Kim, B., Jang, H., Eom, M.H., and Lee, J.H. \Model-based optimization of cyclic operation of acetone-butanol-ethanol (ABE) fermentation process with ex-situ butanol recovery (ESBR) for continuous biobu-tanol production", Ind. Eng. Chem. Res., 56(8), pp. 2071-2082 (2017).
10. Mariano, A.P., Costa, C.B.B., Angelis, D.F., Filho, F.M., Atala, D.I.P., Maciel, M.R.W., and Filho, R.M. \Optimization strategies based on sequential quadratic programming applied for a fermentation process for butanol production", Appl. Biochem. Biotechnol., 159, pp. 366-381 (2009).
11. Mariano, A.P., Costa, C.B.B., Angelis, D.F., Filho, F.M., Atala, D.I.P., Maciel, M.R.W., and Filho, R.M. \Optimization of a fermentation process for butanol production by particle swarm optimization (PSO)", J. Chem. Technol. Biotechnol., 85, pp. 934-949 (2010).
12. Sharma, Sh. and Rangaiah, G.P. \Multi-objective optimization of a fermentation process integrated with cell recycling and inter-stage extraction", 11th Int. Symposium on Process Systems Engineering, Singa-pore, pp. 860-864 (2012).
13. Sharif Rohani, A. \Multi-objective optimization of butanol production during ABE fermentation", Thesis in Master of Applied Science, University of Ottawa, Canada (2013).
14. Bruns, R.E., Scarminio, I.S., and Neto, B.B., Statisti-cal Design-Chemometrics, 1st Edn., Elsevier, Amster-dam (2006).
15. Bezerra, M.A., Santelli, R.E., Oliveira, E.P., Villar, L.S., and Escaleira, L.A. \Response surface method-ology (RSM) as a tool for optimization in analytical chemistry", Talanta, 76, pp. 965-977 (2008).
16. Wang, Y. and Blascheck, H.P. \Optimization of bu-tanol production from tropical maize stalk juice by fermentation with Clostridium beijerinckii NCIMB 8052", Bioresour. Technol., 102, pp. 9985-9990 (2011).
17. YouSheng, L., Jing, W., XuMing, W., and XiaoHong, S. \Optimization of butanol production from corn straw hydrolysate by Clostridium acetobutylicum using
response surface method", Chinese Sci. Bull., 56, pp. 1422-1428 (2011).
18. Cavazzuti, M., Optimization Methods: From Theory to Design, 1st. Edn., Springer, London (2013).
19. Singh, K.G., Lapsiya, K.L., Gophane, R.R., and Ranade, D.R. \Optimization for butanol production using Plackett-Burman design coupled with central composite design by Clostridium beijerenckii strain CHTa isolated from distillery waste manure", J. Biochem. Tech., 7(1), pp. 1063-1068 (2016).
20. Dubey, K.K., Dhingra, A.K., and Rana, Sh. \Opti-mization of process parameters for enhanced biobu-tanol production from Sargassum wightii hydrolysate", Int. J. Energy Technology and Policy, 11(3), pp. 303-311 (2015).
21. Kumar, M., Kumar, D., and Singh, B. \Utilization of agro residue corncob for production of acetone-butanol using Clostridium acetobutylicum and process optimization through RSM", J. Microbial Biochem. Technol., S8, pp. 1-5 (2014).
22. Zheng, J., Tashiro, Y., Zhao, T., Wang, Q., Sakai, K., and Sonomoto, K. \Enhancement of acetone-butanol-ethanol fermentation from eucalyptus hydrolysate with optimized nutrient supplementation through statistical experimental designs", Renewable Energy, 113, pp. 580-586 (2017).
23. Al-Shorgani, N.K.N., Hamid, A.A., Yuso, W.M.W., and Kalil, M.S. \Pre-optimization of medium for biobutanol production by a new isolate of solvent-producing Clostridium", Bioresources, 8, pp. 1420-1430 (2013).
24. Al-Shorgani, N.K.N., Shukor, H., Abdeshahian, P., Nazir, M.Y.M., Kalil, M.S., Hamid, A.A., and Yuso, W.M.W. \Process optimization of butanol produc-tion by Clostridium saccharoperbutylacetonicum N1-4 (ATCC 13564) using palm oil mill euent in acetone-butanol-ethanol fermentation", Biocatalysis and Agri-cultural Biotechnology, 4, pp. 244-249 (2015).
25. Al-Shorgani, N.K.N., Shukor, H., Abdeshahian, P., Nazir, M.Y.M., Kalil, M.S., Yuso, W.M.W., and Hamid, A.A. \Enhanced butanol production by op-timization of medium parameters using Clostridium acetobutylicum YM1", Saudi Journal of Biological Sciences, 25(7), pp. 1308-1321 (2018).
26. Khunchantuek, C. and Fiala, K. \Optimization of key factors aecting butanol production from sugarcane juice by Clostridium beijerinckii TISTR 1461", Energy Procedia., 138, pp. 157-162 (2017).
27. Sirisantimethakom, L., Thanapornsin, T., Laopai-boon, L., and LaopaiLaopai-boon, P. \Enhancement of bu-tanol production eciency from sweet sorghum stem juice by Clostridium beijerinckii using statistical exper-imental design", Chiang Mai J. Sci., 45(3), pp. 1235-1246 (2018).
28. Pandey, A., Larroche, C., Ricke, S., Dussap, C.-G., and Gnansounou, E. Biofuels. Alternative Feedstocks and Conversion Processes, Academic Press, pp. 571-582 (2011)
29. Storn, R. and Price, K. \Dierential evolution-A simple and ecient heuristic for global optimization over continuous spaces", J. Global Optim., 11, pp. 341-359 (1997).
30. Babu, B.V. and Munawar, S.A. \Dierential evolution strategies for optimal design of shell-and-tube heat exchangers", Chem. Eng. Sci., 62, pp. 3720-3739 (2007).
31. Babu, B.V. and Angira, R. \Optimal design of an auto-thermal ammonia synthesis reactor", Comput. Chem. Eng., 29, pp. 1041-1045 (2005).
32. Babu, B.V. and Angira, R. \Modied dierential evo-lution (MDE) for optimization of non-linear chemical processes", Comput. Chem. Eng., 30, pp. 989-1002 (2006).
33. Khademi, M.H., Farsi, M., Rahimpour, M.R., and Ja-hanmiri, A. \DME synthesis and cyclohexane dehydro-genation reaction in an optimized thermally coupled reactor", Chemical Engineering and Processing, 50, pp. 113-123 (2011).
34. Khademi, M.H., Rahimpour, M.R., and Jahanmiri, A. \Dierential evolution (DE) strategy for optimization of hydrogen production, cyclohexane dehydrogenation and methanol synthesis in a hydrogen-permselective membrane thermally coupled reactor", International Journal of Hydrogen Energy, 35, pp. 1936-1950 (2010).
35. Khademi, M.H., Setoodeh, P., Rahimpour, M.R., and Jahanmiri, A. \Optimization of methanol synthesis and cyclohexane dehydrogenation in a thermally cou-pled reactor using dierential evolution (DE) method", International Journal of Hydrogen Energy, 34, pp. 6930-6944 (2009).
36. Khademi, M.H. and Angooraj Taghavi, S. \Optimiza-tion of ethylene oxychlorina\Optimiza-tion uidized-bed reactor using dierential evolution (DE) method", Scientia Iranica, 24(3), pp. 1253-1263 (2017).
37. Babu, B.V., Chakole, P.G., and Syed Mubeen, J.H. \Multiobjective dierential evolution (MODE) for op-timization of adiabatic styrene reactor", Chemical Engineering Science, 60, pp. 4822-4837 (2005).
38. Hwang, C.L. and Yoon, K., Multiple Attribute Decision Making: Methods and Applications, Springer-Verlag, Berlin (1981).
39. Srinivasan, V., Shocker, A.D., and Sethi, S.P. \Linear programming techniques for multi-dimensional anal-ysis of preference", Psychometrica, 38, pp. 337-342 (1973).
40. Guisado, J.L., Jimenez Morales, F., and Guerra, J.M. \Application of Shannon's entropy to classify emergent behaviors in a simulation of laser dynamics", Math. Comput. Model., 42, p. 847 (2005).
41. Yerushalmi, L., Volesky, B., and Votruba, J. \Mod-elling of culture kinetics and physiology for C. ace-tobutylicum", Can. J. Chem. Eng., 64, pp. 607-616 (1986).
42. Yerushalmi, L., Voleskky, B., and Votruba, J. \Fer-mentation process diagnosis using a mathematical model", Applied Microbiology and Biotechnology, 29, pp. 186-197 (1988).
43. Mulchandani, A. and Volesky, B. \Modelling of the acetone-butanol fermentation with cell retention", Canadian J. Chem. Eng., 64, pp. 625-631 (1986).
44. Srivastava, A.K. and Volesky, B. \Updated model of the batch acetone-butanol fermentation", Biotechnol. Prog., 12, pp. 693-698 (1990).
45. Vakili, R., Setoodeh, P., Pourazadi, E., Iranshahi, D. and Rahimpour, M.R. \Utilizing dierential evolution (DE) technique to optimize operating conditions of an integrated thermally coupled direct DME synthesis reactor", Chem. Eng. J., 168, pp. 321-332 (2011).
46. Price, K. and Storn, R. \Dierential evolution (DE) for continuous function optimization", Homepage of dierential evolution as on
http://www.ICSI.Berkeley.edu/wstorn/code.html (May 2006).
47. Deb, K., Multi-Objective Optimization Using Evolu-tionary Algorithms, New York, Wiley (2001).
48. Babu, B.V., Syed Mubeen, J.H., and Chakole, P.G. \Simulation and optimization of wiped-lm poly-ethylene terephthalate (PET) reactor using multiob-jective dierential evolution (MODE)", Materials and Manufacturing Processes, 22, pp. 541-552 (2007).
49. Li, S.Y., Srivastava, R., Suib, S.L., Li, Y., and Parnas, R.S. \Performance of batch, fed-batch, and continu-ous A-B-E fermentation with pH-control", Bioresour. Technol., 102, pp. 4241-4250 (2011).
50. Nanda, S., Dalai, A. and Kozinski, J. \Butanol and ethanol production from lignocellulosic feedstock: biomass pretreatment and bioconversion", Energy Sci-ence & Engineering, 2, pp. 138-148 (2014).
51. Yerushalmi, L. and Volesky, B. \Culture conditions for growth and solvent biosynthesis by a modied clostrid-ium acetobutylicum", Appl. Microbiol. Biotechnol, 25, pp. 513-520 (1987).
52. Qureshi, N. and Blaschek, H.P. \ABE production from corn: a recent economic evaluation", Journal of Industrial Microbiology & Biotechnology, 27, pp. 292-297 (2001).
53. Kumar, R., Kaushik, S.C., Kumar, R., and Hans, R. \Multi-objective thermodynamic optimization of an irreversible regenerative Brayton cycle using evolution-ary algorithm and decision making", Ain Shams Eng. J., 7, pp. 741-753 (2016).
54. Sayyaadi, H. and Mehrabipour, R. \Eciency en-hancement of a gas turbine cycle using an optimized tubular recuperative heat exchanger", Energy, 38, pp. 362-375 (2012).
55. Etghani, M.M., Shojaeefard, M.H., Khalkhali, A., and Akbari, M. \A hybrid method of modied NSGA-II and TOPSIS to optimize performance and emissions of a diesel engine using biodiesel", Appl. Therm. Eng., 59, pp. 309-315 (2013).
56. Ahmadi, M.H., Sayyaadi, H., Dehghani, S., and Hos-seinzade, H. \Designing a solar powered stirling heat engine based on multiple criteria: maximized thermal eciency and power", Energy Convers Manage, 75, pp. 282-291 (2013).
Biographies
Mohammad Hasan Khademi is an Associate Pro-fessor of Chemical Engineering at Isfahan University, Isfahan, Iran. His main research interests include pro-cess modeling, simulation, and optimization, especially in the eld of chemical reactor.
Soheila Zandi Lak obtained her BS degree in Chem-ical Engineering in 2012 from Islamic Azad University of Marvdasht, Iran and her MS degree in 2015 from the Department of Chemical Engineering, Shiraz Branch, Islamic Azad University, Shiraz, Iran. Her main research interests include modeling and optimization of chemical reactors.
![Table 2. Constants for the kinetic model proposed by Votruba et al. [2].](https://thumb-us.123doks.com/thumbv2/123dok_us/8366107.2221903/3.892.477.822.473.915/table-constants-kinetic-model-proposed-votruba-et-al.webp)