© 2019 by the Serbian Biological Society How to cite this article: Ciric M, Waite D, Draper J, Jones JB. Characterization of mid-intestinal microbiota of farmed Chinook salmon using 16S rRNA gene metabarcoding. Arch Biol Sci. 2019;71(4):577-87.
Characterization of mid-intestinal microbiota of farmed Chinook salmon using 16S
rRNA gene metabarcoding
Milica Cirica,1,* David Waiteb,2, Jenny Drapera,3 and John Brian Jonesa,4
aMinistry for Primary Industries, Investigation and Diagnostic Centre, Animal Health Laboratory, 66 Ward Street,
Wallaceville, Upper Hutt, New Zealand
bMinistry for Primary Industries, Investigation and Diagnostic Centre, Plant Health and Environment Laboratory, PO Box
2095, Auckland, New Zealand
1Present address: Institute of Molecular Genetics and Genetic Engineering, University of Belgrade, Vojvode Stepe 444a, 11010 Belgrade, Serbia
2Present address: Australian Centre for Ecogenomics, School of Chemistry and Molecular Biosciences, The University of
Queensland, St Lucia, QLD 4072, Australia
3Present address: Institute of Environmental Science and Research Limited (ESR), Kenepuru Science Centre, 34 Kenepuru Drive, Kenepuru, Porirua 5022, PO Box 50348, Porirua 5240, New Zealand
4Present address: Murdoch University, 90 South St, Murdoch, WA 6150, Australia
*Corresponding author: [email protected]
Received: April 2, 2019; Revised: June 15, 2019; Accepted: July 3, 2019; Published online: July 17, 2019
Abstract: With the growing importance of aquaculture worldwide, characterization of the microbiota of high-value aqua-culture species and identification of their shifts induced by changes in fish physiology or nutrition is of special interest. Here we report the first 16S rRNA gene metabarcoding survey of the mid-intestinal bacteria of Chinook salmon (
Oncorhyn-chus tshawytscha), an economically important aquacultured species. The microbiota of 30 farmed Chinook salmon from
a single cohort was surveyed using metabarcode profiling of the V3-V4 hypervariable region of the bacterial 16S rRNA gene. Seawater, feed and mid-intestinal samples and controls were sequenced in quadruplicate to assess both biological and technical variation in the microbial profiles. Over 1000 operational taxonomic units were identified within the cohort, providing a first glimpse into the mid-intestinal microbiota of farmed Chinook salmon. The taxonomic distribution of the salmon microbiota was reasonably stable, with around two thirds of individuals dominated by members of the family Vibrionaceae. We anticipate that the workflow presented in this paper could be applied in other aquacultured fish species to capture variation or dysbiosis occurring as a result of changes in feed, health or environmental conditions.
Keywords: farmed salmon; mid-intestinal microbiota; partial 16S rRNA gene sequencing
Abbreviations: non-metric multidimensional scaling (NMDS); operational taxonomic unit (OTU); permutational multi-variate analysis of variance (PERMANOVA)
577 INTRODUCTION
The digestive tracts of all vertebrates harbor complex assemblages of microorganisms (microbial communi-ties), collectively referred to as intestinal microbiota. The intestinal microbiota is an area of research inter-est universally applicable to Animalia, but the major-ity of studies on intestinal microbiota composition and function in vertebrates have been conducted in
mammals. Comparatively little is known about the fish intestinal microbiota and its response to changing environmental conditions [1], despite the fact that fish represent roughly half of all living vertebrate species [2] and are of global economic significance.
conven-tional studies indicate the involvement of the intesti-nal microbiota in fish nutrition, development of in-testinal epithelium, immunity and disease [3]. During the past few decades, substantial research has been carried out to characterize the intestinal microbiota in a wide range of fish species, focusing primarily on model organisms (i.e. zebrafish) and species relevant to aquaculture. As studies of fish intestinal microbial diversity have moved away from culture- and micros-copy-based observations to the culture-independent molecular techniques, it has become clear that the in-testinal microbiota of fish is more variable than pre-viously realized. High throughput partial 16S rRNA gene sequencing has been increasingly employed to investigate changes in the structure of fish intestinal microbial community caused by diet (including pro-biotics), starvation, pathogens, different lifestyles and water temperature [1,4,5].
Fish intestines harbor a combination of resident (autochthonous) microbiota, attached to the intestinal mucosa, and non-resident (allochthonous) microbio-ta, comprised of microbes appearing transiently and/ or associated with digesta [6,7]. The composition of fish intestinal microbiota and species richness varies with life stage, diet and environment [3,8] and dif-fers between marine and freshwater species [9]. Fish intestinal microbiota also varies between individuals, across the length of the gastrointestinal tract, and be-tween intestinal content and mucosal surfaces [1,5,10-12]. Interaction between time of sampling and diet is strongly related to the observed community structure [13]. Nonetheless, phylogenetic and statistical analyses of 16S rRNA gene libraries suggest the presence of persistent members of autochthonous teleost intestinal communities, the ‘core’ microbiota that remains stable despite changing factors [4,14]. ‘Core’ microbiota has been observed not only within a single fish species, but also may be shared between broad ranges of fish species [5,15,16].
Most fish intestinal microbial communities in-vestigated to date comprise microbes from the phyla Actinobacteria, Bacteroidetes, Firmicutes, Fusobacte-ria, Planctomycetes, Proteobacteria and Tenericutes [1,3,17]. The genera Aeromonas and Pseudomonas (Proteobacteria) and phylum Bacteroidetes domi-nate freshwater fish bacterial communities, while the genera Vibrio, Pseudomonas and Alteromonas
(Proteo-bacteria) are reported to predominate the intestines of marine fish [1,3,9]. Proteobacteria and Firmicutes are the most reported phyla in the salmonid intestines [7], although current knowledge of the bacterial diversity in the salmon gastrointestinal tract is largely based on classical culturing techniques. Dominant cultur-able bacteria isolated from intestines of salmonid fish species include Vibrio, Aliivibrio, Photobacterium, Lac-tobacillus, Lactococcus, Flavobacterium, Pseudomonas and assorted Enterobacteriaceae. Recent sequencing-based studies have focused on salmonid species most prevalent in aquaculture – especially Atlantic salmon (Salmo salar) [6,19-24], Coho salmon ( Oncorhyn-chus kisutch) [24] and rainbow trout (Oncorhynchus mykiss) [11,26-30]. To our knowledge, no such studies have been published on Chinook salmon ( Oncorhyn-chus tshawytscha), also known as king salmon, a spe-cies that is farmed in commercial quantities mainly in New Zealand and Chile.
The aim of this study was to identify the mid-intestinal microbiota of farmed Chinook salmon and assess the effects of biological variation between fish mid-intestinal microbiota and technical variation be-tween and within sequencing run. For this reason, our experimental design included duplication of the library indexing (to assess intra-run variation) and sequencing (to assess run-to-run variation) steps.
MATERIALS AND METHODS
Ethics statement
The fish examined in this research were obtained from the commercial salmon farm (NZ King Salmon farm) after normal commercial harvest and prior to gut-ting and gilling. All fish were harvested according to standard NZ King Salmon operational practice [30]. Under New Zealand’s Animal Welfare Act 1999, dis-sections on carcass material do not require approval by the animal ethics committee.
Fish management
New Zealand) during a standard harvest operation. All sampled fish were female (which is a standard practice in New Zealand salmon farming [31]), ap-proximately 22 months old, and belonged to a single cohort. Individuals were reared in sea pens (20 m x 20 m x 15 m) using standard farm management prac-tice [30]. The fish were fed a Quinnat Plus 2200 com-mercial diet (BioMar, Denmark), delivered to the sea pens via a mobile hopper twice a day using a satiation feeding approach, until the harvest. No antibiotics, probiotics, antifungals, antivirals or antiparasitics were used during the rearing of the salmon.
Sample collection and processing
Samples were collected in January 2015 (mid-sum-mer) at the salmon farm from 30 apparently healthy Chinook salmon. The fish were harvested at an aver-age weight of 3.6 kg using standard NZKS operational practice [30] and processed on the barge immediately after slaughter. The fish were dissected, and the length and the appearance of the mid-intestine, measured from the last pyloric caecae to the start of the distal intestine, was recorded. For each fish, a single 1-cm section of the mid-intestine, including its content, was collected from the first half of the mid-intestines (roughly 2 cm past the pyloric caeca) using sterile in-struments and placed into sterile tubes containing 5 mL RNA solution (Ambion, USA). Several feed pellets from the spinner supplying the relevant pen and 5 mL of seawater from the surface of the pen were also collected into sterile tubes containing 5 mL ater solution. A sterile tube containing 5 mL RNAl-ater solution was handled identically to the rest of the samples, including being carried to the sampling site (barge) and briefly exposed to the air (negative con-trol). The samples were transported on ice packs to the laboratory and stored at 4°C for two weeks prior to DNA extraction.
For each fish, the mid-intestinal section was re-moved aseptically from the RNA and opened longi-tudinally to release digesta using sterile forceps and scalpel, and the appearance of the intestinal content was recorded. The opened mid-intestinal tissue sec-tion was “washed” in 3 mL of RNAlater suspension in which it was stored by vigorous vortexing at maxi-mum speed for 30 s to release and homogenize
intes-tinal content. The washed intesintes-tinal tissue was then aseptically removed, and the remaining homogenized mid-intestinal sample (with intestinal content) was split into two 1.5-mL aliquots. One aliquot was used directly for the DNA extraction. For the other aliquot, prior to DNA extraction, material gently scraped from the mucosal surface of removed intestinal tissue was added to the sample to increase the likelihood of col-lecting bacterial cells adherent to the gut epithelium or trapped in the mucus layer. For each fish, DNA was extracted from two 1.5-mL aliquots of the salmon mid-intestinal samples (one with and one without the addition of scraped mucosal material). Approximately 100-200 mg of feed pellets were crushed aseptically using a mortar and pestle and homogenized in 1.5 mL of RNAlater by vortexing. The seawater sample was not processed prior to DNA extraction.
DNA extractions
DNA was extracted from two 1.5-mL aliquots of the salmon mid-intestinal sample/RNAlater suspensions (one with and one without the addition of scraped mucosal material), as well as from 1.5 mL of seawater/ RNAlater suspension and 1.5 mL of feed/RNAlater suspension. Because of several possible sources of bac-terial DNA contamination during sampling and DNA extraction [32], a DNA extraction was also performed from 1.5 mL of RNAlater carried during the sampling trip (negative control, to account for bacterial DNA being introduced from the DNA extraction and sam-ple handling). DNA was extracted with a NucleoSpin Soil kit (Macherey-Nagel, Germany) using an adapted manufacturer’s protocol, and DNA yield, purity and integrity, as well as the presence of bacterial and host DNA in mid-intestinal samples and controls, were assessed as described in the Supplementary Material (subheading: ‘DNA extractions’).
16S rRNA amplicon library preparation and sequencing
the strongest 16S amplicon band, judged by agarose gel electrophoresis, was chosen for sequencing. For sea-water and feed samples, the RNAlater, the no-template control (molecular water) and genomic DNA from the mock microbial community HM-782D [33], 16S amplicons were produced without template dilution. The detailed protocol on the preparation of sequencing library can be found in Supplementary Material (sub-heading: ‘16S rRNA amplicon library preparation’).
Samples were normalized where possible to the equivalent concentration of 10 ng/µL and sent to the sequencing provider New Zealand Genomics Limited (NZGL) for indexing and sequencing. Indexing was performed by NZGL using the Nextera XT Index Kit (Illumina, USA) in duplicate for each sample, with two distinct dual index pairs used for each sample to assess the effect of index and intra-run variability. This dual indexing of the initial library of 35 samples (30 fish samples, seawater and feed samples, and 3 controls) resulted in a final sequencing library of 70 samples. All samples were pooled without normalization and sequenced twice using the Illumina MiSeq system with v3 reagents to produce 2x300 bp reads. This platform and this particular chemistry were chosen, among available options at the time of sequencing, be-cause they offered the most favorable combination of number of reads and their length at lowest cost. Two separate 600-cycle 65-h runs were performed using two MiSeq instruments to determine ‘run-to-run’ var-iation (technical replicates). For each of 30 fish and 5 controls, samples were indexed twice and each of these two sample subsets were sequenced twice, in two sepa-rate sequencing runs. The reads were processed and assigned to OTUs using the QIIME software package, version 1.8.0 [34], as described in the Supplementary Material (subheading: ‘Sequence analysis’).
RESULTS
Sample collection and preparation of 16S rRNA amplicon library
Sampled salmon mid-intestines ranged in length from 9 to 15 cm. The majority of samples (26) had a nor-mal appearance, while the remaining 4 had lesions visible on the inner intestinal lining. Although the sampled salmon had been fed as per usual farm
pro-tocol until the harvest, only 8 contained visible feed content. Quality checks of the DNA samples extracted from salmon mid-intestinal samples, seawater, feed and RNAlater (control), as well as of the 16S rRNA amplicons, are discussed in Supplementary Material (subheading: ‘16S rRNA amplicon library’).
Sequencing metrics and analysis
Sequencing yielded a total of 18 million 16S rRNA gene amplicon sequences, combined over both se-quencing runs. Approximately 10.2 million and 7.9 million of reads were assigned to an index in the first and the second sequencing run. Raw sequences from Chinook salmon mid-intestinal microbiome 16S rRNA gene metabarcoding survey generated on the Illumina platform are publicly available through the NCBI Sequence Read Archive (SRA) database. SRA accession is SRP134829 (https://www.ncbi.nlm.nih. gov/sra/SRP134829).
Following read pair joining, removal of short sequences and stringent quality filtering, sequence numbers were reduced to 750000 sequences spread over 140 samples (Supplementary Table S3). All iden-tified OTUs and their occurrence in each group can be found in the Supplementary File (QIIME_qc30. final.txt). A full list of all OTUs identified during the quality control stages is reported in Supplementary Table S1. The overall sequencing error rate, based on sequencing mock microbial community, was 0.49%. The number of sequences recovered and OTU rich-ness in all the controls (RNAlater, no-template control and mock microbial community) was low, indicating very low levels of contaminating DNA sequences in these controls.
Mid-intestinal microbiota of farmed Chinook salmon
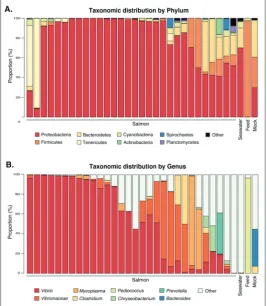
repre-sented the genera Synechococcus, Clostridium, Pseudomonas, Chryseobacterium, Brevundi-monas, Sphingomonas, Paracoccus, NS5 ma-rine group, NS4 mama-rine group, Polaribac-ter, Acinetobacter, Sulfitobacter, Loktanella, Photobacterium and Pseudoalteromonas, or, where a specific genus name could not be assigned, the family Rhodobacteraceae and orders Rickettsiales SAR116_clade, Rhizo-biales and Oceanospirillales. The taxonomic distribution of the salmon microbiota was conserved between individuals, but notably different between salmon and environmental samples (Figs. 1 and 2).
Analysis of variation
Alpha diversity indices (Chao1 richness es-timator and the Shannon and inverse Simp-son diversity estimators), calculated from the final OTU table, are presented in the Sup-plementary Addendum (QIIME_qc30.alpha. txt). Five measures of community structure
(Jaccard, unweighted UniFrac, Bray-Curtis, Yue-Clayton theta and weighted UniFrac dis-tances) were computed from the final OTU table. Measures were performed using both the full (‘uncorrected’) and ‘error-corrected’ data table. Boxplot visualization of the PERMANOVA data (distribution of fit measurements according to metadata characteristics for all calculated beta diver-sity measures, reported according to error correction strategy) showed high variability (Fig. 5). High vari-ability in the distribution of fit measurements accord-ing to metadata characteristics for all calculated beta diversity measures is due to the aggregation of multi-ple beta diversity scores using multimulti-ple subsampling strategies. For example, unweighted UniFrac typically performed poorly in the individual category (median R2=0.42), while Yue-Clayton provided an excellent fit for data (median R2=0.97). Manual identification and analysis of a subset of the data with highly simi-lar amplicon yields, as determined by densitometry, showed the same pattern as for the full data set (data not shown).
Visualization of this data performed using a NMDS plot of community structure, based on
Yue-Fig. 1. Phylum (A) and genus (B) level taxonomic distribution of the sur-veyed microbiomes. Bars report the mean abundance for each individual sample. The top 9 most abundant genera (across all samples) are reported, all others are aggregated into ‘Other’.
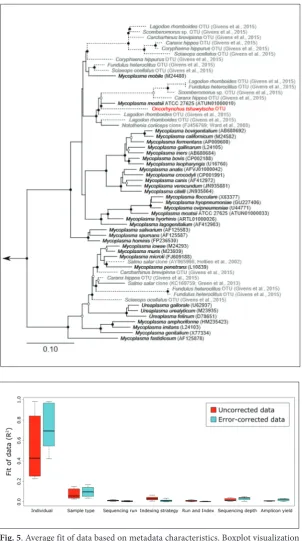
Fig. 4. Phylogenetic analysis of Mycoplasma -like 16S rRNA sequences obtained from marine vertebrates. Sequences in black were obtained from cultivated Mycoplasma isolates and those in grey from publicly available mi-crobiome surveys. Sequence in red represents the Mycoplasma-like OTU from this data set. Dashed lines represent short sequences (<1000 bp) inserted into the fixed tree. Boot-strap support is represented by solid (≥90%) and hollow (≥75%) junctions. Scale bar rep-resents 10% sequence divergence.
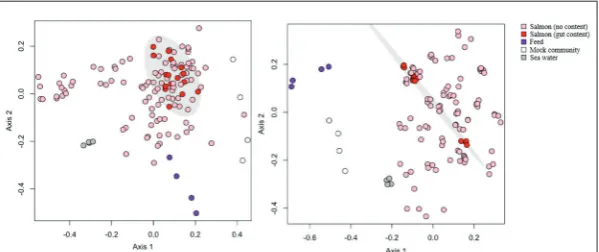
Fig. 5. Average fit of data based on metadata characteristics. Boxplot visualization of the distribution of fit measurements according to metadata characteristics for all calculated beta diversity measures. Data are reported according to error correction (i.e. contaminant removal) strategy, as defined in section 2.4. High variability is due to the aggregation of multiple beta diversity scores using multiple subsampling strat-egy. For example, unweighted UniFrac typically performed poorly in the Individual category (median R2=0.42), while Yue-Clayton provided an excellent fit for data (me-dian R2=0.97). Nonetheless, it is clear that the majority of variation is attributable to variation between individuals.
Clayton theta distance with no sub-sampling (Fig. 6), showed that the 4 technical replicates for each sample clustered together, while feed and seawater samples and controls (NTC, RNAlater, mock) were distinct. With the exception of the RNAlater con-trol in the ‘uncorrected data’, the microbiota present in the additional samples (feed, seawater) did not have a significant effect on the fish intestinal microbiota, although it is likely that these sources act to seed the intestinal microbiota with certain microbial lineages.
A list of all OTUs identified dur-ing quality control stages is reported in Supplementary Table S1. Removal of OTUs associated with negative controls or with distributions inverse-ly correlated to amplicon yield [35] improved the fit of the data (Fig. 5).
Diversity and individual variation in salmon mid-intestinal
microbiota
parameter with observable effect and although the presence of digesta did not drive a strong separation of salmon samples, there was a tendency for these sam-ples to cluster within the broader salmon data (Fig. 7).
DISCUSSION
Although the sampled salmon had been fed as per usual farm protocol until the harvest, only about one third of sampled salmon had visible feed content in their intestines. Sampling was performed during a mid-summer water temperature spike, and salmon tend to go off feed when water temperatures are high [36]. Following the completion of this study, salmon farms in the region, including the one surveyed, re-ported elevated fish mortality (>30%) over the
sam-pling period, which was likely associ-ated with this stressor. Although the sampled fish appeared healthy, due to the starvation and temperature varia-tions it is unknown whether the mi-crobial profiles reported here would remain similar for fish without these environmental stressors.
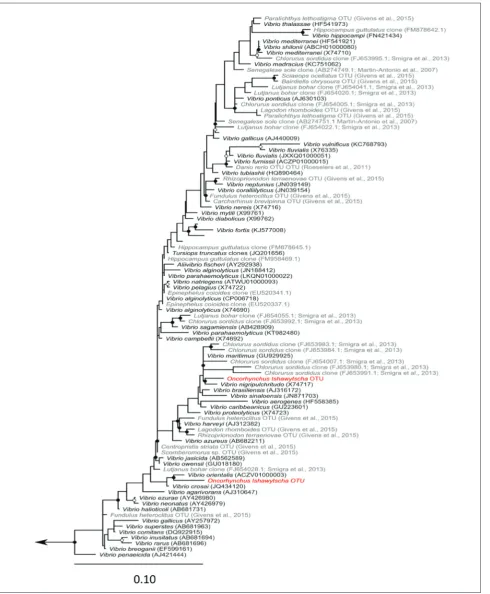
The mid-intestinal microbiota of the majority of fish was dominated by the family Vibrionaceae, as has been observed in Atlantic salmon (Salmo salar) [23]. Interestingly, two of the 30 sampled individuals had a mi-crobiota dominated by Mycoplasma; dominance of Mycoplasma spp. has been seen before in wild-caught At-lantic salmon [19]. Phylogenetic in-ference of OTUs belonging to these lineages demonstrated that these OTUs are closely related to species identified in similar analyses of fish microbiota [16,20,38-41] (Figs. 3 and 4). The observation of Vibrio and My-coplasma is consistent with typical fish-associated species and they are unlikely to represent colonization by novel lineages.
When attempting to characterize a “core microbiome” shared among the sampled salmon, it was apparent that at the level of individual OTUs, the microbiota of the fasting fish is quite variable within this single cohort. This is not surprising, as conservation of intestinal microbiota occurs primarily at the level of metabolic function, while the specific bacterial species fulfilling that function within an individual animal can vary significantly [41,42].
A recent study of the effects of starvation on the Asian seabass (Lates calcarifer), another farmed carnivorous species, reported a major shift in the in-testinal microbiota towards members of the phylum Bacteroidetes, driven by an increase in members of the classes Sphingobacteria and Bacteroidia and a decrease in the Betaproteobacteria [43]. Without a control group of salmon feeding normally, it is
im-Fig. 6. NMDS plots of community structure. Plots are based on Yue-Clayton theta distance with no subsampling. Shadowing reflects clustering of individual samples. Left: Uncorrected data (stress=0.24, r2=0.95). Right: Error-corrected data (stress=0.23, r2=0.95). Controls (NTC, Mock, Feed, Sea water, RNAlater) cluster separately; the remaining clusters tend to be composed of the 4 technical replicates from an indi-vidual fish.
possible to determine if a similar effect is occurring in this data, but if so, this shift is not apparent in the core microbiota of the sampled cohort. Members of Bacteroidetes in the salmon only approached the lev-els of Proteobacteria in 10% of individuals (three fish). Although the microbiota of the pellet feed was dominated by a strain of Pediococcus (Fig. 1; median abundance 96.5%), this organism was almost unde-tectable in the salmon mid-intestines (<0.01%). Pedio-coccus acidilactici strain MA 18/5M is sold as the pro-biotic product Bactocell® (Lallemand Inc., Canada) for reducing intestinal inflammation in fish [44], and this product is added to some BioMar feed pellets (Bio-Mar Group, Denmark). The low abundance of this organism in the intestine suggests that the organism is not able to establish in the intestines and quickly declines when salmon are not actively consuming the probiotic.
Importantly to aquaculture of these fish, an OTU matching Piscirickettsia salmonis was detected in four individuals. This is consistent with the finding of P. salmonis-like bacteria at multiple salmon farms in the Marlborough Sounds [45,46], including the farm sampled during this study. Accurate taxonomic iden-tification from partially sequenced 16S rRNA gene fragments is problematic [47,48], but as P. salmonis is a known salmon pathogen [49], this detection dem-onstrates the applicability of 16S rRNA gene metabar-coding for detection of potential pathogens in asymp-tomatic individuals and highlights the need to follow up suspicious findings with targeted diagnostic tests.
Under all 5 distance metrics tested, the effects of the biological variables (individual variation, sample type) in the study were profoundly greater than the technical aspects – sequencing run, index and con yield. Although the individual donor and ampli-con yield variables are highly ampli-confounded, analysis of a data subset with highly similar amplicon yields showed the same pattern as for the full data set. The data demonstrate that the microbiota donor is the strongest contributor towards community structure, and that technical parameters quantified within this study do not significantly influence patterns in com-munity structure.
Overall, it appears that the effects of technical var-iation, including amplicon yield, indexing and MiSeq
run, when each step is performed by the same indi-vidual and instrument, are negligible. Contamination by reads from the kits and reagents, however, does appear to have a minor effect and should be accurately quantified and removed from the data prior to analy-sis. Overall, although the impact of contamination is negligible on the level of gross variation between individuals, it does have an effect. Batch-to-batch variations of kit and reagent microbial contaminant profiles were previously reported [32,50]; therefore we highly recommend running such controls for every individual kit and PCR reagent batch used.
The finding of lower microbial diversity in sam-pled salmon compared to seawater is expected, as the acquisition and maintenance of fish intestinal microbiota is a complex process. It is driven by both environmental availability of potential microbial col-onizers and host physiological pressures in a highly selective gut environment [51,52].
Observed clustering of samples with intestinal content is not unexpected, as the digesta is the pri-mary source of nutrients for the intestinal microbiota, thus affecting the microbial community structure. The apparent lack of similarity between the microbiota structure of the fed salmon mid-intestines and the feed pellets provides evidence that the food source is not contributing significantly to the colonizing intes-tinal microbiota.
In conclusion, we conducted the first 16S rRNA gene metabarcoding survey of the bacterial intestinal microbiota of farmed Chinook salmon. Over a thou-sand OTUs were identified within the intestines of a cohort of 30 fish, providing a first glimpse into the mid-intestinal microbiota of this aquacultured species. Our survey was performed during a summer water temperature spike and it is unknown whether the mi-crobial profiles reported here would remain similar for fish without this environmental stressor.
of the Human Microbiome Project: Genomic DNA from Microbial Mock Community B (Even, Low Concentration), v5.1L, for 16S rRNA Gene Sequencing, HM-782D.
Author contributions: Experimental work was carried out by MC and JD. Bioinformatic analyses were carried out by DW and JD. JBJ had an advisory role. All authors contributed to the manu-script writing and had input into reviewing the manumanu-script. All authors read and approved the final manuscript.
Conflicts of interest disclosure: The authors declare that there are no financial or non-financial conflict of interest in the publication of this manuscript.
REFERENCES
1. Llewellyn MS, Boutin S, Hoseinifar SH, Derome N. Teleost microbiomes: the state of the art in their characterization, manipulation and importance in aquaculture and fisheries. Front Microbiol. 2014;5: 207.
2. Nelson JS, Grande TC, Mark WVH. Fishes of the World, 5th Edition. New York: John Wiley & Sons; 2016.
3. Nayak SK. Role of gastrointestinal microbiota in fish. Aquac Res. 2010;41(11):1553–73.
4. Tarnecki AM, Burgos FA, Ray CL, Arias CR. Fish Intestinal Microbiome: Diversity and Symbiosis Unraveled by Metage-nomics. J Appl Microbiol. 2017;123(1):2-17.
5. Ghanbari M, Kneifel W, Domig KJ. A new view of the fish gut microbiome: Advances from next-generation sequencing. Aquaculture. 2015;448:464–75.
6. Navarrete P, Espejo RT, Romero J. Molecular analysis of microbiota along the digestive tract of juvenile Atlantic salmon (Salmo salar L.). Microb Ecol. 2009;57(3):550–61. 7. Romero J, Ringø E, Merrifield DL. The Gut Microbiota of
Fish. In: Aquaculture Nutrition. Chichester, UK: John Wiley & Sons, Ltd; 2014. p. 75–100.
8. Gómez GD, Balcázar JL. A review on the interactions between gut microbiota and innate immunity of fish. FEMS Immunol Med Microbiol. 2008;52(2):145–54.
9. Mouchet MA, Bouvier C, Bouvier T, Troussellier M, Escalas A, Mouillot D. Genetic difference but functional similar-ity among fish gut bacterial communities through molecu-lar and biochemical fingerprints. FEMS Microbiol Ecol. 2012;79(3):568–80.
10. Gajardo K, Rodiles A, Kortner TM, Krogdahl Å, Bakke AM, Merrifield DL, Sørum H. A high-resolution map of the gut microbiota in Atlantic salmon (Salmo salar): A basis for com-parative gut microbial research. Sci Rep. 2016:30893. 11. Kim D-H, Brunt J, Austin B. Microbial diversity of
intesti-nal contents and mucus in rainbow trout (Oncorhynchus mykiss). J Appl Microbiol. 2007;102(6):1654–64.
12. Larsen AM, Mohammed HH, Arias CR. Comparison of DNA extraction protocols for the analysis of gut microbiota in fishes. FEMS Microbiol Lett. 2015;362(5).
13. Zarkasi KZ, Taylor RS, Abell GCJ, Tamplin ML, Glencross BD, Bowman JP. Atlantic Salmon (Salmo salar L.) Gastrointestinal
Microbial Community Dynamics in Relation to Digesta Prop-erties and Diet. Microb Ecol. 2016;71(3):589–603.
14. Egerton S, Culloty S, Whooley J, Stanton C, Ross RP. The gut microbiota of marine fish. Front Microbiol. 2018;9. 15. Givens C, Ransom B, Bano N, Hollibaugh J. Comparison of
the gut microbiomes of 12 bony fish and 3 shark species. Mar Ecol Prog Ser. 2015;518:209–23.
16. Sullam KE, Essinger SD, Lozupone CA, O’Connor MP, Rosen GL, Knight R, Kilham SS, Russell JA. Environmental and eco-logical factors that shape the gut bacterial communities of fish: a meta-analysis. Mol Ecol. 2012;21(13):3363–78. 17. Izvekova GI, Izvekov EI, Plotnikov AO. Symbiotic microflora
in fishes of different ecological groups. Izv Akad Nauk Seriia Biol. 2007;(6):728–37.
18. Green TJ, Smullen R, Barnes AC. Dietary soybean protein concentrate-induced intestinal disorder in marine farmed Atlantic salmon, Salmo salar is associated with alterations in gut microbiota. Vet Microbiol. 2013;166(1–2):286–92. 19. Holben WE, Williams P, Gilbert MA, Saarinen M, Särkilahti
LK, Apajalahti JHA. Phylogenetic analysis of intestinal micro-flora indicates a novel Mycoplasma phylotype in farmed and wild salmon. Microb Ecol. 2002;44(2):175–85.
20. Hovda MB, Fontanillas R, McGurk C, Obach A, Rosnes JT. Sea-sonal variations in the intestinal microbiota of farmed Atlantic salmon (Salmo salar L.). Aquac Res. 2012;43(1):154–9. 21. Hovda MB, Lunestad BT, Fontanillas R, Rosnes JT. Molecular
characterisation of the intestinal microbiota of farmed Atlan-tic salmon (Salmo salar L.). Aquaculture. 2007;272(1):581–8. 22. Skrodenyte-Arbaciauskiene V, Sruoga A, Butkauskas D, Skrupskelis K. Phylogenetic analysis of intestinal bacteria of freshwater salmon Salmo salar and sea trout Salmo trutta trutta and diet. Fish Sci. 2008;74(6):1307–14.
23. Zarkasi KZ, Abell GCJ, Taylor RS, Neuman C, Hatje E, Tam-plin ML, Katouli M, Bowman JP. Pyrosequencing-based char-acterization of gastrointestinal bacteria of Atlantic salmon (Salmo salar L.) within a commercial mariculture system. J Appl Microbiol. 2014;117(1):18–27.
24. Romero J, Navarrete P. 16S rDNA-based analysis of domi-nant bacterial populations associated with early life stages of coho salmon (Oncorhynchus kisutch). Microb Ecol. 2006;51(4):422–30.
25. Desai AR, Links MG, Collins SA, Mansfield GS, Drew MD, Van Kessel AG, Hill JE. Effects of plant-based diets on the dis-tal gut microbiome of rainbow trout (Oncorhynchus mykiss). Aquaculture. 2012;350:134–42.
26. Jaafar RM, Kania PW, Larsen AH, Nielsen DS, Fouz B, Browdy C, Buchmann K. Gut microbiota changes in rainbow trout, Oncorhynchus mykiss (Walbaum), during organic acid feed supplementation and Yersinia ruckeri infection. J Fish Dis. 2013;36(6):599–606.
27. Mansfield GS, Desai AR, Nilson SA, Van Kessel AG, Drew MD, Hill JE. Characterization of rainbow trout (Oncorhyn-chus mykiss) intestinal microbiota and inflammatory marker gene expression in a recirculating aquaculture system. Aqua-culture. 2010;307(1):95–104.
29. Navarrete P, Magne F, Mardones P, Riveros M, Opazo R, Suau A, Pochart P, Romero J. Molecular analysis of intestinal microbiota of rainbow trout (Oncorhynchus mykiss). FEMS Microbiol Ecol. 2010;71(1):148–56.
30. New Zealand King Salmon Report. 2011 [cited 2016 Nov 6]. Available from: https://www.epa.govt.nz/assets/ FileAPI/proposal/NSP000002/Applicants-proposal- documents/6e18a60c5b/Appendix-2-NZ-King-Salmon-Report.pdf.
31. Camara MD, Symonds JE. Genetic improvement of New Zea-land aquaculture species: Programmes, progress and pros-pects. NZJ Mar Freshwater Res. 2014;48(3):466–91. 32. Salter SJ, Cox MJ, Turek EM, Calus ST, Cookson WO,
Mof-fatt MF, Turner P, Parkhill J, Loman NJ, Walker AW. Reagent and laboratory contamination can critically impact sequence-based microbiome analyses. BMC Biol. 2014;12(87). 33. BEI Resources. HM-782D Mixed bacteria, Genomic DNA
from Microbial Mock Community B (Even, Low Concen-tration), v5.1L, for 16S rRNA Gene Sequencing. 2014 [cited 2016 Nov 6]. Available from: https://www.beiresources.org/ Catalog/otherProducts/HM-782D.aspx .
34. Caporaso JG, Kuczynski J, Stombaugh J, Bittinger K, Bushman FD, Costello EK, Fierer N, Peña AG, Goodrich JK, Gordon JI, Huttley GA. QIIME allows analysis of high-throughput community sequencing data. Nat Methods. 2010;7(5):335-6. 35. Jervis-Bardy J, Leong LEX, Marri S, Smith RJ, Choo JM,
Smith-Vaughan HC, Nosworthy E, Morris PS, O’Leary S, Rogers GB, Marsh RL. Deriving accurate microbiota profiles from human samples with low bacterial content through post-sequencing processing of Illumina MiSeq data. Micro-biome. 2015;3(19).
36. Sauter S, McMillan J, Dunham J. Salmonid Behavior and Water Temperature. 2001 [cited 2016 Sep 17]. Available from: https://nepis.epa.gov/Exe/ZyPDF.cgi/P100TNSE. PDF?Dockey=P100TNSE.PDF.
37. Smriga S, Sandin SA, Azam F. Abundance, diversity, and activity of microbial assemblages associated with coral reef fish guts and feces. FEMS Microbiol Ecol. 2010;73(1):31–42. 38. Martin-Antonio B, Manchado M, Infante C, Zerolo R, Labella
A, Alonso C, Borrego JJ. Intestinal microbiota variation in Senegalese sole (Solea senegalensis) under different feeding regimes. Aquac Res. 2007;38(11):1213–22.
39. Roeselers G, Mittge EK, Stephens WZ, Parichy DM, Cava-naugh CM, Guillemin K, Rawls JF. Evidence for a core gut microbiota in the zebrafish. ISME J. 2011;5(10):1595–608. 40. Ward NL, Steven B, Penn K, Methé BA, Detrich WH.
Charac-terization of the intestinal microbiota of two Antarctic noto-thenioid fish species. Extremophiles. 2009;13(4):679–85. 41. Shafquat A, Joice R, Simmons SL, Huttenhower C. Functional
and phylogenetic assembly of microbial communities in the human microbiome. Trends Microbiol. 2014;22(5):261–6.
42. Turnbaugh PJ, Hamady M, Yatsunenko T, Cantarel BL, Duncan A, Ley RE, Sogin ML, Jones WJ, Roe BA, Affour-tit JP, Egholm M, Henrissat B, Heath AC, Knight R, Gordon JI. A core gut microbiome in obese and lean twins. Nature. 2009;457(7228):480–4.
43. Xia JH, Lin G, Fu GH, Wan ZY, Lee M, Wang L, Liu XJ, Yue GH. The intestinal microbiome of fish under starvation. BMC Genomics. 2014;15(266).
44. Vasanth G, Kiron V, Kulkarni A, Dahle D, Lokesh J, Kitani Y. A Microbial Feed Additive Abates Intestinal Inflammation in Atlantic Salmon. Front Immunol. 2015;6:409.
45. Brosnahan CL, Ha HJ, Booth K, McFadden AMJ, Jones JB. First report of a rickettsia-like organism from farmed Chinook salmon, Oncorhynchus tshawytscha (Walbaum), in New Zea-land. New Zeal J Mar Freshw Res. 2017;51(3):356–69. 46. Gias E, Draper J, Brosnahan CL, Orr D, McFadden A, Jones
B. Draft Genome Sequence of a New Zealand Rickettsia-Like Organism Isolated from Farmed Chinook Salmon. Genome Announc. 2016;4(3):e00503-16.
47. Wang Y, Qian P-Y, Methe B, Lovley D, Chandler D. Conser-vative Fragments in Bacterial 16S rRNA Genes and Primer Design for 16S Ribosomal DNA Amplicons in Metagenomic Studies. PLoS One. 2009;4(10):e7401.
48. Yarza P, Yilmaz P, Pruesse E, Glöckner FO, Ludwig W, Schle-ifer K-H, Whitman WB, Euzéby J, Amann R, Rosselló-Móra R. Uniting the classification of cultured and uncultured bac-teria and archaea using 16S rRNA gene sequences. Nat Rev Microbiol. 2014;12(9):635–45.
49. Rozas M, Enríquez R. Piscirickettsiosis and Piscirickettsia salmonis in fish: a review. J Fish Dis. 2014;37(3):163–88. 50. Goodrich JK, Di Rienzi SC, Poole AC, Koren O, Walters WA,
Caporaso JG, Knight R, Ley RE. Conducting a microbiome study. Cell. 2014;158(2):250–62.
51. Dehler CE, Secombes CJ, Martin SAM. Environmental and physiological factors shape the gut microbiota of Atlantic salmon parr (Salmo salar L.). Aquaculture. 2017; 467:149–57. 52. Yan Q, Li J, Yu Y, Wang J, He Z, Van Nostrand JD, Kem-pher ML, Wu L, Wang Y, Liao L, Li X, Wu S, Ni J, Wang C, Zhou J. Environmental filtering decreases with fish develop-ment for the assembly of gut microbiota. Environ Microbiol. 2016;18(12):4739–54.
Supplementary Material
The Supplementary Material is available at: http://serbiosoc.org. rs/NewUploads/Uploads/Ciric%20et%20al_Supplementary%20 Material_4144.pdf