N-STORM
Super-resolution Microscope
Operation Manual
Introduction
Thank you for purchasing a Nikon product.
This instruction manual is written for users of the Nikon Super-resolution Microscope N-STORM. To ensure correct usage, read this manual carefully before operating this product.
• No part of this manual may be reproduced or transmitted in any form without prior written permission from Nikon.
• The contents of this manual are subject to change without notice.
• The equipment described in this manual may differ from the actual product in its appearance.
• Although every effort has been made to ensure the accuracy of this manual, errors or inconsistencies may remain. If you
note any points that are unclear or incorrect, please contact your nearest Nikon representative.
• Some of the equipment described in this manual may not be included in the set you have purchased.
• If you intend to use any other equipment with this product, read the manual for that equipment too.
• If this equipment is used in a manner not specified by the manufacturer, the protection provided by the equipment may be
impaired.
Symbols used in this operation manual
This operation manual uses the following symbols.
Indicates information that should be kept in mind when using this product, or which provides useful hints.
Registered trademark
• Product names and company names used in this document are trademarks or registered trademarks of their respective
companies.
• Trademarks and registered trademarks of their respective companies, as used in this document, are not marked with TM
Contents
Introduction ... i
Terminology
Used
in This Document... 1
STORM
Microscopy Operation ... 5
2.1 Preparation of the N-STORM System ... 6
2.2 Acquiring 3D-STORM (2D-STORM) Images... 13
2.2.1 Acquiring Images in Normal Mode ... 13
2.2.2 Acquiring Images in Single-color Continuous Mode ... 19
2.2.3 Acquiring Images in Multi-color Continuous Mode ... 25
2.3 N-STORM Analysis ... 32
2.4 Terminating the N-STORM System... 40
2.5 Calibration for 3D-STORM and Multi-color Continuous Mode... 41
Details of the STORM Analysis Window Operations ... 47
3.1 Managing Calibration Data... 47
3.1.1 Backing Up the Calibration Data Stored as Device Information... 48
3.1.2 Restoring the Calibration Data to Use It as Device Information... 49
3.1.3 Saving the Calibration Data of an ND2 File as a Text File ... 50
3.1.4 Reading the Saved Calibration Data to an ND2 File ... 51
3.2 Batch STORM Analysis... 52
3.2.1 [Batch STORM Analysis] Dialog Box ... 52
3.2.2 Batch Analysis Procedure... 54
3.3 Filter Settings ... 56
3.4 Adjusting the Gaussian Rendering Parameters ... 58
3.4.1 [Gaussian Rendering - Intensity] Dialog Box ... 58
3.4.2 [Gaussian Rendering - Size] Dialog Box ... 60
3.4.3 Threshold Setting When the Continuous Automatic Gaussian Rendering Parameters Adjusting Mode Is Used... 61
3.5 Subtracting Crosstalk... 62
3.5.1 Basic Settings for Crosstalk Subtraction... 62
3.5.2 Calculating Cross Activation ... 64
The Screens of the N-STORM Software ... 65
4.1 N-STORM Control Window ... 65
4.2 N-STORM Settings Window... 67
4.3 N-STORM Analysis Window ... 69
4.3.1 Tool Bar ... 69 4.3.2 Slider ... 72 4.3.3 Channel Tab ... 73 4.3.4 Status Bar... 74
FAQ ... 76
5.1 Image Acquisition... 76 5.2 Analysis ... 77 5.3 Display ... 79 Chapter1
Chapter2
Chapter3
Chapter4
Chapter5
Terminology Used in This Document
N-STORM
System that allows STochastic Optical Reconstruction Microscopy (STORM) with Nikon’s inverted research microscope Ti-E. During STORM, some fluorescent probe molecules are randomly stimulated (activated) with relatively weak light to become activated, after which their images are acquired through an EM-CCD camera (imaging). The series of images that is acquired through frequent repetition of this process is analyzed and synthesized by software, and formed into a super-resolution image.
Conventional image
Image of 256 x 256 pixels acquired using an EM-CCD camera. In STORM analysis, a set of sequentially acquired conventional images is used as material.
STORM image (2D-STORM/3D-STORM image)
Super-resolution image generated as a result of analyzing a dataset of conventional images. It includes information such as the position, size, and intensity of each individual fluorescent probe molecule.
A STORM image that only has information on the positions in the X- and Y-axis directions is referred to as “2D-STORM image,” while one that also has information on the positions in the Z-axis direction is referred to as “3D-STORM image.”
Dye pair
Composite dye used for STORM observation, such as the following: Examples: Alexa405-Alexa647
Cy2-Alexa647 Cy3-Alexa647
Probe
Fluorescent molecule (dye pair or monomolecular dye) used for STORM observation.
Dataset
Set of consecutive frames (conventional images) acquired through an EM-CCD camera. A dataset is saved in ND2 file format for NIS-Elements.
Frame
Individual conventional image that is acquired through an EM-CCD camera as material to be used to generate a STORM image.
Activation frame
Frame (image) that is acquired when relatively weak laser light for activation is illuminating the specimen. This activation
Terminology Used in This Document
Imaging frame
Frame (image) that is acquired when laser light for imaging is illuminating the specimen. In this frame, fluorescent probe molecules fluoresce only when activation has caused them to become activated. Note that if images are to be acquired in continuous mode, there is no difference between the activation and imaging frames because activation and imaging are performed simultaneously.
Cycle
Set of frames that consists of an activation frame (normally one frame) and the subsequent imaging frames (normally three frames) on one channel during image acquisition in normal mode.
Channel
In the multi-staining procedure, the cycle in which each dye is observed is called a channel.
Period
Set of cycles that is made up of one cycle of each of the multiple channels on which images are acquired in normal mode. For example, if images are acquired on two channels, one period consists of two cycles. If images are acquired on only one channel, a period is the same as a cycle.
Dataset structure in normal mode (example)
Number of image acquisition channels: 2
Number of activation frames per period (per cycle) on one channel: 1 Number of imaging frames per period (per cycle) on one channel: 3
A1: Activation frame on channel 1
I1: Imaging frame on channel 1
A2: Activation frame on channel 2
I2: Imaging frame on channel 2
Activation laser Channel 1 (405 nm) Activation laser Channel 2 (561 nm) Imaging laser (647 nm) ON ON ON ON ON ON ON ON ON ON ON Frame Cycle Cycle Period Dataset
(Repeat the same operation.)
Method of acquiring STORM images on a single channel using a monomolecular dye that can itself become bright or dark, instead of requiring a dye pair for activation. Since the activation laser and imaging laser are illuminating the specimen simultaneously to acquire images, image acquisition takes less time than in normal mode. In this case, the concept of a cycle or period is not applied.
Dataset structure in single-color continuous mode (example)
Activation laser (405 nm) Imaging laser (647 nm) ON ON ON ON ON ON ON ON Frame Dataset ON ON ON ON ON ON ON ON
Multi-color continuous mode
Method of acquiring STORM images on multiple channels using a monomolecular dye that can itself become bright or dark, instead of requiring a dye pair for activation. Since the activation laser and imaging laser are illuminating the specimen simultaneously to acquire images, image acquisition takes less time than in normal mode.
Dataset structure in multi-color continuous mode (example)
Number of image acquisition channels: 2
Number of frames per period (per cycle) on one channel: 7
Non-specific activation (NSA)
During image acquisition in normal mode, only those molecules that are detected in the first imaging frame after activation are classified as being of the relevant channel. Also, those molecules that are not detected in the first imaging frame but in the second or subsequent frames are classified as being those of a non-specific activation (NSA) channel. Information on non-specific activation channels is used for crosstalk subtraction. (For details, see step 6 in “2.3 N-STORM Analysis,” in Chapter 2.) Activation laser (405 nm) Imaging laser Channel 1 (647 nm) Imaging laser Channel 2 (561 nm) Frame Cycle Cycle Period
(Repeat the same operation.) Dataset ON ON ON ON ON ON ON ON ON ON ON ON ON ON ON ON ON ON ON ON ON ON ON ON ON ON ON ON ON ON ON ON 1 1 1 1 1 1 1 2 2 2 2 2 2 2 1 1
STORM Microscopy Operation
The overall operational steps and their corresponding descriptions in this chapter are as follows:
*1 Only for acquiring new images in 3D-STORM or multi-color continuous mode
For details, see “2.5 Calibration for 3D-STORM and Multi-color Continuous Mode.”
(Steps from Image Acquisition to Analysis)
2
2.1 Preparation of the N-STORM System
Calibration*1
2.3 N-STORM Analysis
2.4 Terminating the N-STORM System
Calibration*1 Calibration*1
Normal mode Single-color
continuous mode Multi-color continuous mode 2D 3D 2D 3D 3D 2D Calibration*1 2.2.1 Acquiring Images in Normal Mode 2.2.2 Acquiring Images in Single-color Continuous Mode
2.2.3 Acquiring Images in Multi-color Continuous
2.1
Preparation of the N-STORM System
Prepare the microscope, the laser, and other peripheral devices, and then start NIS-Elements AR.
Connecting the piezo Z stage
The controller for the piezo Z stage must be connected to the PC with a USB cable. Remove the analog cable that directly connects the controller to the microscope. Also, select [Manage devices...] from the [Devices] menu, and turn off [Ti PiezoZ] under [Nikon Ti].
1 Perform safety checks.
(-> Chapter 3, “Detailed Microscopy Procedure” of the user manual of the TIRF illuminator)
2 Turn the power on.
(1) Turn on the motorized stage and the illumination light source.
(2) Turn on the piezo Z stage. (3) Turn on the microscope.
(4) Turn on each laser head. (See the user manuals for the TIRF illuminator and each laser head.) (5) Turn on the LU4A laser unit.
(6) Turn on the PC.
POWER
Motorized stage power supply
Diascopic illumination power supply
HG precentered fiber illuminator
POWER ON OFF UNIT1 UNIT2 UNIT3 REVO DSC1 DSC2 SHUTTER1 DC24V IN
ERGO/JOYMODEL TI-HUBC/A
USB STAGE REMOTE HGFIE TI-PS SHUTTER2 5 5 0 3 0 1
This device complies with Part 15 of the FCC Rules. Operation is subject to the following two conditions: (1) this device may not cause harmful interference, and (2) this device must accept any interference received including interference that may cause undesired operation. This Class A digital apparatus complies with Canadian ICES-003. Cet appareil numØrique de la classe
A est conforme la norme NMB-003 du Canada. MADE IN JAPAN INTERLOCK PIEZO PFS OFFSET Microscope LU4A 2-(1) 2-(1) 2-(1) 2-(3) 2-(5)
When MPB Communications Inc.’s 647-nm laser is used
(1) Start the laser control software GUI-VFL. (2) Click [On] in the window to turn on the 647-nm
laser.
The value of [SHG temp.] is displayed. (3) Follow the procedure below to gradually
increase the output of the 647-nm laser through GUI-VFL (procedure recommended by the laser maker).
Set the power to 50 mW, click [Activate], and then wait until the value of [Power, mW] becomes about 50 mW.
Then, set the power to 200 mW, click [Activate], and wait until the value of [Power, mW] reaches about 200 mW. The value of [Power, mW] may change by a few percent, but this does not affect the acquisition of STORM images. After the completion of this procedure, use NIS-Elements to adjust the laser power. It is not necessary to use GUI-VFL for adjustment.
(For details on the procedure for turning off this laser, see step 1 in “2.4 Terminating the N-STORM System.”)
3 Start NIS-Elements AR.
(1) Start NIS-Elements AR by double-clicking the corresponding icon.
(2) When the camera driver selection dialog is displayed, select [ANDOR with N-STORM]. (To change the camera driver after NIS-Elements is
started, select [Select Driver…] from the [Acquire]
menu.)
(3) Display the [N-STORM] control window and the
3-(1) 3-(2) (1) (2) (3) (3)
4 Place the imaging target in the visual field.
Set a specimen, direct the light path to the binocular part to perform epi-fluorescence microscopy, and then put the STORM imaging target into the visual field.
(For details on the procedure for epi-fluorescence microscopy, see the user manual for the microscope.)
5 Configure camera settings.
In the [DU-897 Settings] control window (EM-CCD camera settings), configure the settings as follows.
[Format For Live]: No Binning
[Format For Capture]: No Binning
Exposure time: Any setting (1 frame
recommended)
[Readout Mode]: EM Gain 10 MHz 14-bit
[EM Gain Multiplier]: 300
[Conversion Gain]: 1.0 x
[Desired Temperature] (Commands -> Advanced
Camera Settings): -70°C
[Default Cam] button
Clicking [Default Cam] in the N-STORM control window resets the camera settings to the defaults.
6 Wait until the temperature of the camera stabilizes at
about -70°C and [Desired temp. differs!] disappears.
It takes a few minutes for the temperature of the camera to stabilize.
7 Put the objectives for STORM into the light path.
Objectives: CFI Apo TIRF 100x oil (NA1.49) or
CFI Plan Apo VC 100x oil (NA1.40) Use Nikon immersion oil Type B or Type NF for oil immersion of the objectives.
When using CFI Apo TIRF 100x oil, adjust the correction ring to suit the cover glass. If a cover glass No. 1-S (No.1.5) is used, it is recommended that the position of the correction ring be 0.165 mm.
8 Perform an observation with TIRF illumination.
(1) Direct the light path to the EM-CCD camera. Note: Set the cylindrical lens for 3D-STORM to OUT
(where it is not in the light path). (2) Set the episcopic illumination to [TIRF]. (3) Put the filter cube corresponding to the image
acquisition mode into the light path.
Mode Filter cube
Normal Single-color
continuous
Nikon N-STORM filter cube Multi-color
continuous
Chroma zt405/488/561/647
laser tirf quad set
(4) Click [Interlock] on the N-STORM control window to disable the laser interlock.
If the interlock cannot be disabled
If clicking [Interlock] does not disable the interlock, the light path may not be set to the side port, or the laser safety cover of the stage may not be secured properly. Make sure that the light path is set to the side port (the EM-CCD camera for STORM), and that the laser safety cover is secured. Then, click [Interlock] again.
(5) Click [Live] of NIS-Elements to display the live image on the screen.
(6) Select the checkbox for the 647-nm laser and set the power to about 5% to 10%. (If the power is too strong, photo-bleaching further occurs.) Deselect the checkboxes for the other lasers.
(7) Set the shutter of the laser to OPEN in the N-STORM control window.
(8) Set the laser position to the TIRF position (about 4200). (For details on how to adjust the TIRF, see the user manual for the TIRF illuminator.)
(9) After TIRF observation is completed, temporarily
deselect the checkbox for the 647-nm laser on the N-STORM control window.
8-(2) 8-(6), (9) 8-(4) 8-(8) 8-(7) 8-(1)
9 Configure camera ROI settings.
Select [Camera ROI] -> [Define ROI] from the [Acquire] menu of NIS-Elements, and then set the pixel range as follows. Example: [Left] 128 pixels [Top] 128 pixels [Width] 256 pixels [Height] 256 pixels Available range
The range available for STORM is 256 x 256, 128 x 128 or 64 x 64 pixels only.
10 Configure the settings for the other optical systems for N-STORM.
LU4A 4-laser unit TI-TIRF-E Motorized TIRF illuminator unit 3D-STORM port
(Ti-E side port) Cylindrical lens
ND filter slider STORM slider λslider-plate filter sliderND N-SIM/N-STORM
switching port is used
2D-STORM IN *1 IN IN OUT OUT 1x
3D-STORM IN *1 IN IN OUT IN *2 STORM *2
IN: Included in the light path, OUT: Not included in the light path
*1 ND filter slider of the LU4A 4-laser unit
L2 position: Two ND32s are put into the light path. L3 position: Both ND2 and ND4 are put into the light path. L4 position: Two ND32s are put into the light path.
*2 Cylindrical lens
When the cylindrical lens is put into the light path, the image will be slightly blurred.
Image distortion caused by the cylindrical lens
While inserting the cylindrical lens distorts an image, the distortion of an image acquired in 3D-STORM mode is automatically corrected.
Fix the laser unit with
four blocks during
transportation.
ND filter sliders of the LU4A 4-laser unit
Cylindrical lens
STORM slider
λ-plate slider
(The right slider among the three) ND filter sliders
(the two of the three sliders for center and left)
11 Register the state of the ND filter (only when the ND filter of the laser unit has been operated).
The registered value is used to subtract crosstalk when images are acquired on three channels in normal mode. (1) Click [ND] in the N-STORM control window.
(2) Select the state of the ND filter (IN or OUT), and click [OK].
11-(1)
2.2
Acquiring 3D-STORM (2D-STORM) Images
To perform STORM analysis, create a dataset by having light stimulation and image acquisition repeated automatically with the appropriate laser power. There are three modes for acquiring images: normal mode, single-color continuous mode, and multi-color continuous mode. In normal mode, activation and imaging are performed in separate frames. In continuous mode, they are performed simultaneously.
The following basically describes the procedure for acquiring 3D-STORM images. Any differences from the procedure for
acquiring 2D-STORM images are noted together with the symbol “”.
2.2.1
Acquiring Images in Normal Mode
In the example below, the following two types of probe are used. • Channel 1: Alexa405-Alexa647 dye (Alexa647 activated by Alexa405) • Channel 2: Cy3-Alexa647 dye (Alexa647 activated by Cy3)
Calibration for 3D-STORM
Before the first 3D-STORM image is acquired, it is necessary to perform calibration. See “2.5 Calibration for 3D-STORM and Multi-color Continuous Mode.”
1 Click [Settings] in the [N-STORM] control window and
then specify the mode and the number of frames for each cycle.
[Mode]: Select [Normal Mode].
[Activation Cycle] (number of activation frames): 1 [Reporter Cycle] (number of reporter frames): 3 [Image Size]: Select 256 x 256, 128 x 128 or 64 x 64 pixels.
After making this setting, click [OK].
2 Select [3D-STORM] in the [N-STORM] control window.
To acquire a 2D-STORM image, select
[2D-STORM].
1
2 1
3 Finely and properly adjust the laser focal point of the TIRF illuminator.
(1) Select the checkbox for the 647-nm laser.
(2) Turn on the Perfect Focus System (PFS) in [Ti Pad] and set the focus.
(3) Finely adjust the laser focal point of the TIRF illuminator so that the observation target is visible.
3-(1)
3-(3) 3-(2)
4 Check activation.
(1) Make sure that the checkbox for the reporter laser (647 nm) is selected, and then set the power to 100% by adjusting the power slider.
(2) Make sure that the checkbox for the activation laser (405 nm, 457 nm, or 561 nm) is deselected, and then set the value to about 0.3% by adjusting the power slider.
(3) Select the checkbox for the activation laser so that the specimen is illuminated for about a second, and then immediately deselect it.
Check that the live image becomes bright once and then returns to the previous state as a result of activation causing the fluorescent probe to fluoresce.
When using multiple activation lasers, check this for each activation laser.
If activation cannot be checked
If illumination of the activation laser does not make the live image bright, it may be improved by increasing the power of the activation laser or replacing the buffer solution of the specimen with a fresh solution.
4-(2)
4-(1) 4-(3)
5 Configure the N-STORM acquisition settings.
The settings are as follows. Fluorescent probe checkbox:
Turn on the probe to be used.
Output of the activation laser (405 nm, 457 nm, 561 nm): Approx. 0.2% to 0.3% (values with which proper activation is performed as shown in step 4 above) Output of the imaging laser (647 nm):
100%
[Period Count] (number of periods for image acquisition):
Any setting (normally 5000 to 20000 *1)
[Path], [File Name] (folder to which the file is to be saved and the file name): Any setting
[STORM Image] (whether to display the STORM image during image acquisition):
If this checkbox is selected, the STORM image is previewed during acquisition. Normally, this should
be selected.
[Graph] (whether to display a graph during image acquisition):
If this checkbox is selected, a graph showing the number of bright points in the image is displayed. Normally, this should be selected.
[Minimum Height] (minimum intensity):
300 *2
*1 The above number of periods for image acquisition
is a reference value. Adjust it according to the structure or coloring status of the specimen. Even when it is set to 20000 periods in advance, if it is confirmed as being large enough on the real time analysis (preview) screen, it is possible to halt the acquisition (for example, about 10000 periods) by clicking [Finish].
*2 The above-mentioned minimum height is a reference
value. Adjust it according to the amount of background light for the specimen, etc.
Checkboxes for the lasers
It is not necessary to select the checkboxes for the lasers. (There is no problem, either, if the checkboxes are selected.) When image acquisition starts, the activation laser illuminates the specimen according to the settings specified in the [N-STORM Settings] screen. Also, the checkbox for the imaging laser is automatically selected.
6 Click [Run Now].
Disabling large image mode
If large image mode is enabled with the ND Acquisition function of NIS-Elements, images cannot be acquired. Disable the acquisition of large images before clicking [Run Now].
6 5
7 Measure the gap between the boundary surface of the cover glass and the position of the observation target (Z-axis direction) using the method below.
This step is not required for 2D-STORM.
(1) Step 1:
When the right dialog is displayed, select the imaging laser (647 nm). Set the focus to the boundary between the cover glass and the
specimen by using the PFS offset controller. (Adjust the power to about 50% to 100% using the slider.)
Set the focus to the boundary surface of the cover glass.
When setting the focus, move the XY stage and view, as boundary marks, the dye molecules that are
non-specifically adsorbed onto the boundary surface of the cover glass to identify the boundary surface.
After setting the focus, click [OK]. The XY stage automatically returns to its original position.
(2) Step 2:
When the dialog shown on the right is displayed, set the focus to the target imaging position by using the PFS offset controller.
After setting the focus, click [OK]. The measured gap (Z-axis direction) is automatically saved and used in analysis.
When acquisition is started, the dialog box shown on the right is displayed. Do not perform any operation using this dialog box until image acquisition has been completed. Clicking [Events...], [Pause], or [Refocus] prevents the acquisition of appropriate images for STORM analysis. To halt the acquisition, click [Finish] or [Abort]. (If [Finish] is clicked, the acquired images are saved. Be careful because, if [Abort] is clicked, the acquired images will be discarded.) 7-(1) 7-(2) Cover glass Boundary surface of cover glass Cover glass Imaging target
8 Adjust the power of the activation laser, if necessary, during real time analysis (preview) of the acquired images.
Image acquisition is started. The result of real time analysis (preview) and a graph are displayed.
Recommended number of bright points
The recommended data for STORM analysis is as follows: the density of bright points is not too low but not so high that they do not overlap each other. For
example, a structure that covers the entire screen (such as a microtubule in a cell) should be provided with about 100 to 200 bright points per frame in a visual field with 256 x 256 pixels. The number of bright points to be activated can be adjusted by changing the power of the activation laser.
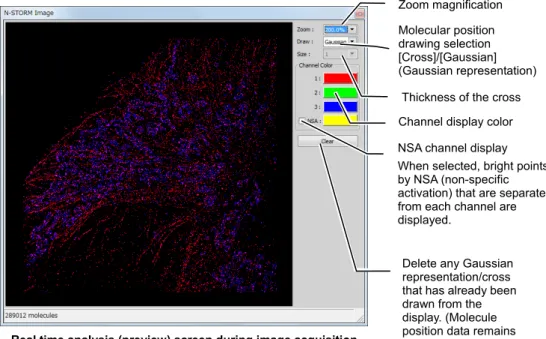
Real time analysis (preview) screen during image acquisition
Details of real time analysis
During real time analysis, the value of [Minimum Height] on the N-STORM control window is used as a threshold to analyze bright points. Real time analysis does not include drift correction.
Graphic screen during image acquisition
The number of bright points per frame of imaging probe
Graph of the number of bright points for each channel (for some latest periods)
Graph of the number of bright points for each channel (plot only the first imaging frame of each period)
Display width (period count) setting Automatic scroll on/off
Scale setting : Maximum, minimum Zoom magnification Molecular position drawing selection [Cross]/[Gaussian] (Gaussian representation)
Thickness of the cross Channel display color
Delete any Gaussian representation/cross that has already been drawn from the display. (Molecule position data remains undeleted.)
Period number
Period number
NSA channel display When selected, bright points by NSA (non-specific activation) that are separated from each channel are displayed.
After the completion of acquisition, click [x] in the windows for real time analysis (preview) and graph to close the windows.
After the power of the activation laser is adjusted, clicking [Auto LP] in the [N-STORM] control window automatically adjusts the laser power so that the number of bright points is maintained. Also, the upper limit on the power for automatic adjustment(%) can be specified on the [Max] box. (Note that this function is not available when images are acquired on three channels.)
2.2.2
Acquiring Images in Single-color Continuous Mode
In the example below, the following probe is used. • Alexa647 dye (Alexa647 activated by Alexa405)
Calibration for 3D-STORM
Before the first 3D-STORM image is acquired, it is necessary to perform calibration. See “2.5 Calibration for 3D-STORM and Multi-color Continuous Mode.”
1 Click [Settings] in the [N-STORM] control window and
then configure the settings.
[Mode]:
Select [Single-color Continuous Mode]. [Image Size]:
Select 256 x 256, 128 x 128 or 64 x 64 pixels. After making this setting, click [OK].
2 Select [3D-STORM] in the [N-STORM] control window.
To acquire a 2D-STORM image, select
[2D-STORM].
1
2
3 Finely and properly adjust the laser focal point of the TIRF illuminator.
(1) Select the checkbox for the 647-nm laser.
(2) Turn on the Perfect Focus System (PFS) in [Ti Pad] and set the focus.
(3) Finely adjust the laser focal point of the TIRF illuminator so that the observation target is visible.
3-(1)
3-(2)
4 Check activation.
(1) Make sure that the checkbox for the reporter laser (the figure on the right shows an example when a 647-nm laser is used) is selected, and then set the power to 100% by adjusting the power slider. (2) Make sure that the checkbox for the activation laser
(the figure on the right shows an example when a 405-nm laser is used) is deselected, and then set the value to about 0.3% by adjusting the power slider.
(3) Select the checkbox for the activation laser so that the specimen is illuminated for about a second, and then immediately deselect it.
Check that the live image becomes bright once and then returns to the previous state as a result of activation causing the fluorescent probe to fluoresce.
If activation cannot be checked
If illumination of the activation laser does not make the live image bright, it may be improved by increasing the power of the activation laser or replacing the buffer solution of the specimen with a fresh solution.
4-(2) 4-(1) 4-(3)
5 Configure the N-STORM acquisition settings.
The settings are as follows. Fluorescent probe checkbox:
Turn on the probe to be used.
Output of the activation laser (the figure on the right shows an example when a 405-nm laser is used):
Approx. 1% to 10% (values with which proper activation is performed as shown in step 4 above) When using the activation laser, select the checkbox for the activation laser. If this checkbox is not selected, the laser is not used.
Output of the imaging laser (647 nm): 100%
It is not necessary to select the checkbox for the imaging laser. (There is no problem, either, if the checkbox is selected.) When image acquisition starts, the checkbox for the imaging laser is automatically selected.
[Period Count] (number of periods for image acquisition):
Any setting (normally 5000 to 20000 *1)
[Path], [File Name] (folder to which the file is to be saved and the file name):
Any setting
[STORM Image] (whether to display the STORM image during image acquisition):
If this checkbox is selected, the STORM image is previewed during acquisition. Normally, this should be selected.
[Graph] (whether to display a graph during image acquisition):
If this checkbox is selected, a graph showing the number of bright points in the image is displayed. Normally, this should be selected.
[Minimum Height] (minimum intensity):
300 *2
*1 The above number of periods for image acquisition
is a reference value. Adjust it according to the structure or coloring status of the specimen. Even when it is set to 20000 periods in advance, if it is confirmed as being large enough on the real time analysis (preview) screen, it is possible to halt the acquisition (for example, about 10000 periods) by clicking [Finish].
*2 The above-mentioned minimum height is a
reference value. Adjust it according to the amount of background light for the specimen, etc.
6 Click [Run Now].
Disabling large image mode
If large image mode is enabled with the ND Acquisition function of NIS-Elements, images cannot be acquired. Disable the acquisition of large images before clicking [Run Now].
7 Measure the gap between the boundary surface of the
cover glass and the position of the observation target (Z-axis direction) using the method below.
This step is not required for 2D-STORM.
(1) Step 1:
When the dialog shown on the right is displayed, select the imaging laser (647 nm). Set the focus to the boundary between the cover glass and the specimen by using the PFS offset controller. (Adjust the power to about 50% to 100% by using the slider.)
Set the focus to the boundary surface of the cover glass.
When setting the focus, move the XY stage and view, as boundary marks, the dye molecules that are
non-specifically adsorbed onto the boundary surface of the cover glass to identify the boundary surface.
After setting the focus, click [OK]. The XY stage automatically returns to its original position.
(2) Step 2:
When the dialog shown on the right is displayed, set the focus to the target imaging position by using the PFS offset controller.
After setting the focus, click [OK]. The measured gap (Z-axis direction) is automatically saved and used in analysis.
When acquisition is started, the dialog box shown on the right is displayed. Do not perform any operation using this
7-(1) 7-(2) Cover glass Boundary surface of cover glass Cover glass Imaging target 6
8 Adjust the power of the activation laser, if necessary, during real time analysis (preview) of the acquired images.
Image acquisition is started. The result of a real time analysis (preview) and a graph are displayed.
Recommended number of bright points
The recommended data for STORM analysis is as follows: the density of bright points is not too low but not so high that they do not overlap each other. For
example, a structure that covers the entire screen (such as a microtubule in a cell) should be provided with about 100 to 200 bright points per frame in a visual field with 256 x 256 pixels. The number of bright points to be activated can be adjusted by changing the power of the activation laser.
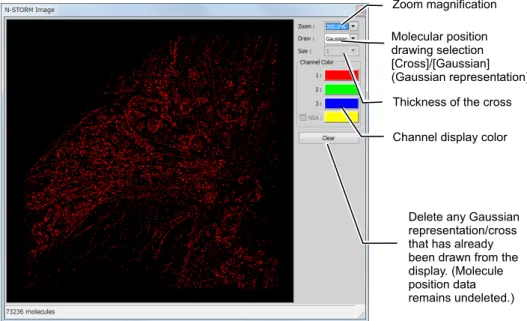
Real time analysis (preview) screen during image acquisition
Details of real time analysis
During real time analysis, the value of [Minimum Height] on the N-STORM control window is used as a threshold to analyze bright points. Real time analysis does not include drift correction.
Graphic screen during image acquisition
Zoom magnification Molecular position drawing selection [Cross]/[Gaussian] (Gaussian representation) Thickness of the cross Channel display color
Delete any Gaussian representation/cross that has already been drawn from the display. (Molecule position data remains undeleted.)
The number of bright points per frame of imaging probe
Graph of the number of bright points (for some latest frames)
Graph of the number of bright points
Display width (period count) setting
Automatic scroll on/off Period number
Period number Scale setting
After the completion of acquisition, click [x] in the windows for real time analysis (preview) and graph to close the windows.
After the power of the activation laser is adjusted, clicking [Auto LP] in the [N-STORM] control window automatically adjusts the laser power so that the number of bright points is maintained. Also, the upper limit on the power for automatic adjustment(%) can be specified in the [Max] box.
2.2.3
Acquiring Images in Multi-color Continuous Mode
In the example below, the following probe is used. • Alexa647 dye (Alexa647 activated by Alexa405 or Cy3)
Calibration for 3D-STORM
Before the first 3D-STORM image is acquired, it is necessary to perform calibration. See “2.5 Calibration for 3D-STORM and Multi-color Continuous Mode.”
1 Click [Settings] in the [N-STORM] control window and
then make the necessary settings.
(1) Select [Multi-color Continuous Mode].
(2) Select the checkbox for the fluorescent probe to be used.
Up to two probes can be used. Three probes cannot be selected.
(3) Specify the number of frames per cycle (up to seven frames) and the frames for which to use the
activation laser.
The number of frames per cycle cannot be changed individually for each probe.
(4) Select the image size.
After making the settings, click [OK].
2 Select [3D-STORM] in the [N-STORM] control window.
To acquire a 2D-STORM image, select
[2D-STORM].
2 1-(1) 1-(2) 1-(3) 1-(4)3 Finely and properly adjust the laser focal point of the TIRF illuminator.
(1) Select the checkbox for the 647-nm laser.
(2) Turn on the Perfect Focus System (PFS) in [Ti Pad]
and set the focus.
(3) Finely adjust the laser focal point of the TIRF
illuminator so that the observation target is visible.
3-(1)
3-(3) 3-(2)
4 Check activation.
(1) Make sure that the checkbox for the reporter laser is selected (the figure on the right shows an example when a 647-nm laser is used), and then set the power to 100% by adjusting the power slider. (2) Make sure that the checkbox for the activation laser
is deselected (the figure on the right shows an example when a 405-nm laser is used), and then set the value to about 1% to 10% by adjusting the power slider.
(3) Select the checkbox for the activation laser so that it illuminates the specimen for about a second, and then immediately deselect it.
Check that the live image becomes bright once and then returns to the previous state as a result of activation causing the fluorescent probe to fluoresce. Adjust the activation laser individually for each fluorescent probe that is set.
If activation cannot be checked
If illumination of the activation laser does not make the live image bright, it may be improved by increasing the power of the activation laser or replacing the buffer solution of the specimen with a fresh solution.
4-(2) 4-(1) 4-(3)
5 Configure the N-STORM acquisition settings.
The settings are as follows. Activation laser
Specify a value for each fluorescent probe. (The figure on the right shows an example when a 405-nm laser is used):
About 1% to 10% (values with which proper activation is performed as shown in step 4 above)
Output of the imaging laser (647 nm/561 nm): 100%
[Period Count] (number of periods for image acquisition):
Any setting (normally 5000 to 20000*1)
[Path], [File Name]
(Folder to which the file is to be saved and the file
name): Any setting
[STORM Image] (whether to display the STORM image during image acquisition):
If this checkbox is selected, the STORM image is previewed during acquisition. Normally, this should be selected.
[Graph] (whether to display a graph during image acquisition):
If this checkbox is selected, a graph showing the number of bright points in the image is
displayed. Normally, this should be selected. [Minimum Height] (minimum intensity):
300 *2
*1 The above number of periods for image acquisition
is a reference value. Adjust it according to the structure or coloring status of the specimen. Even when this value is set to 20000 periods in advance, it is possible to halt the acquisition (for example, at around 10000 periods) by clicking [Finish], if the value is confirmed as being large enough on the real time analysis (preview) screen.
*2 The above-mentioned minimum height is a
reference value. Adjust it according to the amount of background light for the specimen, etc.
Selection of the fluorescent probe
The fluorescent probe cannot be changed on this screen. To change the fluorescent probe in use, click [Settings] and change the relevant setting.
Checkboxes for the lasers
It is not necessary to select the checkboxes for the lasers. (There is no problem, either, if the checkboxes are selected.) When image acquisition starts, the activation laser illuminates the specimen according to the settings specified in the [N-STORM Settings] screen. Also, the checkbox for the imaging laser is automatically selected.
6 Click [Run Now].
Disabling large image mode
If the large image mode is enabled with the ND
Acquisition function of NIS-Elements, images cannot be acquired. Disable the large image mode before clicking [Run Now].
7 Measure the gap between the boundary surface of the
cover glass and the position of the observation target (Z-axis direction) using the method below.
This procedure is not required for
2D-STORM.
(1) Step 1:
When the dialog shown on the right is displayed, select the imaging laser (647 nm). Set the focus to the boundary between the cover glass and the specimen by using the PFS offset controller. Adjust the power to about 50% to 100% by using the slider.
Set the focus to the boundary surface of the cover glass.
When setting the focus, you can identify the boundary surface of the cover glass by moving the XY stage and using the dye molecules that are non-specifically adsorbed onto the boundary surface as boundary marks.
After setting the focus, click [OK]. The XY stage automatically returns to its original position.
(2) Step 2:
When the dialog shown on the right is displayed, set the focus to the target imaging position by using the PFS offset controller.
After setting the focus, click [OK]. The measured gap (Z-axis direction) is automatically saved and used for analysis. 6 7-(1) 7-(2) Cover glass Boundary surface of cover glass Cover glass Imaging target
8 Adjust the power of the activation laser, if necessary, during real time analysis (preview) of the acquired images.
Image acquisition is started. The result of a real time analysis (preview) and a graph are displayed.
Recommended number of bright points
The recommended data for STORM analysis is as follows: the density of bright points is not too low but not so high that they overlap each other. For example, a structure that covers the entire screen (such as a microtubule in a cell) should be provided with about 100 to 200 bright points per frame in a visual field with 256 x 256 pixels. The number of bright points to be activated can be adjusted by changing the power of the activation laser.
Real time analysis (preview) screen during image acquisition
Details of real time analysis
During real time analysis, the value of [Minimum Height] on the N-STORM control window is used as a threshold to analyze bright points. Real time analysis does not include drift correction.
Graphic screen during image acquisition
Zoom magnification Molecular position drawing selection [Cross]/[Gaussian] (Gaussian representation) Thickness of the cross Channel display color
Delete each previously drawn Gaussian
representation/cross from the display. (Molecule position data remains undeleted.)
Period number
Number of bright points per frame of the imaging probe
Period number Graph of the number of bright points
(for the last several frames)
Display width (period count) setting
Automatic scroll on/off Scale setting
: Max, Min
Graph of the number of bright points
After the completion of acquisition, close the real time analysis (preview) and graph windows by clicking [x] in the respective windows.
If you click [Auto LP] in the [N-STORM] control window after adjusting the power of the activation laser, the laser power is automatically adjusted so that the number of bright points is maintained. Also, the upper limit on the power for automatic adjustment can be specified in the [Max] box.
2.3
N-STORM Analysis
Analyze an acquired dataset, perform drift correction, and identify the positions of the fluorescent probe molecules.
1 Click [Analysis GUI] to display the analysis tool.
2 Click [File Open].
A dialog box for selecting a STORM image is displayed.
3 Select the image file (ND2 file) acquired for STORM
analysis and then click [Open]. Saving open data
In the N-STORM analysis window, it is not possible to open two or more ND2 files at once. For this reason, if a new file is opened, the currently open file is closed. If, at this time, the file contains any information that is not saved, a dialog box is displayed.
- If the currently open molecule list (STORM image) has
not yet been saved, the dialog box shown on the right is displayed. To save the molecule list, select [Yes]. If [No] is selected, the latest molecule list will be discarded.
- If the STORM parameter(s) in the currently open ND2
file have not yet been saved, the dialog box shown on the right is displayed. To save the parameter(s) to the ND2 file, select [Yes]. If [No] is selected, any changes made to the parameter(s) will be discarded.
Results of past analysis
If STORM analysis has already been performed on the selected ND2 file such that a corresponding molecule list file exists, a dialog like that shown on the right is displayed. To perform a new STORM analysis, select [No]. (If [Yes] is selected, the saved result of the previous analysis is read.)
1
4 Check the minimum intensity of the bright points to be identified as molecules.
(1) To check the intensity, click [Use Peak
Statistics].
(2) Select the darkest bright point of all those to be identified as molecules, and then position the mouse pointer to its center. Read and write down the value of [Peak Height] (this value is used as the minimum intensity for identifying bright points in the next step). When performing analysis for multiple channels, take this step for each acquisition channel.
5 Configure the settings for identifying bright points.
(1) Click [Identification Settings].
5-(1)
4-(1)
4-(2) Peak Height
(2) In the dialog box, configure the settings as follows. [Minimum Height]:
Specify the minimum intensity of the bright points, which was checked in the previous step. [Maximum Height]: 20000
[CCD Baseline]: 100 [3D]: On
For 2D
[3D]: Off
Click [>>] to configure the settings for Screening. [Minimum Width (nm)]: 200
[Maximum Width (nm)]: 700
For 2D
[Maximum Width (nm)]: 400
[Initial Fit Width (nm)]: 300 [Max Axial Ratio]: 2.5
For 2D
[Max Axial Ratio]: 1.3
[Max Displacement (pix)]: 1
Setting Screening
• The bright point images that are excluded by
Screening of Identification Settings are not displayed on any channel.
• Clicking [Default] resets the Screening settings to the
defaults. If the [3D] checkbox is selected, the settings are reset to the defaults for 3D-STORM. If this checkbox is deselected, the settings are reset to the defaults for 2D-STORM.
When performing analysis for multiple channels, make the above-mentioned settings for each acquisition channel. (Normally, when images are acquired using the same wavelength (for example, 647 nm), the same parameters should be used for all the channels.)
Upon the completion of setting, click [OK]. (3) Click [Start STORM Analysis].
(4) Select [Drift Correction], set [Periods] for [1], and then click [Test].
Test analysis is performed for the currently displayed period.
5-(2)
(5) Upon the completion of the test analysis, the confirmation dialog is displayed. Click [OK]. Make sure that the bright points are identified correctly.
If the intended result is not achieved
If bright points of noise are detected or if bright points of signals are not detected, reconfigure the parameters for
identifying bright points in [Identification Settings]
and then perform the test analysis again.
To analyze only some periods
Using the period slider, the analysis target periods can be specified by right-clicking each of the start and end points of the periods to be analyzed and by then selecting [Set as Start Period] and [Set as End Period]. (6) Click [Start STORM Analysis] again.
(7) Click [Start] to start analysis of the entire dataset. Analysis of bright points is performed for the entire dataset. Upon the completion of the analysis, the confirmation dialog is displayed.
(8) Click [OK].
As soon as the analysis is complete, information on the positions of the molecules is saved in the following two formats.
• Molecule list in binary format
File name: (ND2-file-name)_list.bin
• Drift correctioninformation
File name: (ND2-file-name) +_drift.txt
Both the binary file and the text file are saved to the same location as the ND2 file of the dataset.
5-(7) 5-(5)
Overwriting confirmation dialog
If the result of a past analysis of the analyzed ND file exists in the same folder, a dialog like that shown below is displayed.
To save the result of a previous analysis, select [Yes]. The file name for the results of the previous analysis is changed to [(ND2-file-name)_list-(the-current-date-and-time-yyyy-mm-dd-hh-mm-ss).bin]. The results of the latest
analysis are saved as [(ND2-file-name)_list.bin].
If the result of the previous analysis is unnecessary, select [No]. The result of the latest analysis is saved as
[(ND2-file-name)_list.bin], overwriting the result of the previous analysis.
To move or copy files
When moving or copying files for STORM, handle the ND2 file and the binary (bin) and text (txt) files of the analysis result as a group.
6 Subtract crosstalk. (Only in normal mode. The crosstalk subtraction function is not used for images acquired in continuous mode. For information about whether crosstalk subtraction is required for each image acquisition method, see the table in “3.5 Subtracting Crosstalk.”)
(1) Click [Cross-Talk Subtraction]. (“Xt” stands for crosstalk.)
Preparation for crosstalk subtraction
The preparatory calculation for crosstalk subtraction is automatically performed after STORM analysis. Crosstalk cannot be subtracted until the calculation is complete.
The progress of the calculation is indicated in the status bar at the bottom of the N-STORM analysis window.
When the calculation is complete, becomes
available.
(2) Select the crosstalk measurement radius*1 from
[25.0nm], [50.0nm], and [75.0nm].
*1 Radius of the range (circle for 2D or sphere for
3D) around the target bright point to be used to detect crosstalk for an individual point (recommended value: 25.0 nm). A desired measurement radius can also be set by the user. For details, see “3.5.1 Basic Settings for Crosstalk Subtraction.”
(3) In [Source Channel], select the channel from which crosstalk is to be subtracted. If you select [All], crosstalk can be subtracted from all channels at once.
(4) Select the method and the threshold for crosstalk subtraction.
[Statistical] (recommended): This method classifies
bright points by generating a random number with respect to the probability of crosstalk at each individual point and using the number as a threshold. It can be said to be an analysis method that takes the randomness of STORM into consideration.
[Threshold]: This method classifies bright points by using an arbitrary threshold that the user sets with respect to the probability of crosstalk at each individual point. Analysis is performed assuming that
6-(2) 6-(3)
6-(6) 6-(5)
(6) Click [OK].
The molecules that exceed the threshold are removed from the source channel, and a new channel in which they are to be stored is created. The channel is named [Non Specific Activation-Xt]. (7) Check the image of the [Non Specific Activation-Xt]
channel tab. If there is no problem in merging it with the NSA channel, right-click the tab, select [Merge to NSA from ...], and then select the source channel name.
To cancel the destination, right-click the [Non Specific Activation-Xt] channel tab, select [Undo from NSA-Xt to ...], and then select the source channel name. The state existing before crosstalk subtraction is restored.
(8) If STORM images are acquired on two channels, subtract crosstalk from the other channel in the same way, by following steps (3) to (7). If [All] is selected in step (3), crosstalk is subtracted from all the channels at once. Therefore, it is not necessary to take these steps individually for each channel. If STORM images are acquired on three channels, subtract crosstalk from the other two channels (Alexa405-Alexa647 and Cy3-Alexa647) by following steps (3) to (7). Note that, for the second and subsequent channels, deselect
[Cross-Activation] in step (5). (Cross activation is sufficiently small and does not need to be subtracted.)
7 Click [File Save] to save the STORM parameters.
The parameters for STORM analysis are saved to the ND2 file.
Type of file used by N-STORM
The file formats used by the N-STORM software are as follows.
File type File name Description
ND2 file (ND2-file-name).nd2
Set of conventional images acquired through
NIS-Elements. Parameters for STORM analysis (e.g., Identification Settings, Display Options, Filter Settings) are saved into the ND2 file by selecting the ND2 format in the [File Save] dialog box of the N-STORM analysis window.
Result of STORM analysis in binary format
(ND2-file-name)_list.bin
STORM image (molecule list) created through analysis. This is automatically created by performing N-STORM analysis. It can also be saved by using the [File Save] dialog box in the N-STORM analysis window.
Result of STORM analysis in text format
(Any-file-name).txt
A molecule list can be exported in text format by selecting text format in the [File Save] dialog box of the N-STORM analysis window. This is used to share the results of analysis with other software.
Drift correction data (ND2-file-name)_drift.txt
This file is automatically created by performing drift correction. It is internally used by the N-STORM software.
Open the STORM image on the main screen of NIS-Elements
The currently displayed image can be captured and opened on the main screen of NIS-Elements by clicking [Create New Elements Document from Current View].
Set ROI and zoom in on it
ROI can be set by clicking [Use ROI]. Right-clicking within the specified ROI range displays the ROI range
2.4
Terminating the N-STORM System
Upon completion of the necessary operation, terminate NIS-Elements AR and turn off the microscope, the laser, and other peripheral devices.
1 Terminate NIS-Elements AR.
When MPB Communications Inc.’s 647-nm laser is being used
Follow the procedure below to gradually decrease the output of the 647-nm laser through the GUI-VFL software, and then turn the power off (procedure recommended by the laser maker).
(1) Set the power to 50 mW, click [Activate], and then wait until the value of [Power, mW] becomes about 50 mW.
(2) Then, set the power to 0 mW, click [Activate], and then wait until the value of [Power, mW] becomes 0 mW.
(3) Click [Off] in the Fiber laser window to turn off the 647-nm laser.
2 Shut down the PC.
3 Turn off each laser head.
4 Turn off the microscope.
5 Turn off the piezo Z drive.
6 Turn off the motorized stage and the illumination light source.
(1)
(2)
2.5
Calibration for 3D-STORM and Multi-color Continuous Mode
To perform 3D-STORM analysis, it is necessary to carry out calibration in advance so that the positions in the Z-axis direction are analyzed correctly. For calibration, a dataset (ND2 file) acquired through a predetermined method is used. This
calibration associates the positions in the Z-axis direction with the ellipticity ratio of an unfocused bright point image, allowing the analysis of positions in the Z-axis direction.
When 2D or 3D-STORM images are acquired on multiple wavelengths in multi-color continuous mode, chromatic aberration causes color shifts in 3D (X, Y, and Z) directions. It is necessary to acquire the data for calibration in advance in order to correct such chromatic aberration as well.
In multi-color continuous mode, calibration is also necessary for 2D in order to acquire the parameters for correction at the Z position where the focus is sharpest.
1 Make preparations for acquiring images according to
“2.1 Preparation of the N-STORM System.”
When performing calibration for 3D-STORM (including 3D multi-color continuous mode), put the cylindrical lens into the light path to prepare for acquiring 3D-STORM images. When performing calibration for the 2D multi-color continuous mode, prepare for acquiring 2D-STORM images, with the cylindrical lens removed from the light path.
A fluorescent bead specimen is used for calibration. Recommended fluorescent beads (required fluorescent beads in multi-color continuous mode):
TetraSpeck Microspheres, 0.1 µm Fluorescent Blue/Green/Orange/Dark Red T-7279 (Molecular Probes)
2 Acquire images for calibration.
(1) Click [Settings] in the [N-STORM] control window and display the [N-STORM Settings] window. (2) Select the mode and then click [OK].
The calibration method differs in the following two cases:
a. Normal mode (3D-STORM) or single-color continuous mode (3D-STORM)
b. Multi-color continuous mode (2D or 3D-STORM) (3) Select [3D-STORM] or [2D-STORM] in the
[N-STORM] control window. (For multi-color continuous mode only)
(4) Click [Z-Calibration] in the [N-STORM] control window. (If [Z-Calibration] is not displayed, it is displayed by clicking [Advanced].)
(5) Turn off the PFS.
Click [PFS] in the dialog box to gray out the button.
PFS settings
To perform calibration, it is necessary to turn off the PFS. (6) Click [Up] and [Down] in [Piezo Z Movement] to set
the focus.
Calibration for the multi-color continuous mode
• Acquire images at a location where 10 or more
fluorescent beads that are not clumped exist in the visual field.
• If the fluorescent image of a bead appears to be
divided into two or the airy disk is visible when the focus is moved up or down by 800 nm using the [Up] or [Down] button, readjust the focus by turning the focus adjustment knob of the microscope. (7) Configure the N-STORM acquisition settings.
Specify the folder in which the ND2 file is saved, as well as the file name.
Deselect the [Activation] checkbox. (During calibration with fluorescent beads, the activation laser is not used.)
Set the output of the imaging laser to about 10%. (8) Click [Run Now] to acquire images.
The dialog box on the right is displayed. Do not perform any operation with this dialog box until image acquisition is completed.
Images of 201 periods are automatically acquired in the following order:
• 20 periods at the focal position
• 161 periods from -400 nm to +400 nm with the
focal position regarded as being the origin (Z stack)
• 20 periods at the focal position
(9) When image acquisition is completed, click [Cancel] in the [N-STORM Z-Calibration] window to close the window.
3 Click [Analysis GUI] to display the N-STORM analysis
window.
2-(5)
2-(8)
2-(6) 2-(7)
4 Click [File Open].
A dialog box for selecting a STORM image is displayed.
5 Select the image file (ND2 file) acquired for calibration and then click [Open].
6 Make sure that the data is appropriate for calibration.
Check that the bright point image is not elliptical but circular in the first and last 20 periods.
Automatically adjusting the contrast
The contrast is automatically adjusted by right-clicking the image and then selecting [Auto Scale for Full Image].
If the bright point image is elliptical in the last 20 periods
If the bright point images are circular in the first 20 periods but they are elliptical in the last 20 periods, it may be because the specimen position has been shifted. Make sure that the specimen is fixed properly and then acquire images again.
7 Check the minimum intensity of bright points
(1) Click [Use Peak Statistics].
(2) Select the darkest bright point of all those to be identified as molecules, and move the mouse pointer onto its center. Read and write down the value of [Peak Height]. (This value is used as the minimum intensity for the identification of bright points in the next step.)
A better result can be obtained if you use the image of the 21st period and the image of the 181st period, which are located at the beginning and end of the Z stack, respectively. In multi-color continuous mode, take this step for each channel.
7-(2) 7-(1)
8 Configure the settings for the identification of bright points.
Click [Identification Settings].
In the dialog box, configure the settings as follows. In multi-color continuous mode, configure these settings for each channel individually.
[Minimum Height]:
Specify the minimum intensity, checked in (2) of the previous step.
[Maximum Height]: 20000
[CCD Baseline]: 100
Select the [3D] checkbox. (For 3D only)
Click [>>] to configure the following detailed settings. [Minimum Width(nm)]: 200
[Maximum Width(nm)]: 700
[Initial Fit Width(nm)]: 300
[Max Axial Ratio]: 2.5
[Max Displacement (pix)]: 1 (In analysis for calibration, the value of Max Displacement is always assumed to be 0. This allows bright points recorded in multiple frames to be analyzed as separate molecules, increasing the accuracy of calibration. The user does not need to change the value of Max Displacement for the purpose of calibration.)
Click [OK].
9 Click [Start STORM Analysis].
10 Set [Periods] to [1] and then click [Test].
Note: Be sure to deselect [Drift Correction].
Test analysis is performed for the currently displayed period.
Upon completion of the analysis, the confirmation dialog is displayed.
11 Click [OK].
Make sure that the bright points are identified correctly.
If the intended result is not achieved
If bright points of noise are detected or if bright points of signals are not detected, reconfigure the parameters for identifying bright points in [Identification Settings] and then perform the test analysis again.
12 Click [Start STORM Analysis] again.
8
10
13 Click [Start] to start analysis.
Note: Be sure to deselect [Drift Correction]. Analysis of bright points is performed for the entire dataset. Upon completion of the analysis, the confirmation dialog is displayed.
14 Click [OK].
15 (For 3D-STORM only) Calculate the parameters for Z
calibration and then save them as settings. [Z Calibration] and [XY Warp]
[Z Calibration] is required for 3D analysis, regardless of the mode. In 3D multi-color continuous mode, this calibration is also necessary to correct any Z-direction drift caused by chromatic aberration.
[XY Warp] is the calibration necessary to correct any X- or Y-direction drift caused by chromatic aberration in 2D or 3D multi-color continuous mode.
In 3D multi-color continuous mode, perform both [Z Calibration] and [XY Warp].
(1) Click [Identification Settings] to display the dialog box.
(2) Click [Z Calibration] to display the [Z Calibration] dialog box.
(3) Click [Auto Calibrate].
The calibration parameters are updated.
(4) Click [OK].
The calibration results (coefficients of the calibration curve function) obtained through the procedure above are automatically saved as internal settings in the N-STORM software and automatically applied to subsequent 3D-STORM analysis. 15-(4) 13 15-(2) 14 15-(3)
Checking the results of Z calibration on a graph
Clicking [Graph] in the [Z Calibration] dialog box displays a graph showing the results of calibration. Display the graph of [Wx/Wy vs. Z] if necessary, and check that Wx and Wy intersect nearly at 0 on the horizontal axis and that there is no large gap between the plot data (distributed points) and the fitting data (lines).
Applying the results of Z calibration to an existing dataset
When applying the new calibration result to an existing dataset, see “3.1 Managing Calibration Data.”
Timing of Z calibration
When the objective has been switched or the composition of the STORM buffer has been changed, perform calibration again.
16 (For multi-color continuous mode only) Perform X-
and Y-direction warp calibration (correction of X- and Y-direction drifts caused by color aberration).
(1) Click [Calibrate] in [XY Warp].
(2) Click [OK].
17 Click [OK] to close the dialog box.
16-(1)
Details of the STORM Analysis Window Operations
3.1
Managing Calibration Data
When calibration is performed for 3D-STORM analysis, the parameters obtained as the results (calibration data) are saved in the PC as the internal settings of the N-STORM software (device information of the microscope in use). For information about the calibration procedure, see “2.5 Calibration for 3D-STORM and Multi-color Continuous Mode.”
When an ND2 file for STORM is opened on the N-STORM analysis window for the first time after the file is acquired, the calibration data of the device information is copied to that ND2 file. Note that the data is not copied if the objective used for ND2 file acquisition does not match that used for calibration.
From this point on, the calibration data is stored in each ND2 file and, when analysis is performed, the calibration data of the ND2 file is used, instead of the device information.
Changing the calibration parameters
While you can enter values in the [Z Calibration] dialog box, it is recommended to perform calibration by using the Check the calibration data stored as
the device information in the N-STORM software
After opening the N-STORM analysis window for the first time since starting NIS-Elements (no ND2 file has been read
yet), click and then [Z Calibration].
Check the calibration data stored in the ND2 file
After reading an ND2 file to the N-STORM analysis window, click
and then [Z Calibration].
Clicking [<<] and [>>] lets you check the calibration data for each objective.
[Restore] button (Read from a text file)
[Backup] button (Save as a text file)
[Load] button (Read from a text file)
[Save] button (Save as a text file)