Hanna M. Wallach Shane T. Jensen
Department of Computer Science University of Massachusetts Amherst
Department of Statistics
The Wharton School, University of Pennsylvania
Lee Dicker Katherine A. Heller
Department of Biostatistics Harvard School of Public Health
Engineering Department University of Cambridge
Abstract
Prior distributions play a crucial role in Bayesian approaches to clustering. Two commonly-used prior distributions are the Dirichlet and Pitman-Yor processes. In this paper, we investigate the predictive prob-abilities that underlie these processes, and the implicit “rich-get-richer” characteristic of the resulting partitions. We explore an al-ternative prior for nonparametric Bayesian clustering—the uniform process—for appli-cations where the “rich-get-richer” property is undesirable. We also explore the cost of this process: partitions are no longer ex-changeable with respect to the ordering of variables. We present new asymptotic and simulation-based results for the clustering characteristics of the uniform process and compare these with known results for the Dirichlet and Pitman-Yor processes. We compare performance on a real document clustering task, demonstrating the practical advantage of the uniform process despite its lack of exchangeability over orderings.
1
Introduction
Nonparametric Bayesian models provide a powerful and popular approach to many difficult statistical problems, including document clustering (Zhanget al., 2005), topic modeling (Teh et al., 2006b), and clus-tering motifs in DNA sequences (Jensen and Liu,
Appearing in Proceedings of the 13th International
Con-ference on Artificial Intelligence and Statistics (AISTATS) 2010, Chia Laguna Resort, Sardinia, Italy. Volume 9 of JMLR: W&CP 9. Copyright 2010 by the authors.
2008). The key assumption underlying nonparamet-ric Bayesian models is the existence of a set of random variables drawn from some unknown probability distri-bution. This unknown probability distribution is itself drawn from some prior distribution. The Dirichlet pro-cess is one such prior for unknown probability distri-butions that has become ubiquitous in Bayesian non-parametric modeling, as reviewed by Muller and Quin-tana (2004). More recently, Pitman and Yor (1997) introduced the Pitman-Yor process, a two-parameter generalization of the Dirichlet process. These pro-cesses can also be nested within a hierarchical struc-ture (Tehet al., 2006a; Teh, 2006). A key property of any model based on Dirichlet or Pitman-Yor processes is that the posterior distribution provides a partition of the data into clusters, without requiring that the number of clusters be pre-specified in advance. How-ever, previous work on nonparametric Bayesian clus-tering has paid little attention to the implicita priori “rich-get-richer” property imposed by both the Dirich-let and Pitman-Yor process. As we explore in sec-tion 2, this property is a fundamental characteristic of partitions generated by these processes, and leads to partitions consisting of a small number of large clus-ters, with richer” usage. Although “rich-get-richer” cluster usage is appropriate for some clustering applications, there are others for which it is undesir-able. As pointed out by Welling (2006), there exists a need for alternative priors in clustering models. In this paper, we explore one such alternative prior— the uniform process—which exhibits a very different set of clustering characteristics to either the Dirich-let process or the Pitman-Yor process. The uniform process was originally introduced by Qin et al.(2003) (page 438) as anad hocprior for DNA motif clustering. However, it has received little attention in the subse-quent statistics and machine learning literature and its clustering characteristics have remained largely
unex-plored. We therefore compare the uniform process to the Dirichlet and Pitman-Yor processes in terms of asymptotic characteristics (section 3) as well as char-acteristics for sample sizes typical of those found in real clustering applications (section 4). One fundamental difference between the uniform process and the Dirich-let and Pitman-Yor processes is the uniform process’s lack of exchangeability over cluster assignments—the probability P(c) of a particular set of cluster assign-ments cis not invariant under permutations of those assignments. Previous work on the uniform process has not acknowledged this issue with respect to either inference or probability calculations. We demonstrate that this lack of exchangeability is not a significant problem for applications where a more balanced prior assumption about cluster sizes is desired. We present a new Gibbs sampling algorithm for the uniform pro-cess that is correct for a fixed ordering of the cluster assignments, and show that whileP(c) is not invariant to permuted orderings, it can be highly robust. We also consider the uniform process in the context of a real text processing application: unsupervised clus-tering of a set of documents into natural, thematic groupings. An extensive and diverse array of mod-els and procedures have been developed for this task, as reviewed by Andrews and Fox (2007). These ap-proaches include nonparametric Bayesian clustering using the Dirichlet process (Zhang et al., 2005) and the hierarchical Dirichlet process (Teh et al., 2006a). Such nonparametric models are popular for document clustering since the number of clusters is rarely known a priori, and these models allow the number of clus-ters to be inferred along with the assignments of doc-uments to clusters. However, as we illustrate below, the Dirichlet process still places prior assumptions on the clustering structure: partitions will typically be dominated by a few very large clusters, with overall “rich-get-richer” cluster usage. For many applications, there is no a priori reason to expect that this kind of partition is preferable to other kinds of partitions, and in these cases the uniform process can be a better rep-resentation of prior beliefs than the Dirichlet process. We demonstrate that the uniform process leads to su-perior document clustering performance (quantified by the probability of unseen held-out documents under the model) over the Dirichlet process using a collec-tion of carbon nanotechnology patents (seccollec-tion 6).
2
Predictive Probabilities for
Clustering Priors
Clustering involves partitioning random variablesX = (X1, . . . , XN) into clusters. This procedure is often
performed using a mixture model, which assumes that
each variable was generated by one ofKmixture com-ponents characterized by parameters Φ ={φk}Kk=1:
P(Xn|Φ) = K
X
k=1
P(cn=k)P(Xn|φk, cn=k), (1)
where cn is an indicator variable such that cn = k if
and only if data pointXnwas generated by component
kwith parametersφk. Clustering can then be
charac-terized as identifying the set of parameters responsible for generating each observation. The observations as-sociated with parameters φk are those Xn for which
cn =k. Together, these observations form cluster k.
Bayesian mixture models assume that the parameters Φ come from some prior distributionP(Φ). Nonpara-metric Bayesian mixture models further assume that the probability thatcn=kis well-defined in the limit
as K → ∞. This allows for more flexible mixture modeling, while avoiding costly model comparisons in order to determine the “right” number of clusters or componentsK. From a generative perspective, in non-parametric Bayesian mixture modeling, each observa-tion is assumed to have been generated by first select-ing a set of component parameters φk from the prior
and then generating the observation itself from the corresponding component. Clusters are therefore con-structed sequentially. The component parameters re-sponsible for generating a new observation are selected using thepredictive probabilities—the conditional dis-tribution over component parameters implied by a par-ticular choice of priors over Φ andcn. We next describe
three priors—the Dirichlet, Pitman-Yor, and uniform processes—using their predictive probabilities. For no-tational convenience we defineψnto be the component
parameters for the mixture component responsible for observation Xn, such that ψn =φk whencn=k.
2.1 Dirichlet Process
The Dirichlet process prior has two parameters: a con-centration parameter θ, which controls the formation of new clusters, and a base distribution G0. Under a
Dirichlet process prior, the conditional probability of the mixture component parameters ψN+1 associated
with a new observation XN+1 given the component
parametersψ1, . . . , ψN associated with previous
obser-vationsX1, . . . , XN is a mixture of point masses at the
locations of ψ1, . . . , ψN and the base distribution G0.
VariablesXnandXmare said to to belong to the same
cluster if and only ifψn=ψm.1 This predictive
prob-ability formulation therefore sequentially constructs a partition, since observationXN+1 belongs to an
exist-ing cluster if ψN+1 = ψn for some n ≤ N or a new
cluster consisting only of XN+1 if ψN+1 is drawn
di-rectly fromG0. Ifφ1, . . . , φKare theKdistinct values 1
in ψ1, . . . , ψN and N1, . . . , NK are the corresponding
cluster sizes (i.e.,Nk =P N
n=1I (ψn=φk), then
P(ψN+1|ψ1, . . . , ψN, θ, G0) =
( N
k
N+θ ψN+1=φk∈ {φ1, . . . , φK} θ
N+θ ψN+1∼G0.
(2)
New observation XN+1 joins existing cluster k with
probability proportional toNk(the number of previous
observations in that cluster) and joins a new cluster, consisting ofXN+1only, with probability proportional
toθ. This predictive probability is evident in the Chi-nese restaurant process metaphor (Aldous, 1985). The most obvious characteristic of the Dirichlet pro-cess predictive probability (given by (2)) is the “rich-get-richer” property: the probability of joining an ex-isting cluster is proportional to the size of that clus-ter. New observations are therefore more likely to join already-large clusters. The “rich-get-richer” charac-teristic is also evident in the stick-breaking construc-tion of the Dirichlet process (Sethuraman, 1994; Ish-waran and James, 2001), where each unique point mass is assigned a random weight. These weights are gener-ated as a product of Beta random variables, which can be visualized as breaks of a unit-length stick. Earlier breaks of the stick will tend to lead to larger weights, which again gives rise to the “rich-get-richer” property.
2.2 Pitman-Yor Process
The Pitman-Yor process (Pitman and Yor, 1997) has three parameters: a concentration parameterθ, a base distribution G0, and a discount parameter 0 ≤ α <
1. Together, θ and α control the formation of new clusters. The Pitman-Yor predictive probability is
P(ψN+1|ψ1, . . . , ψN, θ, α, G0) =
(N
k−α
N+θ ψN+1=φk∈ {φ1, . . . , φK}
θ+Kα
N+θ ψN+1∼G0.
(3)
The Pitman-Yor process also exhibits the “rich-get-richer” property. However, the discount parameter α serves to reduce the probability of adding a new obser-vation to an existing cluster. This prior is particularly well-suited to natural language processing applications (Teh, 2006; Wallach et al., 2008) because it yields power-law behavior (cluster usage) when 0< α <1.
2.3 Uniform Process
Predictive probabilities (2) and (3) result in partitions that are dominated by a few large clusters, since new observations are more likely to be assigned to larger clusters. For many tasks, however, a prior over parti-tions that induces more uniformly-sized clusters is de-sirable. The uniform process (Qinet al., 2003; Jensen
and Liu, 2008) is one such prior. The predictive prob-ability for the uniform process is given by
P(ψN+1|ψ1, . . . , ψN, θ, G0) =
( 1
K+θ ψN+1=φk ∈ {φ1, . . . , φK} θ
K+θ ψN+1∼G0.
(4)
The probability that new observationXN+1 joins one
of the existing K clusters is uniform over these clus-ters, and is unrelated to the cluster sizes. Although the uniform process has been used previously for clus-tering DNA motifs (Qinet al., 2003; Jensen and Liu, 2008), its usage has otherwise been extremely limited in the statistics and machine learning literature and its theoretical properties have thus-far not been explored. Constructing prior processes using predictive proba-bilities can imply that the underlying prior results in nonexchangeability. If cdenotes a partition or set of cluster assignments for observationsX, then the par-tition is exchangeable if the calculation of the full prior density of the partition P(c) via the predictive prob-abilities is unaffected by the ordering of the cluster assignments. As discussed by Pitman (1996) and Pit-man (2002), most sequential processes will fail to pro-duce a partition that is exchangeable. The Dirichlet process and Pitman-Yor process predictive probabili-ties ((2) and (3)) both lead to exchangeable partitions. In fact, their densities are special cases of “exchange-able partition probability functions” given by Ishwaran and James (2003). Green and Richardson (2001) and Welling (2006) discuss the relaxation of exchangeabil-ity in order to consider alternative prior processes. The uniform process does not ensure exchangeability: the prior probability P(c) of a particular set of cluster assignments c is not invariant under permutation of those cluster assignments. However, in section 5, we demonstrate that the nonexchangeability implied by the uniform process is not a significant problem for real data by showing that P(c) is robust to permutations of the observations and hence cluster assignments.
3
Asymptotic Behavior
In this section, we compare the three priors implied by predictive probabilities (2), (3) and (4) in terms of the asymptotic behavior of two partition characteris-tics: the number of clusters KN and the distribution
of cluster sizes HN = (H1,N, H2,N, . . . , HN,N) where
HM,Nis the number of clusters of sizeM in a partition
ofNobservations. We begin by reviewing previous re-sults for the Dirichlet and Pitman-Yor processes, and then present new results for the uniform process.
3.1 Dirichlet Process
As the number of observationsN → ∞, the expected number of unique clusters KN in a partition is
E(KN|DP) = N
X
n=1
θ
n−1 +θ ' θlogN. (5)
The expected number of clusters of sizeM is
lim
N→∞E(HM,N|DP) =
θ
M. (6)
This well-known result (Arratia et al., 2003) implies that as N → ∞, the expected number of clusters of sizeM is inversely proportional toM regardless of the value of θ. In other words, in expectation, there will be a small number of large clusters and vice versa.
3.2 Pitman-Yor Process
Pitman (2002) showed that as N → ∞, the expected number of unique clusters KN in a partition is
E(KN|PY)≈
Γ(1 +θ) αΓ(α+θ)N
α. (7)
Pitman’s result can also be used to derive the expected number of clusters of sizeM in a partition:
E(HM,N|PY)≈
Γ(1 +θ)QM−1
m=1(m−α)
Γ(α+θ)M! N
α. (8)
3.3 Uniform Process
Previous literature on the uniform process does not contain any asymptotic results. We therefore present the following novel result for the expected number of unique clustersKN in a partition asN→ ∞:
E(KN|UP)≈
√
2θ·N12. (9)
A complete proof is given in the supplementary ma-terials. In section 4, we also present simulation-based results that suggest the following conjecture for the expected number of clusters of size M in a partition:
E(HM,N|UP)≈θ. (10)
This result corresponds well to the intuition underlying the uniform process: observations area priori equally likely to join any existing cluster, regardless of size.
3.4 Summary of Asymptotic Results
The distribution of cluster sizes for the uniform process is dramatically different to that of either the Pitman-Yor or Dirichlet process, as evidenced by the results
1e+02 5e+02 5e+03 5e+04
5
10
20
50
100
200
500
1000
θθ ==1
N = Number of Observations
Expected Number of Clusters
● ●
● ● ●
● ●
●
● ●
● ●
● ●
● ●
● ●
● DP UN PY (αα ==0.5) PY (αα ==0.25) PY (αα ==0.75)
1e+02 5e+02 5e+03 5e+04
50
100
200
500
1000
2000
θθ ==10
N = Number of Observations
Expected Number of Clusters
● ●
● ●
● ●
● ●
● ●
● ●
● ●
● ●
● ●
● DP UN PY (αα ==0.5) PY (αα ==0.25) PY (αα ==0.75)
1e+02 5e+02 5e+03 5e+04
100
200
500
1000
2000
5000
θθ ==100
N = Number of Observations
Expected Number of Clusters
● ●
● ●
● ●
● ●
● ●
● ●
● ●
● ●
● ●
● DP UN PY (αα ==0.5) PY (αα ==0.25) PY (αα ==0.75)
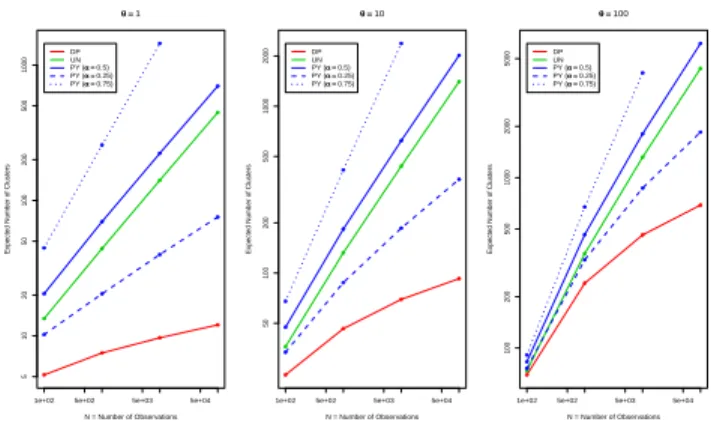
Figure 1: Expected number of clusters ˆKN versus
sam-ple size N for differentθ. Axes are on a log scale.
above, as well as the simulation-based results in sec-tion 4. The uniform process exhibits a uniform distri-bution of cluster sizes. Although the Pitman-Yor pro-cess can be made to behave similarly to the uniform process in terms of the expected number of clusters (by varying α, as described below), it cannot be con-figured to exhibit a uniform distribution over cluster sizes, which is a unique aspect of the uniform process. Under the Dirichlet process, the expected number of clusters grows logarithmically with the number of ob-servationsN. In contrast, under the uniform process, the expected number of clusters grows with the square root of the number of observations N. The Pitman-Yor process implies that the expected number of clus-ters grows at a rate ofNα. In other words, the
Pitman-Yor process can lead to a slower or faster growth rate than the uniform process, depending on the value of the discount parameter α. For α= 0.5, the expected number of clusters grows at the same rate for both the Pitman-Yor process and the uniform process.
4
Simulation Comparisons: Finite
N
The asymptotic results presented in the previous sec-tion are not necessarily applicable to real data where the finite number of observationsN constrains the dis-tribution of cluster sizes,P
MM ·HM,N=N. In this
section, we appraise the finite sample consequences for the Dirichlet, Pitman-Yor, and uniform processes via a simulation study. For each of the three processes, we simulated 1000 independent partitions for various values of sample size N and concentration parameter θ, and calculated the number of clustersKN and
dis-tribution of cluster sizesHN for each of the partitions.
4.1 Number of ClustersKN
In figure 1, we examine the relationship between the number of observationsN and the average number of
● ●● ● ● ●●●●●●●●●●●●●●●●●●●●●●●●●●●●●●●●●●●●●●●●●●●●●●●●●●●●●●●●●●●●●●●●●●●●●●●●●●●●●●●●●●●●●●●● ● ● ● ● ●●●●●●●●●●●●●●●●●●●●●●●●●●●●●●● ● ● ● ● ●● ● ● ● ● ● ● ● ●●●●● ● ● ● ● ●●●●● ● ● ● ● ●●●●●●●●●●●●●●●●●●●● ● ●● ● ● ● ● ● ● ● ● ● ● ●●●● ● ● ● ● ● ● ● ● ●● ● ● ● ● ● ● ● ● ● ● ● ● ● ● ● ● ● ● ● ● ● ● ● ● ● ● ● ● ● ● ● ● ● ● ● ● ● ● ●● ● ● ● ● ● ● ● ● ● ● ● ● ● ● ● ● ● ● ● ● ● ● ● ● ● ● ● ● ● ● ● ● ● ● ● ● ● ● ● ● ● ● ● ● ● ● ● ● ● ● ● ● ● ● ● ● ● ● ● ● ● ● ● ● ● ● ● ● ● ● ● ● ● ●● ● ● ● ● ● ●●●●●●●●●●●●●● ● ●●●●●●●●●● ●●●
1 2 5 10 20 50100200 500
1e−03
1e−01
1e+01
Dirichlet Process: N=1000
cluster size
mean n
umber of clusters
● ●● ● ●●●●● ●●●●●●●●●●●●●●●●●●●●●●●●●●●●●●●●●●●●●●●●●●●●●●●●●●●●●●●●●●●●●●●●●●●●●●●●●●●●●●●●●●●●●●●●●●●●●●●●●●●●●●●●●●●●●●●●●●●●●●●● ● ● ● ● ● ●●●●●●●●●●●●●●●● ● ● ● ● ● ● ● ● ●●●●●●●●●●●●●●●●●●●●●●●●●●●●●●●●● ● ● ● ● ● ● ● ● ● ● ● ●●●●●●●● ● ● ● ● ● ● ● ● ● ● ●●●●● ● ● ● ● ● ● ● ● ● ● ● ● ● ●●●●●●●●●●● ● ● ● ● ● ● ● ● ● ● ●● ● ● ● ● ● ● ● ● ● ● ● ● ● ● ● ● ● ● ● ● ●●●●●●● ● ● ● ● ● ● ● ● ● ● ● ● ● ● ● ● ● ●●●●●●●●●●●● ● ● ● ● ● ● ● ● ● ● ● ● ● ● ●●●●●●●●●●●●●● ● ● ● ● ● ● ● ● ● ● ● ● ● ●● ● ● ● ● ● ● ● ● ● ● ● ● ● ● ● ● ● ● ● ● ● ● ● ● ● ● ● ●●●●●●●● ● ● ● ● ● ● ● ● ● ● ● ● ● ● ● ● ● ● ● ● ● ● ● ●●●● ● ● ● ● ● ● ● ● ● ● ● ● ● ● ● ● ● ● ● ● ● ● ● ● ● ● ● ● ● ●●● ● ● ● ● ● ● ● ● ● ● ● ● ● ● ● ● ● ● ● ● ● ● ● ● ● ● ● ● ● ● ●●●●●●●●●●●●●●●●●●●●●●●●●●●●●●●●●●●● ● ● ● ● ● ● ● ● ● ● ● ● ● ● ● ● ● ● ● ●●●●●●●●●●●●●●●●●●●●●●●●●●●●●●●●●●●● ● ● ● ● ●● ● ● ● ● ● ● ● ● ● ● ● ● ● ● ● ● ● ● ● ●●●● ● ● ● ● ●● ● ● ● ● ● ● ● ● ● ● ● ● ● ● ● ● ● ● ● ● ● ● ● ● ● ● ● ●● ● ● ● ● ● ● ●●●● ● ● ● ● ● ● ● ● ● ● ● ● ● ● ●●● ●● ● ● ●● ● ● ● ● ● ● ●● ● ● ● ● ● ● ● ● ● ● ●●● ● ● ● ● ● ● ● ● ● ● ● ● ● ● ● ● ●● ● ● ● ●●● ●●●● ● ● ● ● ● ● ● ● ● ● ● ● ● ● ● ● ● ● ● ● ● ● ● ● ● ● ● ● ● ● ● ● ● ● ● ● ● ● ●● ● ● ●● ● ● ● ●● ● ● ● ● ● ● ● ● ● ● ● ● ● ● ●● ●● ● ● ● ● ● ●● ●● ● ● ● ● ● ● ● ●● ● ● ● ● ● ● ● ● ● ● ● ●● ●● ● ● ● ● ● ● ● ● ● ● ● ● ● ● ● ●●● ● ● ● ● ● ●● ● ● ● ● ● ● ● ● ● ● ● ● ●● ● ● ● ● ● ● ● ● ●●●● ● ● ● ● ● ● ● ● ● ● ● ● ● ● ● ● ● ● ● ● ● ● ● ● ● ● ● ● ● ● ● ● ● ● ● ● ● ● ● ● ● ● ● ● ● ●● ● ● ●● ●● ● ● ●● ● ● ● ●● ● ● ● ● ● ●●●● ● ● ● ● ● ● ● ●● ● ● ● ● ● ● ● ● ● ● ● ● ● ● ● ● ● ● ● ● ● ● ● ● ●● ● ●● ● ● ● ● ● ● ● ● ● ● ● ● ● ● ● ● ● ● ● ● ● ● ●● ● ● ● ●●● ● ● ● ● ● ● ● ● ●● ● ● ● ● ● ● ● ● ● ● ● ● ●●●● ● ● ● ●● ● ● ●● ● ● ● ● ● ● ● ● ● ● ● ● ●● ● ●● ● ● ● ● ● ● ● ● ● ● ● ●
1 510 50 500 5000
1e−03
1e−01
1e+01
Dirichlet Process: N=10000
cluster size
mean n
umber of clusters
● ●● ● ●●●●●●●●●●●●●●●●●●●●●●●●●●●●●●●●●●●●●●●●●●●●●●●●●●●●●●●●●●●●●●●●●●●●●●●●●●●●●●●●●●●●●●●●●●●●●●●●●●●●●●● ● ● ● ● ● ● ● ● ●●●●●●●●●●●●●●●●●●●●●●●●●●●●●●●●●●●●●●●●●●●●●●●●●●●●●●●●●●●●●●●●●●●●●● ● ● ● ● ● ● ● ● ● ●●●●●●●●●●●●●●●●●●●●●●●●●●●●●●●●●●●●●●●●●●●●●●●● ● ● ● ● ● ● ● ● ● ● ● ● ● ● ● ● ● ● ● ● ● ● ● ●● ● ● ● ● ● ● ● ● ● ● ● ● ● ● ● ● ● ● ● ● ● ● ● ● ● ● ●●●●●●●●●●●●●●●●●●●● ● ● ● ● ● ● ● ● ● ● ● ● ●●●●●●●●●●●●● ● ● ● ● ● ● ● ● ● ● ● ● ● ● ● ● ● ● ● ● ● ● ● ●●● ● ● ● ● ● ● ● ● ● ● ● ● ● ● ● ● ● ● ● ● ● ● ● ● ● ● ● ● ● ● ● ● ● ● ● ● ●●●●●● ● ● ● ● ● ● ● ● ● ● ● ● ● ● ● ● ● ● ● ● ● ● ● ● ● ● ● ● ● ● ● ● ● ● ● ● ● ● ●●●●● ● ● ● ● ● ● ● ● ● ● ● ● ● ● ● ● ● ● ● ● ● ● ● ● ● ● ● ● ● ● ● ● ● ● ● ● ● ● ● ● ● ● ●●●●●●●●●● ● ● ● ● ● ● ● ● ● ● ● ● ● ● ● ● ● ● ● ● ● ● ● ● ● ● ● ● ● ● ● ● ● ● ● ● ● ● ● ● ● ● ●●●●●●●●●●●●●●●●●●●●●●●●●● ● ● ● ● ● ● ● ● ● ● ● ● ● ● ● ● ● ● ● ● ● ● ● ● ● ● ● ● ● ● ● ●●●●●●●● ● ● ● ● ● ● ● ● ● ● ● ● ● ● ● ● ● ● ● ● ● ● ● ● ● ● ● ● ● ● ● ● ● ● ● ● ● ● ● ● ● ● ● ● ● ● ●●●●● ● ● ● ● ● ● ● ● ● ● ● ● ● ● ● ● ● ● ● ● ● ● ● ● ● ● ● ● ● ● ● ● ● ● ● ● ● ● ● ● ● ● ● ● ● ● ● ● ● ● ● ● ●●●●●●●●●●●●●●●●●●●●●●● ● ● ● ● ● ● ● ● ● ● ● ● ● ● ● ● ● ● ● ● ● ● ● ● ● ● ● ● ● ●●●●●●●●●●●●●●●●●●●●●●●●●●●●●●●●●●●●●●●●●●●●●●●●●● ● ● ● ● ● ● ● ● ● ● ● ● ● ● ● ● ● ● ● ● ● ● ● ● ● ● ● ● ● ● ● ● ● ● ●●●●●●●●●●●●●●●●●●●●● ● ●●●●●●●●●●●●●●●●●●●●●●● ● ● ● ● ● ● ● ● ●●●●●●●●●●●●●●●● ● ● ● ● ● ● ● ● ● ● ● ● ● ●● ● ●● ● ● ● ● ● ● ● ● ● ●● ●● ● ● ● ● ● ● ● ●● ● ● ● ● ● ● ●● ● ●● ● ● ● ● ● ● ● ● ● ● ● ● ● ● ● ● ● ● ●●● ● ● ● ● ●● ● ● ● ● ● ● ● ● ● ● ● ● ● ● ●● ● ● ● ● ● ● ● ● ● ● ● ● ● ● ● ●●● ● ●●● ● ● ● ● ● ● ● ● ●● ● ● ● ● ● ● ● ● ●● ●● ● ● ● ● ● ● ● ● ● ● ● ● ● ● ● ● ● ● ● ● ● ● ● ● ● ● ● ● ● ●● ● ● ● ● ● ● ● ● ● ● ● ● ● ● ●● ● ●●● ● ● ● ● ● ● ● ● ● ● ● ● ● ● ● ● ● ● ● ● ● ● ● ● ● ● ● ● ● ● ● ● ● ●● ●● ●●● ● ● ● ● ● ● ● ● ● ● ● ● ● ● ● ● ● ●● ● ●● ● ● ● ● ● ● ● ● ● ●● ● ● ●●●● ● ● ● ● ● ● ● ● ● ●● ● ● ● ● ● ● ● ● ● ● ● ● ● ● ● ● ● ● ● ● ● ● ● ● ● ● ● ● ● ● ● ●● ● ● ●● ●●● ● ●● ● ● ● ● ●●● ● ● ● ● ● ● ●● ● ● ● ● ● ● ●● ● ● ● ● ● ● ● ● ● ●● ● ●●●● ● ● ● ● ● ● ● ● ●●● ● ●● ● ● ● ● ● ● ● ● ● ● ● ● ● ● ● ● ● ●●● ● ● ● ● ● ● ● ● ● ● ● ● ● ● ● ● ● ● ● ● ● ● ● ●● ● ● ● ● ●● ●●● ● ● ● ● ● ● ● ● ● ● ● ● ●●● ● ● ● ● ● ●● ● ● ● ● ● ● ● ● ● ● ● ● ● ● ● ● ● ● ● ● ● ● ● ● ● ● ● ● ● ● ● ● ● ● ● ● ● ●● ● ● ● ● ●●● ● ● ●
1 10 100 1000 10000
1e−03
1e−01
1e+01
Dirichlet Process: N=100000
cluster size
mean n
umber of clusters
● ● ●●● ● ●●●●●●●●●●●●●● ●●●●●●●●●●●●●●●●●●●●●●●●●●●●●●●●●●●●●●●●●●●●●●●●●●●●● ● ● ●●●●●●●● ● ●●●●●●●●●●●●●●●●●●●●●●●●●●● ● ● ●●●●●●●●●●●●●●● ● ● ● ● ● ● ● ●●● ● ● ● ● ● ●●●●●●●●● ●●● ● ● ● ● ● ● ● ● ● ● ● ● ● ● ● ● ● ● ● ● ● ● ● ● ● ● ● ● ● ● ● ● ● ● ● ● ●● ● ● ● ● ● ● ● ● ● ●● ● ● ● ● ● ● ● ● ● ●●● ● ● ● ● ● ● ●●● ● ● ● ● ● ● ● ● ● ● ● ● ● ● ● ● ● ● ● ● ● ● ● ● ● ● ●●● ● ●●●●●●●●●●●● ● ● ● ● ●●●●●● ● ●●●●●●
1 2 5 10 20 50 100200 500
1e−03
1e−01
1e+01
Pitman−Yor (αα ==0.5) : N=1000
cluster size
mean n
umber of clusters
● ● ●● ● ●●●●●●●●●●●●●●●●●●●●●●●●●●●●●●●●●●●●●●●●●●●●●●●●●●●●●●●●●●●●●●●●●●●●●●●●●●●●●●●●●●●●●●●●●●●●●●●●●●●●●●●●●●●●●●●●●●●●●●●●●●●●●●●●●●●●●●●●●●●●●●●●●●●●●●●●●●●●●●●●●●●●●●●●● ● ● ● ● ● ● ● ● ● ● ● ● ●●●●●●●●●●●●●●●●●●●●●●●●●●●●●●●●●●●●●●●●●●●●●●●●●●●●●●● ● ● ● ● ● ● ● ● ● ● ● ● ● ● ● ● ●●●●●●●●●●●●●●●●●●●●●●●●●●●●●●●●●●●●●●●●●●●●●●●●●●●●●●●●●●●●●●●●●●●●●●●●●●●●●●●●●●●●●●●●●●●●●●●●●●●●●●●●● ● ● ● ● ● ● ● ● ● ● ● ● ● ● ● ● ● ● ● ●●●● ● ● ● ● ● ● ● ● ● ● ● ● ● ● ● ● ● ● ● ● ● ● ● ● ●●●●●●●●●●●●●●●●●●●●●●●●● ● ●●●●●●●●●●●●●●●●●●●●●●●●●●●●●●●●●●●●●●●●●●●●●●●●●●●●●●●●● ● ● ● ● ● ● ● ● ● ● ● ● ● ● ● ● ● ● ● ●● ● ● ● ●● ● ● ● ●● ● ● ● ● ● ●● ●● ● ● ● ● ● ●●● ● ● ● ●● ● ● ● ● ● ● ● ●● ● ● ● ●● ● ● ● ● ● ● ● ● ● ● ● ● ● ●● ● ● ● ● ● ● ● ● ● ● ● ● ●●●●● ● ● ● ●● ● ● ● ● ● ● ● ●● ● ●● ● ● ●●●● ● ● ● ●●● ● ● ● ● ● ● ● ● ●● ● ● ● ● ● ● ● ● ● ● ● ●●● ● ● ●● ● ● ● ● ● ● ● ● ● ● ● ● ● ● ● ● ● ● ●●● ●● ● ● ● ● ●● ● ● ● ● ●● ●● ● ● ● ● ● ● ● ● ●● ● ● ● ● ● ● ●● ● ● ● ● ● ●● ●●● ● ● ● ● ● ● ● ●● ● ● ●● ●● ●● ● ● ● ● ● ● ● ● ● ● ● ● ● ● ● ● ● ● ● ● ●● ● ● ● ● ● ● ● ● ●●● ● ● ●● ● ● ● ● ● ● ● ● ● ● ● ● ● ● ● ●● ● ● ● ● ● ● ● ● ● ● ●● ● ● ● ● ●● ● ● ● ● ● ● ● ● ● ● ● ● ● ●● ● ● ● ● ● ● ● ● ● ● ● ● ● ●● ● ● ● ● ● ● ● ● ●● ● ● ● ● ● ● ● ● ● ● ● ● ● ●● ● ● ● ● ● ● ● ● ●● ● ●● ●● ● ● ● ●●● ● ● ●● ● ● ● ● ● ● ● ● ● ● ● ● ● ● ● ● ● ● ● ● ● ● ● ●● ● ● ●● ● ● ● ● ● ● ● ● ● ● ● ● ●● ● ● ● ● ●●● ●● ●● ● ● ● ● ● ●● ● ●● ● ● ● ● ● ● ● ● ● ● ● ● ● ●● ●● ● ● ● ● ● ● ●● ● ● ● ●● ● ● ● ● ● ● ● ● ● ● ● ● ● ●● ●
1 5 10 50 500 5000
1e−03
1e+01
Pitman−Yor (αα ==0.5) : N=10000
cluster size
mean n
umber of clusters
● ●● ●●●●●●●●●● ●●●●●●●●●●●●●●●●●●●●●●●●●●●●●●●●●●●●●●●●●●●●●●●●●●●●●●●●●●●●●●●●●●●●●●●●●●●●●●●●●●●●●●●●●●●●●●●●●●●●●●●●●●●●●●●●●●●●●●●●●●●●●●●●●●●●●●●●●●●●●●●●●●●●●●●●●●●●●●●●●●●●●●●●●●●●●●●●●●●●●●●●●●●●●●●●●●●●●●●●●●●●●●●●●●●●●●●●●●●●●●●●●●●●●●●●●●●●●●●●●●●●●●●●●●●●●●●●●●●●●●●●●●●●●●●●●●●●●●●●●●●●●●●●●●●●●●●●●●●●●●●●●●●●●●●●●●●●●●●●●●●●●●●●●●●●●●●●●●●●●●●●●●●●●●●●●●●●●●●●●●●●●●●●●●●●●●●●●●●●●●●●●●●●●●●●●●●●●●●●●●●●●●●●●●●●●●●●●●●●●●●●●●●●●●●●●●●●●●●●●●●●●●●●●●●●●●●●●●●●●●●●●●●●●●●●●●●●●●● ● ● ● ● ● ● ● ● ● ● ● ● ● ● ● ● ● ● ● ● ● ● ● ● ● ● ● ● ● ●●●●●●●●●●●●●●●●●●●●●●●●●●●●●●●●●●●●●●●●●●●●●●●●●●●●●●●●●●●●●●●●●●●●●●●●●●●●●●●●●●●●●●●●●●●●●●●●●●●●●●●●●●●●●●●●●●●●●●●●●●●●●●●●●●●●●●●●● ● ● ● ● ● ● ● ● ● ● ● ● ● ● ● ● ● ● ● ● ● ● ● ● ● ● ● ● ● ● ● ● ● ● ● ● ● ● ● ● ● ● ● ● ● ● ● ● ● ● ● ● ● ● ● ● ● ● ● ● ● ● ● ● ● ● ● ● ● ● ● ● ● ● ● ● ● ● ● ● ● ● ● ● ● ● ● ● ● ● ● ● ● ● ● ● ● ● ● ● ● ● ● ● ● ● ● ● ● ● ● ● ● ● ● ● ● ● ● ● ● ● ●●●● ● ● ● ● ● ● ● ● ● ● ● ● ● ● ● ● ● ● ● ● ● ● ● ● ● ● ● ● ● ● ● ● ● ● ● ● ● ● ● ● ● ● ● ● ● ● ● ● ● ● ● ● ● ● ● ● ● ● ● ● ● ● ● ● ● ● ● ● ● ● ● ● ● ● ● ● ● ● ●●●●●● ● ● ● ● ● ● ● ● ● ● ● ● ● ● ● ● ● ● ● ● ● ● ● ● ● ● ● ● ● ● ● ● ● ● ● ● ● ● ● ● ● ● ● ● ● ● ● ● ● ● ● ● ● ● ● ● ● ● ● ● ● ● ● ● ● ● ● ● ● ● ● ● ● ● ● ● ● ● ● ● ● ● ● ● ● ●●●●●●●●●●●●●●●●●●●●●●●●●●●●●●●●●●●●●●●●●●●●●●●●● ● ● ● ● ● ● ● ● ● ● ● ● ● ● ● ● ● ● ● ● ● ● ● ● ● ● ● ● ● ● ● ● ● ● ● ● ● ● ● ● ● ● ● ● ● ●●●●●●●●●●●●●●●●●●●●●●●●●●●●●●●●●●●●●●●●●●●●●●●●●● ● ● ● ● ● ● ● ● ● ● ● ● ● ● ● ● ● ● ● ● ● ● ● ● ● ● ● ● ● ● ● ● ● ● ● ● ● ● ● ● ● ● ●●●●●●●●●●●●●●●●●●●●●●●●●●●●●●●●●●●●●●●●●●●●●●●●●●●●●●●●●●●●● ● ● ● ● ● ● ● ● ● ● ● ● ● ● ● ● ● ● ●●●●●●●●●●●●●●●●●●●●●●●●●●●●●●●●●●●●●●●●●●●●●●●●●●●●●●●●●●●●●●●●●●●●●●●●●●●●●●●●●●●●●●●●●●●●●●●●●●●●●●●●●●●●●●●●●●●●●●●●●●●●●●●●●● ● ●● ● ● ● ● ● ●●● ● ● ● ● ● ●● ●●● ● ● ●● ● ● ● ● ● ● ● ● ●● ● ● ● ●●● ● ● ● ● ●● ●● ● ● ●● ● ● ● ● ● ● ● ● ●●● ● ●● ● ● ● ● ● ● ● ● ● ● ● ● ● ●● ● ● ● ● ● ●● ●●●● ● ● ●●●● ● ●● ● ● ● ● ● ●●● ● ● ● ● ● ● ● ● ● ● ● ● ● ● ●● ● ● ● ● ● ● ● ● ● ● ●● ● ● ● ● ● ● ● ●● ● ● ● ● ● ● ● ● ● ● ● ● ● ● ● ● ● ● ● ● ● ● ● ● ● ● ● ● ● ● ● ● ● ● ● ● ● ● ● ●● ● ● ● ● ● ●● ● ● ●● ● ● ● ● ● ● ● ● ● ● ● ● ● ● ● ●● ● ● ● ●● ● ●● ● ● ●●●●● ● ●● ● ● ● ● ● ●●●● ● ● ● ● ● ● ● ●● ●●● ● ● ● ● ● ● ● ● ● ● ● ● ●● ● ● ● ● ●● ● ● ● ● ● ● ● ● ● ● ● ● ● ● ● ● ● ●● ● ● ● ● ●● ● ● ● ● ● ● ● ● ●● ●●● ● ● ● ● ● ● ●● ● ● ● ● ● ● ● ● ●● ● ● ● ● ● ● ● ● ● ● ● ● ●● ● ● ● ● ●●●●● ● ● ● ● ● ● ● ●● ● ● ● ● ● ● ● ● ● ● ● ● ● ● ● ●●● ● ● ● ● ● ● ● ● ● ● ● ● ● ● ● ● ● ● ● ●●● ● ●● ● ● ● ●● ● ● ●● ● ● ● ● ● ● ● ●●● ●●●● ● ● ●● ● ● ● ● ● ● ● ● ● ● ● ● ● ● ● ● ● ●● ● ● ● ● ● ●●●●●●● ● ● ● ● ● ● ● ● ● ● ● ● ● ●● ●●●● ● ● ● ● ●● ● ● ● ● ● ●● ● ● ● ●
1 10 100 1000 10000
1e−03
1e+01
Pitman−Yor (αα ==0.5) : N=100000
cluster size
mean n
umber of clusters
● ● ● ●●●● ● ● ● ● ●●● ●●●● ● ● ● ● ● ● ●● ●● ●
1 2 5 10 20
1e−03 1e−01 1e+01 Uniform: N=1000 cluster size mean n
umber of clusters
● ● ●●● ● ● ● ● ●●●●●●●●●●●●●●●●●●●●●●●●●●●●●●●●●●●● ●●●● ●●●●● ●● ●● ● ● ● ● ● ● ●● ● ● ● ●●●●●
1 2 5 10 20 50
1e−03 1e−01 1e+01 Uniform: N=10000 cluster size mean n
umber of clusters
● ● ●● ● ● ● ●●●●●●●●●●●●●●●●●●●●●●●●●●●●●●●●●●●●●●●●●●●●●●●●●●●●●●●●●●●●●●●●●●●●●●●●●●●●●●●●●●●●●●●●●●●●●●●●●●●●●●●●●●●●●●●●●●●●●●●●●●●●●●●●●●●●●●●●●●●●●●●●●●●●●●●●●●●●●●●●●●● ●●●●●● ● ● ● ●●●● ● ● ● ● ● ●
1 2 5 10 20 50 100 200
1e−03 1e−01 1e+01 Uniform: N=100000 cluster size mean n
umber of clusters
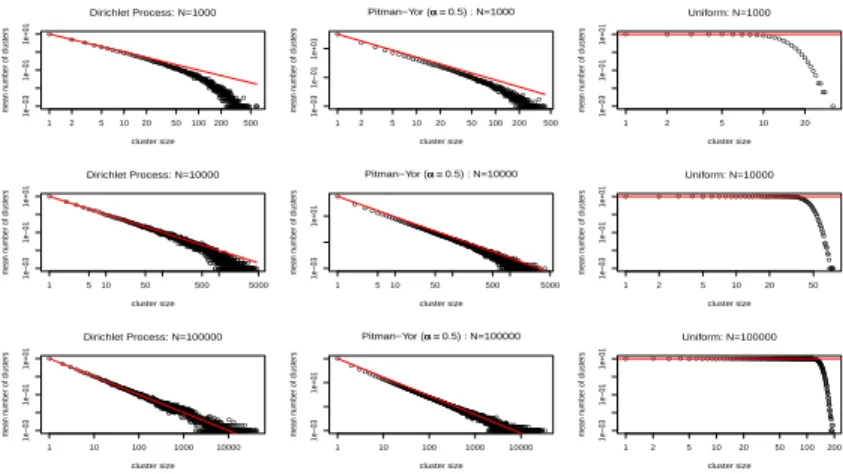
Figure 2: Cluster sizes HM,N as a function of M for different values of N for the Dirichlet, Pitman-Yor, and
uniform processes. Data are plotted on a log-log scale and the red lines indicate the asymptotic relationships. Each point is the average number of clusters (across 1000 simulated partitions) of a particular cluster size.
clusters ˆKN (averaged over the 1000 simulated
parti-tions). For α= 0.5, the Pitman-Yor process exhibits the same rate of growth of ˆKN as the uniform process,
confirming the equality suggested by (7) and (9) when α= 0.5. As postulated in section 3.2, the Pitman-Yor process can exhibit either slower (e.g., α = 0.25) or faster (e.g.,α= 0.75) rates of growth of ˆKN than the
uniform process. The rate of growth of ˆKN for the
Dirichlet process is the slowest, as suggested by (5).
4.2 Distribution of Cluster Sizes
In this section, we examine the expected distribution of cluster sizes under each process. For brevity, we focus only on concentration parameter θ = 10, though the same trends are observed for other values ofθ. Figure 2 is a plot of ˆHM,N (the average number of clusters of
size M) as a function of M. For each process, ˆHM,N
was calculated as the average over the 1000 simulated independent partitions of HM,N under that process.
The red lines indicate the asymptotic relationships, i.e., (6) for the Dirichlet process, (8) for the Pitman-Yor process, and (10) for the uniform process. The results in figure 2 demonstrate that the simulated distribution of cluster sizes for the uniform process is quite different to the simulated distributions of clusters sizes for either the Dirichlet or Pitman-Yor processes. It is also interesting to observe the divergence from the asymptotic relationships due to the finite sample sizes, especially in the case of small N (e.g.,N = 1000).
5
Exchangeability
As mentioned in section 2, the uniform process does not lead to exchangeable partitions. Although the exchangeability of the Dirichlet and Pitman-Yor
pro-cesses is desirable, these clustering models also exhibit the “rich-get-richer” property. Applied researchers are routinely forced to make assumptions when modeling real data. Even though the use of exchangeable priors can provide many practical advantages for clustering tasks, exchangeability itself is one particular model-ing assumption, and there are situations in which the “rich-get-richer” property is disadvantageous. In real-ity, many data generating processes are not exchange-able,e.g., news stories are published at different times and therefore have an associated temporal ordering. If one is willing to make an exchangeability assumption, then the Dirichlet process prior is a natural choice. However, it comes with additional assumptions about the size distribution of clusters. These assumptions will be reasonable in certain situations, but less rea-sonable in others. It should not be necessary to restrict applied researchers to exchangeable models, which can impose other undesired assumptions, when alterna-tives do exist. The uniform process sacrifices the ex-changeability assumption in order to make a more bal-anced prior assumption about cluster sizes.
In this section, we explore the lack of exchangeabil-ity of the uniform process by first examining, for real data, the extent to which P(c) is affected by permut-ing the observations. For any particular orderpermut-ing of observations X = (X1, . . . , XN), the joint probability
of the corresponding cluster assignmentscis
P(c|ordering 1, . . . , N) =
N
Y
n=1
P(cn|c<n) (11)
where “c<n” denotes the cluster assignments for
ob-servations X1, . . . , Xn−1 and P(cn|c<n) is given by
(4). Clearly, exhaustive evaluation ofP(c) for all pos-sible orderings (permutations of observations) is not possible for realistically-sized data sets. However, we
0.25 0.5 1 2 5 10 Concentration Parameter
Standard Deviation of log P(c)
0
20
40
60
80
100
Between-Ordering SD Between-Partition SD
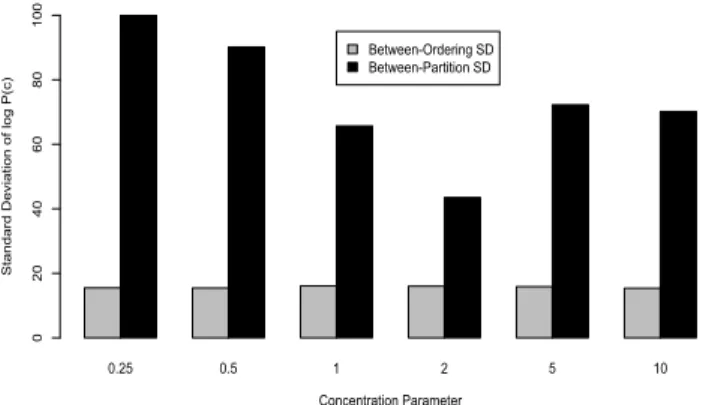
Figure 3: Comparison of the “Between-Partition SD” and the “Between-Ordering SD” (averaged over differ-ent inferred partitions) for the uniform process with six different values of concentration parameter θ.
can evaluate the robustness of P(c) to different or-derings as follows: for any given partition c (set of cluster assignments), we can compute the standard de-viation of logP(c) over multiple different orderings of the observations. This “between-ordering SD” gives an estimate of the degree to which the ordering of ob-servations affects P(c) for a particular partition. For any given ordering of observations, we can also com-pute the standard deviation of logP(c) over multiple different partitions (realizations of c) inferred using the Gibbs sampling algorithm described below. This “between-partition SD” gives an estimate of the vari-ability of inferred partitions for a fixed ordering. Figure 3 shows the “between-ordering SD” and the “between-partition SD” for partitions of 1000 carbon nanotechnology patent abstracts (see next section), obtained using five Gibbs sampling chains and 5000 or-derings of the data with different values ofθ. The vari-ability between orderings is considerably smaller than the variability between partitions, suggesting that uni-form process clustering results are not significantly sensitive to different orderings. These results are en-couraging for applications where one is willing to sac-rifice exchangeability over orderings in favor of a more balanced prior assumption about cluster sizes.
6
Document Clustering Application
In this section, we compare the Dirichlet process and the uniform processes on the task of clustering real documents—specifically, the abstracts of 1200 carbon nanotechnology patents. Dirichlet processes have been used as the basis of many approaches to document clustering including those of Zhanget al. (2005), Zhu et al.(2005) and Wallach (2008). In practice, however, there is often little justification for the a priori “rich-get-richer” property exhibited by the Dirichlet process.
We consider a nonparametric word-based mixture model where documents are clustered into groups on the basis of word occurrences. The model assumes the following generative process: The tokenswdthat
com-prise each document, indexed byd, are drawn from a document-specific distribution over words φd, which is itself drawn from a document-specific Dirichlet dis-tribution with base disdis-tribution nd and concentration
parameterβ. The document-specific base distribution is obtained by selecting a cluster assignment from the uniform process. If an existing cluster is selected, then ndis set to the cluster-specific distribution over words
for that cluster. If a new cluster is selected, then a new cluster-specific distribution over words is drawn from G0, andnd is set to that distribution:
cd|c<d ∼
( 1
d−1+θ cd=k∈1, . . . , K θ
d−1+θ cd=knew
(12)
nk ∼ G0 (13)
φd ∼ Dir (φd|ncd, β) (14)
wd ∼ Mult (φd), (15)
where cd is the cluster assignment for the dth
doc-ument. Finally, G0 is chosen to be a hierarchical
Dirichlet distribution: G0 = Dir (nc|β1n), where
n∼Dir (n|β0u). This model captures the fact that
documents in different clusters are likely to use differ-ent vocabularies, yet allows the word distribution for each document to vary slightly from the word distri-bution for the cluster to which that document belongs. The key consequence of using either a Dirichlet or uni-form process prior is that the latent variables nd are
partitioned into C clusters where the value ofC does not need to be pre-specified and fixed. The vectorc de-notes the cluster assignments for the documents: cdis
the cluster assignment for documentd. Given a set of observed documents W = {wd}Dd=1, Gibbs sampling
(Geman and Geman, 1984) can be used to infer the latent cluster assignments c. Specifically, the cluster assignmentcd for documentdcan be resampled from
P(cd|c\d,w, θ)∝
P(cd|c\d, θ)· P(wd|cd,c\d,W\d,β), (16)
where c\d and W\d denote the sets of clusters and
documents, respectively, excluding document d. The vectorβ= (β, β1, β0) represents the concentration
pa-rameters in the model, which can be inferred fromW
using slice sampling (Neal, 2003), as described by Wal-lach (2008). The likelihood component of (16) is
P(wd|cd,c\d,W\d,β) =
Nd
Y
n=1
Nw<d,n n|d +β
N<d,n
wn|cd+β1
Nwn<d,n+β0 1
W
P
w Nw<d,n+β0 P
wN <d,n w|cd+β1
P
wN
<d,n
w|d +β
where the superscript “< d, n” denotes a quantity in-cluding data from documents 1, . . . , d and positions 1, . . . , n−1 only for document d. Nw|d is the number
of times word type w occurs in documentd, Nw|cd is the number of times woccurs in cluster cd, andNwis
the number of times woccurs in the entire corpus. The conditional prior probabilityP(cd|c\d, θ) can be
constructed using any of the predictive probabilities in section 2. For brevity, we focus on the (commonly-used) Dirichlet process and the uniform process. For the Dirichlet process, the conditional prior probabil-ity is given by (2). Since the uniform process lacks exchangeability over observations, we condition upon an arbitrary ordering of the documents,e.g., 1, . . . , D. The conditional prior ofcd givenc\d is therefore
P(cd|c\d, θ, ordering 1, . . . , D)∝
P(cd|c1, . . . , cd−1, θ)
D
Y
m=d+1
P(cm|c1, . . . , cm−1, θ), (18)
whereP(cd|c1, . . . , cd−1, θ) is given by (4). The latter
terms propagate the value of cd to the cluster
assign-mentscd+1, . . . , cDfor the documents that follow
doc-ument d in the chosen ordering. With this definition of the conditional prior, the Gibbs sampling algorithm is a correct clustering procedure forW, conditioned on the arbitrarily imposed ordering of the documents. We compare the Dirichlet and uniform process pri-ors by using the model (with each prior) to cluster 1200 carbon nanotechnology patent abstracts. For each prior, we use Gibbs sampling and slice sampling to infer cluster assignments ctrain and β for a
sub-set Wtrain of 1000 “training” abstracts. Since the
results in section 5 indicate that the variability tween partitions is greater than the variability be-tween orderings, we use a single ordering of Wtrain
and perform five runs of the Gibbs sampler. To pro-vide insight into the role of θ, we compare results for several θ values. We evaluate predictive perfor-mance by computing the probability of a held-out set
Wtest of 200 abstracts given each run from the trained
model. We compute logP(Wtest| Dtrain, θ,β) =
logP
ctestP(Wtest,ctest| Dtrain, θ,β), where Dtrain =
(Wtrain,ctrain) and the sum overctestis approximated
using a novel variant of (Wallachet al., 2009)’s “left-to-right” algorithm (see supplementary materials). We average this quantity over runs of the Gibbs sampler for Wtrain, runs of the “left-to-right” algorithm, and
twenty permutations of the held-out dataWtest.
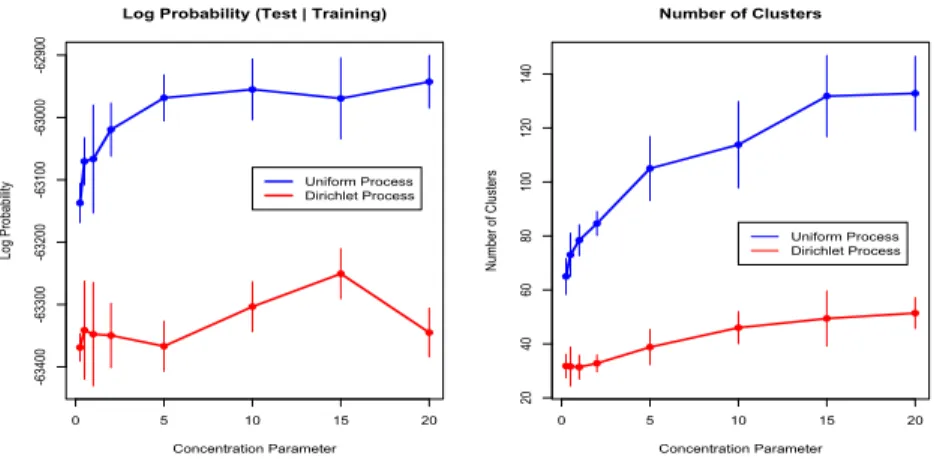
The left-hand plot of figure 4 compares the Dirichlet and uniform processes in terms of logP(Wtest| Dtrain, θ,β). Regardless of the value
of concentration parameter θ, the model based on
the uniform process leads to systematically higher held-out probabilities than the model based on the Dirichlet process. In other words, the uniform process provides a substantially better fit for the data in this application. The right-hand plot of figure 4 compares the Dirichlet and uniform processes in terms of the average number of clusters in a representative partition obtained using the Gibbs sampler. The uniform process leads to a greater number of clusters than the Dirichlet process for each value ofθ. This is not surprising given the theoretical results for the a priori expected cluster sizes (section 3) and the fact that the choice of clustering prior is clearly influential on the posterior distribution in this application.
7
Discussion
The Dirichlet and Pitman-Yor processes both exhibit a “rich-get-richer” property that leads to partitions with a small number of relatively large clusters and vice versa. This property is seldom fully acknowl-edged by practitioners when using either process as part of a nonparametric Bayesian clustering model. We examine the uniform process prior, which does not exhibit this “rich-get-richer” property. The uniform process prior has received relatively little attention in the statistics literature to date, and its clustering characteristics have remained largely unexplored. We provide a comprehensive comparison of the uniform process with the Dirichlet and Pitman-Yor processes, and present a new asymptotic result for the square-root growth of the expected number of clusters under the uniform process. We also conduct a simulation study for finite sample sizes that demonstrates a sub-stantial difference in cluster size distributions between the uniform process and the Pitman-Yor and Dirichlet processes. Previous work on the uniform process has ignored its lack of exchangeability. We present new re-sults demonstrating that although the uniform process is not invariant to permutations of cluster assignments, it is highly robust. Finally, we compare the uniform and Dirichlet processes on a real document clustering task, demonstrating superior predictive performance of the uniform process over the Dirichlet process.
Acknowledgements
This work was supported in part by the Center for Intelli-gent Information Retrieval, in part by CIA, NSA and NSF under NSF grant #IIS-0326249, and in part by subcon-tract #B582467 from Lawrence Livermore National Secu-rity, LLC, prime contractor to DOE/NNSA contract #DE-AC52-07NA27344. Any opinions, findings and conclusions or recommendations expressed in this material are the au-thors’ and do not necessarily reflect those of the sponsor.
0 5 10 15 20
-63400
-63300
-63200
-63100
-63000
-62900
Log Probability (Test | Training)
Concentration Parameter
Log Probability
Uniform Process Dirichlet Process
0 5 10 15 20
20
40
60
80
100
120
140
Number of Clusters
Concentration Parameter
Number of Clusters
Uniform Process Dirichlet Process
Figure 4: Left: Average log probability of held-out data given the trained model. Vertical lines indicate one SD across runs of the Gibbs sampler forWtrain, runs of the evaluation algorithm and (for the uniform process)
twenty permutations of the held-out data. Right: The average number of clusters in a representative partition from each trained model. Vertical lines indicate one SD across runs of the Gibbs sampler for Wtrain.
References
Aldous, D. (1985). Exchangeability and related topics. In
´
Ecole d’ ´Et´e de Probabilit´es de Saint-Flour XIII-1983, 1– 198. Springer, Berlin.
Andrews, N. O. and Fox, E. A. (2007). Recent
develop-ments in document clustering. Tech. Rep. TR-07-35,
Virginia Tech Department of Computer Science.
Arratia, R., Barbour, A., and Tavare, S. (2003).
Logarith-mic Combinatorial Structures: a Probabilistic Approach. Monographs in Mathematics. European Mathematical Society, Zurich, Switzerland.
Geman, S. and Geman, D. (1984). Stochastic relaxation, Gibbs distributions, and the Bayesian restoration of
im-ages. IEEE Transaction on Pattern Analysis and
Ma-chine Intelligence 6, 721–741.
Green, P.J. and Richardson, S. (2001). Modelling
hetero-geneity with and without the Dirichlet process
Scandi-navian Journal of Statistics 28, 355–375.
Ishwaran, H. and James, L. (2001). Gibbs sampling
meth-ods for stick-breaking priors. Journal of the American
Statistical Association 96, 161–173.
Ishwaran, H. and James, L. F. (2003). Generalized
weighted Chinese restaurant processes for species
sam-pling mixture models. Statistica Sinica13, 1211–1235.
Jensen, S. and Liu, J. (2008). Bayesian clustering of
tran-scription factor binding motifs.Journal of the American
Statistical Association 103, 188–200.
Muller, P. and Quintana, F. A. (2004). Nonparametric
Bayesian data analysis. Statistical Science 19, 95–110.
Neal, R. M. (2003). Slice sampling. Annals of Statistics
31, 705–767.
Pitman, J. (1996). Some developments of the
Blackwell-MacQueen urn scheme In Statistics, Probability and
Game Theory, IMS Lecture Notes - Volume 30, pp. 245–
267.
Pitman, J. (2002). Combinatorial stochastic processes.
Tech. Rep. 621, Department of Statistics, University of California at Berkeley.
Pitman, J. and Yor, M. (1997). The two-parameter
Poisson-Dirichlet distribution derived from a stable
sub-ordinator. Annals of Probability 25, 855–900.
Qin, Z. S., McCue, L. A., Thompson, W., Mayerhofer, L., Lawrence, C. E., and Liu, J. S. (2003). Identification of co-regulated genes through Bayesian clustering of
pre-dicted regulatory binding sites. Nature Biotechnology
21, 435–439.
Sethuraman, J. (1994). A constructive definition of
Dirich-let priors. Statistica Sinica 4, 639–650.
Teh, Y., Jordan, M., Beal, M., and Blei, D. (2006a).
Hi-erarchical Dirichlet processes. Journal of the American
Statistical Association 101, 1566–1581.
Teh, Y. W. (2006). A hierarchical Bayesian language model
based on Pitman-Yor processes. InACL 2006.
Teh, Y. W., Jordan, M. I., Beal, M. J., and Blei, D. M.
(2006b). Hierarchical Dirichlet processes.Journal of the
American Statistical Association 101, 1566–1581. Wallach, H., Murray, I., Salakhutdinov, R., and Mimno, D.
(2009). Evaluation methods for topic models. In 26th
International Conference on Machine Learning.
Wallach, H., Sutton, C., and McCallum, A. (2008). Bayesian modeling of dependency trees using
hierarchi-cal Pitman-Yor priors. InWorkshop on Prior Knowledge
for Text and Language, 15–20, Finland.
Wallach, H. M. (2008). Structured Topic Models for
Lan-guage. Ph.D. thesis, University of Cambridge.
Welling, M. (2006). Flexible priors for infinite mixture
models. Workshop on Learning with Non-parametric
Bayesian Methods.
Zhang, J., Ghahramani, Z., and Yang, Y. (2005). A prob-abilistic model for online document clustering with
ap-plication to novelty detection. In Advances in Neural
Information Processing Systems 17. MIT Press.
Zhu, X., Ghahramani, Z., and Lafferty, J. (2005). Time-sensitive Dirichlet process mixture models. Tech. rep., School of Computer Science, Carnegie Mellon Univer-sity.