User Manual
ST Visual Develop
(STVD)
Introduction
Welcome to ST Visual Develop (STVD). STVD is a powerful, integrated development environment for ST microcontrollers. This Windows-based environment provides interfaces for all phases of application development, from building and debugging your application, to programming your ST microcontroller.
New features described in this document are not present in earlier versions of STVD. This document will help you get started developing your application with STVD. It includes: ■ Detailed descriptions of STVD’s user interface and features
■ Information about STVD features that are specific to your debugging hardware ■ Tutorials to help you learn to use STVD’s build, debug and program features
Features
■ For building your application, STVD supports ST Assembler-Linker, Cosmic C, Raisonance C and Metrowerks C toolsets. Its graphics interface provides easy access to a range of options when building your application for debugging or programming your microcontroller.
■ For debugging your application, STVD supports a complete range of in-circuit debugging, emulation hardware, and advanced debugging features, including advanced breakpoints and trace recording that will make application development easy and fast. It can also be used as a stand-alone tool, providing a software simulation of your
microcontroller’s behavior as it runs your application.
■ For programming, STVD provides a programming interface that is based on ST Visual Programming (STVP) software and supports a complete range of hardware for in-circuit, in-situ and socket programming.
Contents
1
Introduction . . . 18
1.1
Building and debugging applications . . . 18
1.2
Programming your microcontroller . . . 19
1.3
Advanced debugging features . . . 19
1.4
Getting assistance . . . 21
1.5
Associated documentation . . . 21
1.6
Conventions . . . 22
2
Getting started with STVD . . . 23
2.1
Set the toolset and path information . . . 23
2.2
Create a workspace with a new project . . . 23
2.2.1 Create a new workspace . . . 24
2.2.2 Create a project in your workspace . . . 25
2.2.3 Specify a target MCU for your project . . . 25
2.3
Add source files (.asm, .c, .s) to your project . . . 27
2.4
Build your application . . . 28
2.4.1 Configuring project settings for Debug or Release . . . 28
2.4.2 Build commands and output . . . 29
2.5
Select and connect to your debug instrument . . . 30
2.6
Debug your application . . . 32
2.7
Program your application to your microcontroller . . . 32
3
Your STVD graphical environment . . . 34
3.1
The main application window . . . 34
3.2
The main menus and their commands . . . 36
3.3
View windows . . . 40
3.4
Workspace window . . . 41
3.5
Editor windows . . . 43
3.5.1 Editor window contextual menu . . . 49
3.5.2 Editing features . . . 49
3.6
Output window . . . 56
3.6.2 Find in Files 1 & Find in Files 2 tabs . . . 58
3.6.3 Debug tab . . . 58
3.6.4 Console tab . . . 58
3.7
Customizing your work environment . . . 60
3.7.1 Customizing editor features . . . 61
3.7.2 Customizing toolbars . . . 65
3.7.3 Adding custom commands . . . 67
3.8
Tooltips . . . 69
3.9
Help and support features . . . 70
3.10
Migrating old workspaces (STVD7 2.5.4 and prior versions) . . . 71
4
Project creation and build . . . 75
4.1
Specifying a toolset . . . 75
4.2
Loading and creating workspaces (.stw) . . . 76
4.2.1 Loading an existing workspace . . . 76
4.2.2 Creating a new workspace . . . 78
4.3
Creating and loading projects in a workspace . . . 80
4.3.1 Loading an existing project . . . 80
4.3.2 Creating new projects . . . 80
4.3.3 Adding and removing folders and files . . . 83
4.4
Project build configurations . . . 83
4.5
Configuring project settings . . . 84
4.5.1 General settings tab . . . 85
4.5.2 Debug settings tab . . . 86
4.5.3 MCU selection tab . . . 86
4.5.4 Pre-link settings tab . . . 87
4.5.5 Post-build settings tab . . . 87
4.6
Customizing build settings for ST Assembler/Linker toolset . . . 88
4.6.1 ST ASM tab . . . 89
4.6.2 ST Link tab . . . 90
4.6.3 ST Post-Link tab . . . 92
4.7
Customizing build settings for Cosmic C toolsets . . . 93
4.7.1 Cosmic C compiler tab . . . 95
4.7.2 Cosmic C Assembler tab . . . 107
4.7.3 Cosmic C linker tab . . . 110
4.8.1 Raisonance C compiler tab . . . 118
4.8.2 Raisonance Assembler tab . . . 125
4.8.3 Raisonance C linker tab . . . 127
4.9
Customizing build settings for Metrowerks C toolset . . . 131
4.9.1 Metrowerks C Compiler tab . . . 133
4.9.2 Metrowerks Assembler tab . . . 143
4.9.3 Metrowerks linker tab . . . 148
4.10
Configuring folder and file settings . . . 156
4.10.1 General settings for files and folders . . . 156
4.10.2 Custom build tab . . . 157
4.11
Specifying dependencies between projects . . . 158
4.12
Build commands . . . 158
5
Basic debugging features . . . 160
5.1
Selecting the debug instrument . . . 161
5.1.1 Identify your debug instrument . . . 161
5.1.2 Add communication ports . . . 162
5.2
Configuring your target MCU . . . 164
5.2.1 Memory map . . . 164
5.2.2 On-chip peripherals . . . 166
5.3
Running an application . . . 167
5.3.1 Run commands . . . 167
5.3.2 Stepping modes . . . 168
5.3.3 Program and STVD status bar display . . . 169
5.3.4 Monitoring execution in source windows . . . 169
5.4
Editor debug actions . . . 169
5.4.1 Editor debug margin . . . 172
5.4.2 QuickWatch window . . . 174
5.5
Disassembly window . . . 175
5.6
Online assembler . . . 178
5.7
Memory window . . . 180
5.7.1 Viewing memory contents . . . 180
5.7.2 Viewing features . . . 181
5.8
Instruction breakpoints . . . 183
5.8.1 Setting an instruction breakpoint . . . 183
5.8.3 Setting counters and conditions . . . 184
5.8.4 Showing breakpoints . . . 185
5.9
Data breakpoints . . . 186
5.9.1 Inserting data breakpoints . . . 186
5.9.2 Using the Data Breakpoints window . . . 187
5.10
Call stack window . . . 188
5.11
Local variables window . . . 190
5.12
Watch window . . . 191
5.13
Core registers window . . . 192
5.14
MSCI tools window . . . 194
5.15
Symbols browser . . . 195
5.16
Peripheral registers window . . . 196
5.17
Memory trace window . . . 198
5.18
Online commands . . . 199
5.18.1 The load command . . . 199
5.18.2 The output_file command . . . 199
5.18.3 The stimuli command . . . 199
5.18.4 The symbol-file command . . . 200
5.18.5 The save_memory command . . . 200
5.18.6 The help command . . . 200
5.19
Limitations and discrepancies . . . 200
6
Simulator features . . . 202
6.1
Using the stack control features . . . 202
6.2
Using the input pin stimulator . . . 203
6.3
Using the simulation plotter . . . 207
6.3.1 Plotter selection window . . . 208
6.3.2 Plotter window . . . 209
6.4
Using read/write on-the-fly . . . 220
6.5
Forcing interrupts . . . 221
7
In-circuit debugging . . . 223
7.1
Connecting to and configuring the microcontroller . . . 224
7.1.1 Connecting the hardware for in-circuit debugging . . . 224
7.1.3 Ignoring option bytes (ICC only) . . . 226
7.1.4 Configuring option byte settings . . . 226
7.2
Using breakpoints . . . 228
7.2.1 Software breakpoints . . . 228
7.2.2 Hardware breakpoints . . . 229
7.2.3 Setting advanced breakpoints . . . 230
7.2.4 Advanced breakpoint options . . . 232
7.3
Creating a break on trigger input (TRIGIN) . . . 233
7.4
In-circuit debugging in hot plug mode (SWIM only) . . . 233
7.5
In-circuit debugging limitations . . . 234
8
DVP and EMU2 (HDS2) emulator features . . . 237
8.1
Working with output triggers . . . 237
8.2
Using hardware events . . . 237
8.2.1 The hardware event window and contextual menu . . . 238
8.2.2 Adding a hardware event . . . 239
8.3
Trace recording . . . 242
8.3.1 Trace contextual menu . . . 242
8.3.2 Viewing trace contents . . . 245
8.4
Using hardware testing . . . 246
8.5
Logical analyser (EMU2 emulators only) . . . 248
8.5.1 Defining logical analyser events . . . 248
8.5.2 Advanced breaks using the logical analyser . . . 251
8.5.3 Trace filtering using the logical analyser . . . 252
8.6
Stack control window (DVP emulators) . . . 254
8.7
Trigger/trace settings (DVP emulators) . . . 255
8.7.1 Working with output triggers (DVP) . . . 255
9
STice features . . . 258
9.1
Trace recording . . . 258
9.1.1 Trace buffer fields . . . 258
9.1.2 Trace contextual menu . . . 262
9.1.3 Emulator commands . . . 265
9.2
Coverage and profiling . . . 266
9.2.1 Configuring the coverage and profiling settings . . . 267
9.2.3 Reading coverage and profiling results . . . 272
9.2.4 Typical examples of use . . . 276
10
EMU3 emulator features . . . 284
10.1
Trace recording . . . 284
10.1.1 Trace buffer fields . . . 284
10.1.2 Trace contextual menu . . . 286
10.1.3 Emulator commands . . . 290
10.2
Using advanced breakpoints . . . 291
10.2.1 Defining advanced breakpoints . . . 292
10.2.2 Memory access events . . . 296
10.2.3 Other types of events . . . 300
10.2.4 Enabling advanced breakpoints . . . 301
10.2.5 Starting with trace ON . . . 301
10.2.6 The configuration summary . . . 301
10.2.7 Synoptic representation of advanced breakpoints . . . 302
10.2.8 Saving and loading advanced breakpoints . . . 304
10.2.9 Advanced breakpoint examples . . . 304
10.3
Programming trace recording . . . 309
10.4
Using output triggers . . . 313
10.4.1 Trigger programming examples . . . 314
10.5
Using analyzer input signals . . . 317
10.5.1 Analyzer input examples . . . 318
10.6
Performance analysis . . . 319
10.6.1 Running a performance analysis . . . 319
10.6.2 Using the Run/Stop/Continue commands . . . 320
10.6.3 Viewing results . . . 321
10.7
Read/write on the fly . . . 323
10.8
Performing automatic firmware updates . . . 324
11
Program . . . 325
11.1
Configuring general programming settings . . . 325
11.2
Assigning files to memory areas . . . 328
11.3
Configuring option byte settings . . . 329
12
STM8 C tutorial . . . 332
12.1
Setup . . . 333
12.1.1 Install the toolset and configure the STVD . . . 333
12.1.2 Create a workspace . . . 334
12.1.3 Create a project . . . 334
12.1.4 Add the source files . . . 337
12.1.5 Create a folder to organize files in the project . . . 338
12.2
Build . . . 339
12.2.1 Specify the target STM8 . . . 339
12.2.2 Customize the C compiler options . . . 340
12.2.3 Change build settings for a specific file . . . 342
12.2.4 Build the application . . . 343
12.3
Start debugging . . . 344
12.3.1 Start the debugging session . . . 344
12.3.2 Run and stop the application . . . 345
12.3.3 Step through the application . . . 346
12.4
Instruction breakpoints . . . 347
12.4.1 Set an instruction breakpoint . . . 348
12.4.2 Set a counter on an instruction breakpoint . . . 349
12.4.3 Set a condition on an instruction breakpoint . . . 350
12.5
View execution . . . 351
12.5.1 View calls to the stack . . . 351
12.5.2 View and change local variables . . . 351
12.5.3 View variables using the Watch, QuickWatch and Memory windows . 352
12.6
Perform memory mapping . . . 355
12.7
Advanced emulator features for EMU3 (ST7) and STice (STM8) . . . 356
12.7.1 View program execution history . . . 357
12.7.2 Use read/write on-the-fly . . . 358
12.7.3 Set an advanced breakpoint . . . 360
12.7.4 Run a coverage and profiling session . . . 363
12.7.5 Run a performance analysis . . . 363
13
ST Assembler/Linker build tutorial . . . 366
13.1
Create a new workspace with the New Workspace wizard . . . 366
13.2
Create a project using Add New Project to Workspace command . . . 367
13.4
Creating a folder to organize files in the project . . . 370
13.5
Project settings . . . 370
13.6
Build a version for debugging . . . 372
13.7
Building a version for programming . . . 373
Appendix A
Product support . . . 377
A.1
Software updates . . . 377
A.2
Hardware spare parts . . . 377
A.2.1 Sockets . . . 377
A.2.2 Connectors . . . 377
A.3
Getting prepared before you call . . . 378
List of tables
Table 1. Debugging configurations and supported hardware . . . 18
Table 2. Programming configurations and supported hardware . . . 19
Table 3. Advanced debugging features . . . 19
Table 4. Associated documentation . . . 21
Table 5. Default files and folders for projects . . . 27
Table 6. Edit menu commands . . . 36
Table 7. Project menu commands . . . 37
Table 8. Debug Instrument menu commands. . . 38
Table 9. Tools menu commands . . . 39
Table 10. Window menu commands . . . 39
Table 11. Help menu commands . . . 39
Table 12. View windows . . . 40
Table 13. Common contextual menu commands . . . 42
Table 14. Window-specific contextual menu commands . . . 43
Table 15. Editor supported file formats . . . 44
Table 16. Regular expressions . . . 55
Table 17. Options window tabs. . . 60
Table 18. Edit and print options . . . 62
Table 19. Word wrap options . . . 62
Table 20. Debug options. . . 63
Table 21. Long line indicator options . . . 63
Table 22. Line endings options . . . 64
Table 23. Syntax highlighting options . . . 64
Table 24. Toolbar options . . . 65
Table 25. Migration strategy advantages and disadvantages . . . 72
Table 29. Supported toolsets and file formats . . . 75
Table 30. Formats for OBSEND output . . . 92
Table 31. Cosmic C compiler memory models for ST7 . . . 96
Table 32. Cosmic C compiler memory models for STM8 . . . 97
Table 33. Cosmic C compiler debug information options . . . 100
Table 34. Cosmic C compiler optimization options . . . 101
Table 35. Cosmic C compiler language options . . . 103
Table 36. Cosmic C compiler listing options . . . 104
Table 37. Cosmic C compiler output options . . . 107
Table 38. Cosmic Assembler debug options . . . 109
Table 39. Cosmic Assembler language options . . . 109
Table 40. Cosmic Assembler listing options . . . 110
Table 41. Cosmic linker output options. . . 115
Table 42. Raisonance C compiler optimization options . . . 122
Table 43. Raisonance C compiler language options . . . 123
Table 44. Raisonance C compiler listing options . . . 124
Table 45. Raisonance assembler listing options . . . 126
Table 46. Raisonance linker output options . . . 130
Table 47. Metrowerks C compiler memory models. . . 134
Table 48. Metrowerks C compiler optimization options . . . 137
Table 49. Metrowerks C compiler input options . . . 139
Table 50. Metrowerks C compiler output options . . . 141
Table 52. Metrowerks C compiler language options. . . 143
Table 53. Metrowerks assembler language options . . . 147
Table 54. Metrowerks linker optimization options . . . 151
Table 55. Metrowerks linker output options . . . 153
Table 56. Toolchain specific tabs . . . 156
Table 57. Build commands . . . 159
Table 58. Debug instrument types . . . 161
Table 59. Memory types . . . 164
Table 60. Debug menu run commands . . . 167
Table 61. Editor contextual menu commands . . . 170
Table 62. Stimuli file syntax . . . 207
Table 63. Tab contextual menu . . . 211
Table 64. Display area contextual menu . . . 211
Table 65. Name column contextual menu . . . 212
Table 66. Zoom commands . . . 213
Table 67. Marker commands . . . 215
Table 68. Plotter tab management commands . . . 216
Table 69. Item display controls . . . 217
Table 70. Interrupt mapping . . . 222
Table 71. ICD-incompatible option byte settings . . . 227
Table 72. Flash memory limitation on HDFlash devices. . . 235
Table 73. Advanced breakpoint programming summary . . . 307
Table 74. Advanced breakpoints summary . . . 307
Table 75. Advanced breakpoints summary . . . 309
Table 76. Advanced breakpoints summary . . . 310
Table 77. Advanced breakpoints summary . . . 311
Table 78. Advanced breakpoints summary . . . 311
Table 79. Advanced breakpoints summary . . . 311
Table 80. Advanced breakpoints summary . . . 312
Table 81. Advanced breakpoints summary . . . 315
Table 82. Advanced breakpoints summary . . . 315
Table 83. Advanced breakpoints summary . . . 317
Table 84. Advanced breakpoints summary . . . 319
Table 85. Tutorial sections and applicable debug instrument. . . 332
Table 86. Advanced breakpoint configuration . . . 361
List of figures
Figure 1. New Workspace window. . . 24
Figure 2. New project window . . . 25
Figure 3. MCU selection dialog box . . . 26
Figure 4. Workspace window . . . 26
Figure 5. Open window . . . 27
Figure 6. Workspace window . . . 28
Figure 7. Project configurations window . . . 29
Figure 8. Output window Build tab . . . 29
Figure 9. Debug instrument selection . . . 30
Figure 10. Debug instrument target port selection . . . 31
Figure 11. Hot Plug start debug option . . . 31
Figure 12. Restart with SWIM off option . . . 32
Figure 13. Programmer window . . . 33
Figure 14. Main application window . . . 35
Figure 15. Status bar . . . 35
Figure 16. Workspace window tabs . . . 42
Figure 17. Scintilla text editor copyright notice . . . 44
Figure 18. Editor window file display and editing features . . . 45
Figure 19. File folding display and controls . . . 46
Figure 20. Left margin features . . . 47
Figure 21. Bookmark icons . . . 47
Figure 22. Status bar elements . . . 48
Figure 23. Window controls . . . 48
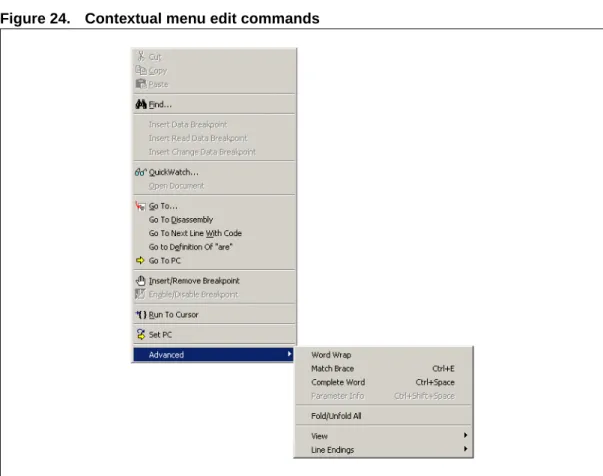
Figure 24. Contextual menu edit commands . . . 49
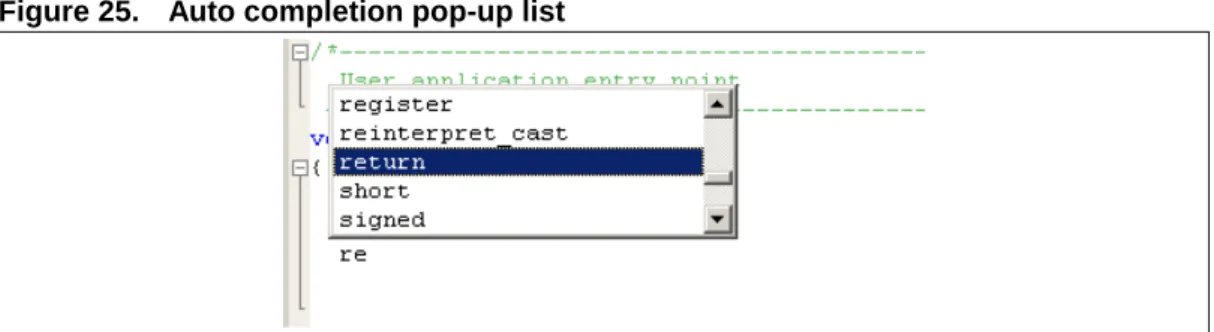
Figure 25. Auto completion pop-up list . . . 50
Figure 26. Parameter information tip . . . 51
Figure 27. Auto indentation . . . 51
Figure 28. Brace matching . . . 52
Figure 29. Find dialog box . . . 53
Figure 30. Quick find for strings or variables in a source file . . . 53
Figure 31. Find/replace window . . . 54
Figure 32. Find in Files dialog box . . . 54
Figure 33. Look in additional folders . . . 54
Figure 34. Find in Files tabs. . . 55
Figure 35. Go To window . . . 55
Figure 36. Output window . . . 56
Figure 37. Output window contextual menu. . . 57
Figure 38. Output window Build tab . . . 57
Figure 39. Parser error selection options . . . 58
Figure 40. Output window Find in Files tab . . . 58
Figure 41. Output window, Console tab . . . 59
Figure 42. Console tab contextual menu . . . 59
Figure 43. Options and Customize windows . . . 60
Figure 44. Edit/Debug and Styles/Languages tabs . . . 61
Figure 45. Standard toolbars . . . 65
Figure 46. Adding new custom toolbars. . . 66
Figure 47. Options window, Commands tab . . . 67
Figure 49. Adding custom commands . . . 68
Figure 50. Customized command in Tools menu . . . 69
Figure 51. Tooltips . . . 69
Figure 52. Tool description . . . 70
Figure 53. Generate Information File for Support window . . . 71
Figure 54. Toolset options . . . 76
Figure 55. Workspace window . . . 77
Figure 56. Project parameters . . . 81
Figure 57. Default project contents . . . 81
Figure 58. MCU selection tab . . . 86
Figure 59. ST ASM tab . . . 89
Figure 60. ST Link tab . . . 90
Figure 61. ST Post-Link tab . . . 92
Figure 62. Standard options. . . 94
Figure 63. Customizing options . . . 94
Figure 64. Cosmic C compiler general view . . . 95
Figure 65. Cosmic C debug information view . . . 100
Figure 66. Cosmic C compiler optimizations view . . . 101
Figure 67. Cosmic C language view . . . 103
Figure 68. Cosmic C compiler listing view . . . 104
Figure 69. Cosmic C compiler preprocessor view . . . 105
Figure 70. Cosmic C compiler input view. . . 106
Figure 71. Cosmic C compiler output view for ST7(left) and STM8 (right). . . 106
Figure 72. Cosmic Assembler general view. . . 107
Figure 73. Cosmic Assembler debug view. . . 108
Figure 74. Cosmic linker general view . . . 110
Figure 75. Cosmic linker input view . . . 112
Figure 76. Cosmic linker output view . . . 115
Figure 77. Standard options. . . 117
Figure 78. Customizing options . . . 117
Figure 79. Raisonance C compiler general view for ST7 (left) and STM8 (right). . . 118
Figure 80. Raisonance C compiler optimizations view. . . 121
Figure 81. Raisonance C compiler language view. . . 122
Figure 82. Raisonance C compiler listings view . . . 123
Figure 83. Raisonance C compiler preprocessor view. . . 124
Figure 84. Raisonance Assembler general view . . . 125
Figure 85. Raisonance linker general view . . . 127
Figure 86. Raisonance linker input view . . . 129
Figure 87. Raisonance linker output view . . . 130
Figure 88. Standard options. . . 132
Figure 89. Customizing options . . . 133
Figure 90. General category view . . . 133
Figure 91. Metrowerks C compiler optimizations view . . . 137
Figure 92. Metrowerks C compiler input view . . . 139
Figure 93. Metrowerks C compiler output view . . . 140
Figure 94. Metrowerks C compiler listing view. . . 142
Figure 95. Customizing C language view . . . 143
Figure 96. Metrowerks Assembler general view . . . 144
Figure 97. Metrowerks Assembler language view . . . 146
Figure 98. Metrowerks Assembler listings view . . . 147
Figure 99. Metrowerks linker general view . . . 148
Figure 101. Customizing Metrowerks linker output view . . . 152
Figure 102. Metrowerks linker PRM view . . . 153
Figure 103. Identify debug instrument and connection . . . 161
Figure 104. Add an Ethernet connection . . . 163
Figure 105. Add a USB connection . . . 163
Figure 106. Memory mapping . . . 165
Figure 107. Specifying a new memory zone . . . 166
Figure 108. On-chip peripherals . . . 166
Figure 109. Debugger status on status bar . . . 169
Figure 110. Watch pop-up for variables . . . 171
Figure 111. Editor window margin icons and contextual menu . . . 172
Figure 112. Brown breakpoint icon in Disassembly window . . . 173
Figure 113. Call Stack frame indicator . . . 174
Figure 114. QuickWatch window . . . 175
Figure 115. Disassembly window . . . 175
Figure 116. PC in editor window . . . 176
Figure 117. Program halted at breakpoint . . . 177
Figure 118. “Grayed” breakpoint . . . 177
Figure 119. “Brown” breakpoint . . . 178
Figure 120. Disassembly window contextual menu . . . 178
Figure 121. Online assembler dialog box . . . 179
Figure 122. Online ST7 instruction set. . . 179
Figure 123. Online assembler dialog box . . . 180
Figure 124. Memory window . . . 181
Figure 125. Memory contextual menu . . . 181
Figure 126. Fill Memory dialog box . . . 182
Figure 127. Save Memory to File dialog box . . . 182
Figure 128. Restore memory configuration dialog box . . . 183
Figure 129. Instruction breakpoints window. . . 184
Figure 130. Instructions breakpoints contextual menu . . . 185
Figure 131. Inserting write data breakpoint . . . 187
Figure 132. Data breakpoints window (EMU2) . . . 188
Figure 133. Data breakpoints window (DVP and Simulator) . . . 188
Figure 134. Call stack window and interaction with other debug windows . . . 189
Figure 135. Stepping backwards in call stack . . . 190
Figure 136. Local Variables and Call Stack windows . . . 190
Figure 137. Watch window. . . 191
Figure 138. Watch contextual menu . . . 192
Figure 139. Concurrent IT registers . . . 193
Figure 140. Nested IT registers . . . 193
Figure 141. Simulator time registers (Simulator only) . . . 193
Figure 142. Simulator instruction counter (Simulator only) . . . 193
Figure 143. MSCI Tools . . . 194
Figure 144. Symbols Browser — variables . . . 195
Figure 145. Symbols browser—types . . . 196
Figure 146. Peripheral registers window . . . 197
Figure 147. Peripheral registers contextual menu . . . 197
Figure 148. Forced read warning . . . 198
Figure 149. ST7 Emulation Discrepancies window . . . 201
Figure 150. Stack control window . . . 202
Figure 151. Configuration setup window . . . 203
Figure 153. Define a periodic signal . . . 205
Figure 154. Trigger an input signal on-the-fly . . . 206
Figure 155. Select elements for plotting . . . 208
Figure 156. View plotted elements. . . 210
Figure 157. No information to plot . . . 213
Figure 158. Scroll controls . . . 214
Figure 159. Select items for export in VCD format . . . 218
Figure 160. Select items for printing . . . 220
Figure 161. Memory and Watch windows with Read/Write on the fly . . . 221
Figure 162. MCU configuration window . . . 225
Figure 163. Setting the option byte values. . . 228
Figure 164. ST7-ICD emulator advanced breakpoints window . . . 230
Figure 165. Disable instruction breakpoints prompt. . . 231
Figure 166. Disabled instruction breakpoints . . . 231
Figure 167. Hardware events window for EMU2 emulator. . . 238
Figure 168. Hardware event settings window for EMU2 emulator . . . 239
Figure 169. Hardware event settings window for DVP2 . . . 240
Figure 170. Hardware events window (EMU2 emulators) . . . 240
Figure 171. Hardware events window (DVP2 emulators) . . . 241
Figure 172. Hardware events settings dialog box (EMU2 emulators) . . . 241
Figure 173. Hardware events settings dialog box (DVP2 emulators) . . . 241
Figure 174. Trace contextual menu . . . 243
Figure 175. Columns dialog box for DVP emulators . . . 243
Figure 176. Columns dialog box for EMU2 emulators . . . 243
Figure 177. Trace display filter dialog box . . . 244
Figure 178. Save Trace Contents dialog box. . . 245
Figure 179. EMU2 emulator trace window . . . 245
Figure 180. DVP2/DVP3 trace window . . . 245
Figure 181. Hardware Test dialog box (DVP version) . . . 247
Figure 182. Hardware test underway (EMU2 emulator version) . . . 247
Figure 183. Logical Analyser mode selection . . . 248
Figure 184. Logical analyser window . . . 249
Figure 185. Defining an event . . . 250
Figure 186. Event 1 as programmed . . . 251
Figure 187. Defining an advanced breakpoint . . . 252
Figure 188. Defining an advanced breakpoint (continued) . . . 252
Figure 189. Trace filtering options . . . 253
Figure 190. Trace filtering event schematics . . . 254
Figure 191. Stack Control window . . . 254
Figure 192. Configuration setup window . . . 255
Figure 193. Trigger/Trace Settings window . . . 256
Figure 194. DVP1 trigger settings . . . 257
Figure 195. DVP2 trigger/trace settings . . . 257
Figure 196. STice trace window. . . 259
Figure 197. Trace contextual menu . . . 262
Figure 198. Trace Display Filter dialog box . . . 263
Figure 199. Saving trace contents . . . 264
Figure 200. Show/hide columns. . . 265
Figure 201. Customized trace window . . . 265
Figure 202. Data coverage and occurrence profiling settings window. . . 268
Figure 203. Code coverage and profiling settings window . . . 268
Figure 205. Code coverage and profiling analysis: functions/instructions view . . . 273
Figure 206. Sort results . . . 274
Figure 207. Data coverage and profiling analysis: data view. . . 275
Figure 208. Data coverage and profiling analysis: source view . . . 276
Figure 209. Lines not covered by test suite . . . 277
Figure 210. Source view of test suite . . . 278
Figure 211. Coverage and Profiling Analysis of test suite after a longer wait . . . 278
Figure 212. Stack memory in Data View tab of the Coverage and Profiling Analysis . . . 279
Figure 213. Stack space details . . . 279
Figure 214. Bottleneck detection: top level . . . 281
Figure 215. Bottleneck detection: intermediate level . . . 281
Figure 216. Bottleneck detection: bottom level . . . 282
Figure 217. EMU3 trace window . . . 285
Figure 218. Trace contextual menu . . . 287
Figure 219. Trace Display Filter dialog box . . . 288
Figure 220. Saving trace contents . . . 289
Figure 221. Show/hide columns. . . 290
Figure 222. Customized trace window . . . 290
Figure 223. Setting timestamp clock . . . 291
Figure 224. Advanced breakpoints window—level 1 programming . . . 293
Figure 225. Defining a counter. . . 294
Figure 226. Defining Level 1, Event 1 . . . 295
Figure 227. Then window. . . 296
Figure 228. Memory events . . . 297
Figure 229. Memory Access dialog box . . . 297
Figure 230. Memory Access with Data dialog box . . . 298
Figure 231. Opcode Fetch dialog box . . . 299
Figure 232. Opcode Fetch with Data dialog box . . . 300
Figure 233. Other events . . . 300
Figure 234. Emulator commands in trace contextual menu. . . 301
Figure 235. Advanced breakpoints configuration summary . . . 302
Figure 236. Graphical synoptic sequence . . . 302
Figure 237. Configuration enabled. . . 303
Figure 238. Configuration disabled . . . 304
Figure 239. Programming the memory access . . . 305
Figure 240. Memory access dialog box . . . 305
Figure 241. Programming Then . . . 306
Figure 242. Enabling the configuration . . . 306
Figure 243. Programming memory access with data. . . 308
Figure 244. Configuration summary of program . . . 308
Figure 245. Configuration summary. . . 309
Figure 246. Calling function my_lib . . . 310
Figure 247. Output trigger action modes . . . 314
Figure 248. Programmed window . . . 315
Figure 249. Programming level 1 . . . 316
Figure 250. Programming Advanced Breakpoints window . . . 317
Figure 251. Defining events using Analyzer probe signals . . . 318
Figure 252. Specifying an Analyzer probe value with bit mask . . . 318
Figure 253. Performance Analysis dialog box . . . 320
Figure 254. Statistics compiled by performance analysis . . . 321
Figure 255. Graphical representation of performance analysis . . . 322
Figure 257. Emulator update window . . . 324
Figure 258. Programmer settings view . . . 325
Figure 259. Programmer, memory areas view. . . 328
Figure 260. Programmer, option byte view . . . 329
Figure 261. Programmer program view . . . 330
Figure 262. Options menus . . . 333
Figure 263. Workspace information . . . 334
Figure 264. Project parameters . . . 335
Figure 265. MCU selection . . . 336
Figure 266. Default project contents . . . 336
Figure 267. Project with source file and dependencies . . . 338
Figure 268. Select the MCU. . . 340
Figure 269. C compiler options for Raisonance . . . 341
Figure 270. C compiler options for Cosmic . . . 342
Figure 271. Exclude the makefile from build . . . 343
Figure 272. Select the debug instrument . . . 344
Figure 273. Activate the Watch Pop-up feature . . . 345
Figure 274. Application is stopped at the cursor position . . . 346
Figure 275. Step over line 242 to line 243 . . . 347
Figure 276. View the value of nbOfTransitions . . . 348
Figure 277. Instruction breakpoints . . . 349
Figure 278. Setting counter . . . 349
Figure 279. Setting condition . . . 350
Figure 280. Condition met . . . 350
Figure 281. Call Stack window. . . 351
Figure 282. QuickWatch window . . . 352
Figure 283. QuickWatch window . . . 352
Figure 284. Watch window. . . 353
Figure 285. Memory and Watch windows . . . 354
Figure 286. Watch window. . . 354
Figure 287. MCU configuration . . . 356
Figure 288. Trace contextual menu . . . 357
Figure 289. Saving trace contents . . . 358
Figure 290. Memory and Watch windows . . . 359
Figure 291. Evolution of variables in Watch window . . . 359
Figure 292. Location of bookmarks . . . 360
Figure 293. Setting advanced breakpoints . . . 361
Figure 294. Synoptic view of advanced breakpoint configuration . . . 362
Figure 295. Advanced breakpoint info in trace . . . 363
Figure 296. Setting up a performance analysis . . . 364
Figure 297. Performance analysis results . . . 364
Figure 298. QuickWatch . . . 365
Figure 299. New performance analysis results . . . 365
Figure 300. Create a new project. . . 367
Figure 301. Arrange the files . . . 369
Figure 302. Define a value (-d) . . . 371
Figure 303. Exclude file from build. . . 372
Figure 304. Change the build configuration . . . 374
1 Introduction
This chapter summarizes the features that are detailed later in this manual.
1.1
Building and debugging applications
For building your application, STVD supports ST Assembler-Linker, Cosmic C, Raisonance C and Metrowerks C toolsets. Its graphic interface provides easy access to a range of options when building your application for debugging or programming your microcontroller. When debugging your application, STVD supports a complete range of in-circuit debugging and emulation hardware. It can also be used as a stand-alone tool, providing a software simulation of your microcontroller’s behavior as it runs your application.
Depending on your microcontroller and hardware configuration you choose, STVD provides you with Advanced debugging features that make application development easy and fast. Table 1. Debugging configurations and supported hardware
Debugging
configuration Hardware development tools
Application board connection
Simulation No hardware necessary
In-circuit debugging (ICC or SWIM)
ST7-ICD (STMC) debugger ST7-DVP3 series emulator
ST7-EMU3 series emulator with ICC add-on Raisonance RLink in-circuit debugger/programmer ST7-STICK
ST-LINK in-circuit debugger/programmer for STM8 (SWIM)
STice advanced emulation system
Connect to the MCU with on-chip Debug Module, installed on your application board.
Emulation
ST7-DVP2 series emulator ST7-DVP3 series emulator ST7-EMU3 series emulator
ST7-EMU2 series emulator (formerly HDS2) ST7-STICK
STiceadvanced emulation system
Connect to your application board in place of your microcontroller.
1.2 Programming
your
microcontroller
When you are ready to program your application to your microcontroller, STVD provides a programming interface based on ST Visual Programming (STVP) software which supports a complete range of hardware for in-circuit, in-situ and socket programming.
1.3
Advanced debugging features
Depending on the debugging configuration you choose, STVD supports a full range of advanced debugging features, including advanced breakpoints and trace recording. Table 3
provides a summary of STVD’s advanced debugging features for common debugging configurations.
Table 2. Programming configurations and supported hardware
Programming
configuration Hardware development tools Application board connection
In-circuit programming (ICC)
ST7-STICK
ST7-DVP3 series emulator
ST7-EMU3 series emulator with ICC add-on ST7xxxx-EPB
Raisonance RLink in-circuit debugger/programmer
Connect to the ST7(2)Fxxxx microcontroller on your application board.
In-situ programming
ST7-DVP2 series emulator ST7-EPB2 series emulator
Connect to the ST72Cxxxx microcontroller on your application board.
Socket programming
ST7SB socket board with an ICP capable programming tool ST7xxxx-EPB
ST7xxxx-DVP and DVP2 series emulators
Table 3. Advanced debugging features
Debugging configuration Features
Simulator
(STVD software only)
– Data breakpoints on read/write access
– Specify the address for the stack overflow or underflow point – Input stimulator for pin level simulations
– Plotter for view the evolution of simulated signals and the values of variables and registers
ST7-ICD with ST7
– Unlimited software-based breakpoints
– Hardware breakpoints that can be combined to generate advanced breakpoints, including break on: read/write access, data value at an address, a stack write, Opcode fetch, and some combinations such as an Opcode fetch OR data access at an address.
ST7-DVP series emulator
– Output signals triggered by advanced breakpoints
– Trace recording and trace filtering capability (256 hardware cycles for DVP2, 512 hardware cycles for DVP3)
– Specify the address for the stack overflow point – Data breakpoint on address read and/or write access – Hardware test feature for troubleshooting your emulator – In-circuit debugging and programming via ICC connection
ST7- EMU2 series emulator
– Output signals triggered by hardware events
– Trace recording and trace filtering capability (1K hardware cycles) – Data breakpoint on address read and/or write access
– Logical analyzer controls breaks in application execution or trace recording based on multiple conditions
– Hardware Test feature for trouble shooting your emulator
ST7-EMU3 series emulator – Output signals triggered by advanced breakpoints
– Trace recording and trace filtering capability (256K hardware cycles) – Instruction breakpoints on Opcode fetch
– Advanced breakpoints control breaks in application execution or trace recording based on multiple, nested conditions
– Non-intrusive read/write of variable during emulation with Read/Write on-the-fly – Application performance analysis with graphical display measures real execution
time of specified portions of code
– In-circuit debugging and programming via ICC add-on
STice emulation
configuration
– Advanced breakpoints with up to 4 levels of user-configured conditions – Application profiling for execution time or number of executions at instruction,
source code or function level
– Unlimited instruction breakpoints for the entire MCU memory space – Control of application memory accesses configurable at byte level – Trace of 128K records with time stamp
– Data breakpoints
– Non-intrusive read/write to memory and internal registers during emulation – CPU frequency from 250Hz up to 50MHz.
– Power supply follower managing application voltages in the range 1.65V to 5.5V (0.8V is possible for MEB with a specific TEB)
STiceICD configuration
– In-circuit debugging/programming via the SWIM protocol Table 3. Advanced debugging features
1.4 Getting
assistance
For more information, application notes, FAQs and software updates on all the ST microcontroller families, check out the CD-ROM or our web site: www.st.com.
For assistance on all ST microcontroller subjects, or for help using your emulator, refer to
Appendix A: Product support.
1.5 Associated
documentation
This manual is released with STVD version 4.0.1 and contains some features that are not present in earlier versions of STVD. For information about setting up and connecting the hardware intended for use with STVD, refer to the documents listed in Table 4.
Table 4. Associated documentation
Hardware Supporting documentation
MCUs ST7
STM8
ST7xxxx datasheet STM8xxxx datasheet
ICD devices
ST7-ICD (STMC) debugger ST7-ICD User Manual ST7-EMU3 series emulator with ICC Add-on ST7-EMU3 User manual
ST7-DVP series emulator ST7-DVPx Emulator User Manual
ST7-STICK ST7 Flash STICK User Manual
STiceadvanced emulation system STiceadvanced emulation system for
ST microcontrollers User Manual
Emulators
ST7-DVP series emulator ST7-DVPx Emulator User Manual ST7xxxx-DVPx Probe User Guide
ST7-EMU3 series emulator ST7-EMU3 Emulator User Manual ST7xxxx-EMU3 Probe User Guide ST7-EMU2 series emulator
(formerly the HDS2)
ST7xxxx-EMU2x Emulator User Manual
STiceadvanced emulation system STiceadvanced emulation system for
ST microcontrollers User Manual
ICP devices
ST7-STICK ST7 Flash STICK User Manual
ST7-DVP3 series emulator ST7-DVP3 Emulator User Manual ST7-EMU3 series emulator with ICC Add-on ST7-EMU3 Emulator User Manual
ST7 EPB ST7 EPB User Manual
STiceadvanced emulation system STiceadvanced emulation system for
1.6 Conventions
The following conventions are used in the documentation:
● Bold text highlights key terms and phrases, and is used when referring to names of dialog boxes and windows, as well as tabs and entry fields within windows or dialog boxes.
● Bold italic text denotes menu commands (or sequence of commands), options,
buttons or checkboxes which you must click with your mouse in order to perform an action.
● The > symbol is used in a sequence of commands to mean “then”. For example, to open an application in Windows, we would write: “Click Start>Programs>ST7 Tool
Chain>....”.
● Courier font designates file names, programming commands, path names and any text or commands you must type.
● Italicized type is used for value substitution. Italic type indicates categories of items for
which you must substitute the appropriate values, such as arguments, or hypothetical filenames. For example, if the text was demonstrating a hypothetical command line to compile and generate debugging information for any file, it might appear as:
cxst7 +mods +debug file.c
● Items enclosed in [brackets] are optional. For example, the line: [options]
means that zero or more options may be specified because options appears in brackets. Conversely, the line:
options
means that one or more options must be specified because options is not enclosed by brackets.
As another example, the line: file1.[o|st7]
means that one file with the extension .o or .st7 may be specified, and the line: file1 [file2...]
means that additional files may be specified.
● Blue italicized text indicates a cross-reference—you can link directly to the reference by clicking on it while viewing with Acrobat Reader.
2
Getting started with STVD
Once you have installed and launched ST Visual Develop (STVD), the following section will provide you with information to help you get started building, debugging and programming your application to your target microcontroller.
The following sections will explain how to:
● Section 2.1: Set the toolset and path information ● Section 2.2: Create a workspace with a new project ● Section 2.3: Add source files (.asm, .c, .s) to your project ● Section 2.4: Build your application
● Section 2.5: Select and connect to your debug instrument ● Section 2.6: Debug your application
● Section 2.7: Program your application to your microcontroller
2.1
Set the toolset and path information
When you first open STVD, you should confirm the default toolset and path information that will be used when building your application. STVD will automatically set path and subpath information for standard installations of the supported toolsets. However, you should confirm that these paths are correct for your particular installation.
Note: Even though you have specified these default settings in STVD, which are applied to all projects using a toolset, you can still change the toolset and paths for a specific project in the General tab of the Project Settings window (see Section 4.5: Configuring project settings on page 84).
To change default toolset paths: 1. Select Tools > Options.
2. In the Options window click on the Toolset tab. 3. Select your toolset from the Toolset list box.
If the path is incorrect you can type the correct path in the Root Path field, or use the browse button to locate it.
4. In the subpath fields, type the correct subpath if necessary. These paths are relative to the toolset path in the Root Path field.
Note: For Metrowerks toolset users, some versions use the filename “prog” instead of “bin” for the binary path.
2.2
Create a workspace with a new project
The workspace is a generic, global environment for STVD, which can contain one or more projects and their dependencies. Projects, however, contain the specific information for building your application including the toolset information, build configuration and target device information. When you started debugging, the project also stores the debug context each time you save it.
Note: Workspace files for previous versions of STVD (.wsp) can be opened in STVD 3.0 and later versions. For information on migrating your workspaces to the new workspace format, refer to Migrating old workspaces (STVD7 2.5.4 and prior versions) on page 71.
With the Create Workspace with New Project wizard you can quickly and easily: ● Create a new workspace
● Create a project in your workspace ● Specify a target MCU for your project
2.2.1
Create a new workspace
Create a new workspace by selecting File > New Workspace. The New Workspace window opens. Here, select the Create Workspace and Project icon and click on OK.
Note: For information on creating workspaces from a project, an executable file or a makefile, refer to Section 4.2.2: Creating a new workspace on page 78.
Figure 1. New Workspace window
In the New Workspace window:
1. Enter the name in the Workspace Filename field.
2. Enter the pathname where you want to store your workspace by typing it, or using the Browse button to locate a file. Click on the Create a New Folder button if you need to create a folder for your workspace, then enter the new folder name in the pop-up window.
2.2.2
Create a project in your workspace
Figure 2. New project window
In the New Project window:
1. Enter the name of your project in the Project Filename field. 2. Type the pathname where you want to store it.
By default, this is the pathname you entered for your workspace.
3. Select your toolset (ST Assembler/Linker, Cosmic C or Metrowerks C) from the Toolchain list box.
4. Enter the pathname for your toolset by typing the path or using the Browse button to find it.
5. Click on OK.
The Select an MCU dialog box opens.
2.2.3
Specify a target MCU for your project
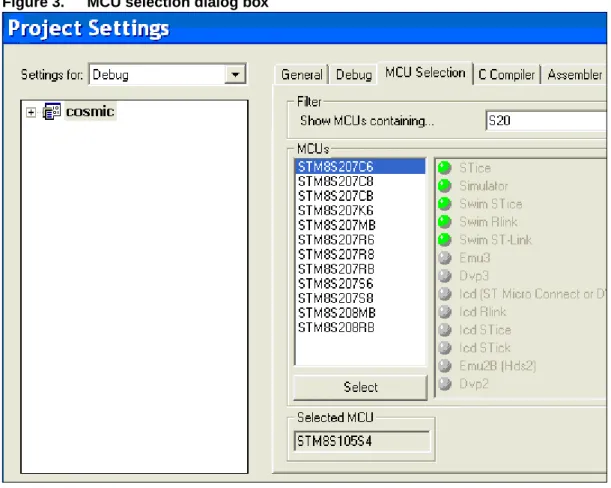
In the MCU Selection dialog box:
1. Choose the target device for your application from the complete list of supported MCUs.
2. Click on Select.
The name of the MCU appears in the Selected MCU field. 3. Click on OK.
Your new workspace and project are created. Only the project is associated with the selected MCU. Your, workspace can contain multiple projects that are to be built for different target MCUs.
Figure 3. MCU selection dialog box
Note: If necessary, you can change the MCU selection later in the MCU selection tab of the Project Settings window.
RESULT
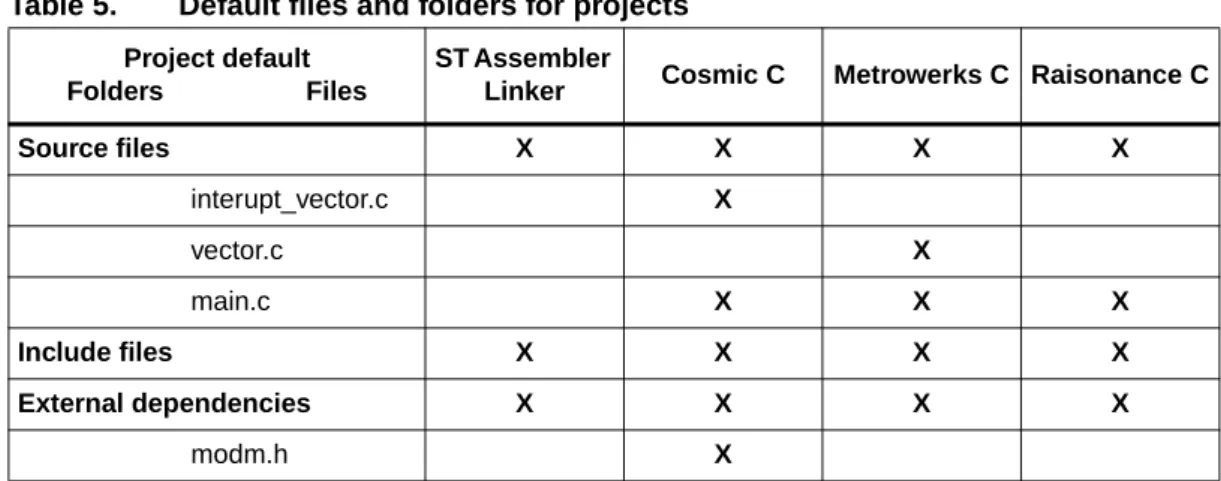
A project file (.stp) and its associated folders have been created in your workspace and appear in the Workspace window. Depending on your toolset, the folders and files listed in
Table 5 are created in your project by default.
2.3
Add source files (.asm, .c, .s) to your project
Source files (.asm, .c, .s) contain the code for building your application. To add the application source files to your project:
1. Right-click on the Source Files folder, then select Add Files to Folder from the contextual menu.
A browse window opens, allowing you to find the source files to add to your project. 2. Highlight the file(s) and click on Open.
Figure 5. Open window
RESULT
Your project’s Source Files folder now contains the source code that you want to use to build your application.
Table 5. Default files and folders for projects
Project default
Folders Files
ST Assembler
Linker Cosmic C Metrowerks C Raisonance C
Source files X X X X
interupt_vector.c X
vector.c X
main.c X X X
Include files X X X X
External dependencies X X X X
Figure 6. Workspace window
Caution: When building with ST Assembler Linker, your application source files may need to be assembled in a specific order. To change the order of the files, you need to disable the Add Sorted Elements option in the workspace contextual menu. For more information, refer to Ordering source files before assembly on page 88.
2.4
Build your application
Once you have created your project, you are in the Build context by default. You have access to all the commands necessary for setting up, customizing and building your application. You do not yet have access to the commands for debugging your application, or programming it to your microcontroller.
In the build context, you can select default settings for building your application in order to debug it, or to generate a release version to be programmed to your microcontroller. In addition, you have access to the interface for customizing the building of your application and identifying the target microcontroller. When using STVD, you must identify the target MCU to which you will program your application.
2.4.1 Configuring
project
settings for Debug or Release
Build configurations allow you to change project settings quickly and easily. STVD has two preset configurations:
● Debug: creates a version of your application that allows you to use all of STVD’s advanced debugging features. When using this configuration, output files are saved in the Debug folder in your workspace directory.
● Release: creates a version of your application using the default optimizations for your toolset. This version of your application is ready to be programmed to your target microcontroller. Output files are saved in the Release folder in your workspace directory.
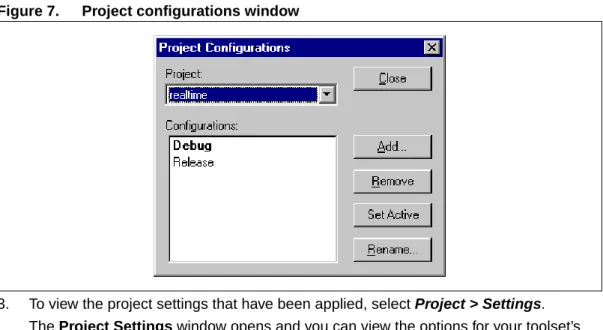
1. To choose a build configuration, select Build > Configurations. The Project Configurations window is displayed.
2. Highlight the configuration you want to use and then click on Set Active. Click on
Figure 7. Project configurations window
3. To view the project settings that have been applied, select Project > Settings. The Project Settings window opens and you can view the options for your toolset’s Compiler, Assembler and Linker, among others. You can also customize these options. For more information about the available options for your toolset, refer to Section 4.5: Configuring project settings on page 84.
2.4.2
Build commands and output
Once you have selected your MCU and configured all the options for building, use the commands in the Build menu to build and rebuild your application, or compile your source files. When STVD builds your application the command lines and any warnings, errors or other build information are displayed in the Build tab of the Output window.
2.5
Select and connect to your debug instrument
STVD allows you to debug your application using the Simulator (software only), or a range of debug instruments (emulators and in-circuit debugging hardware).
1. Once you have built your application for debugging, select Debug Instrument > Target
Settings.
The Debug Instrument Settings window will open.
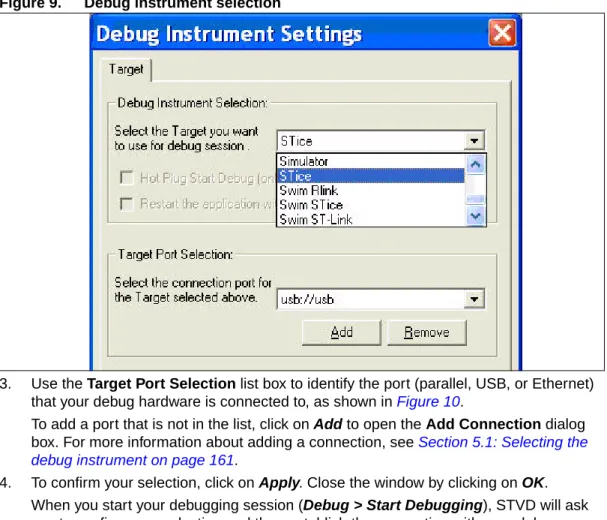
2. In this window, use the Debug Instrument Selection list box to select your debugging hardware (emulator or other device), as shown in Figure 9.
This list box contains the list of debug instruments that support your target microcontroller.
Figure 9. Debug instrument selection
3. Use the Target Port Selection list box to identify the port (parallel, USB, or Ethernet) that your debug hardware is connected to, as shown in Figure 10.
To add a port that is not in the list, click on Add to open the Add Connection dialog box. For more information about adding a connection, see Section 5.1: Selecting the debug instrument on page 161.
4. To confirm your selection, click on Apply. Close the window by clicking on OK. When you start your debugging session (Debug > Start Debugging), STVD will ask you to confirm your selection and then establish the connection with your debug instrument.
Figure 10. Debug instrument target port selection
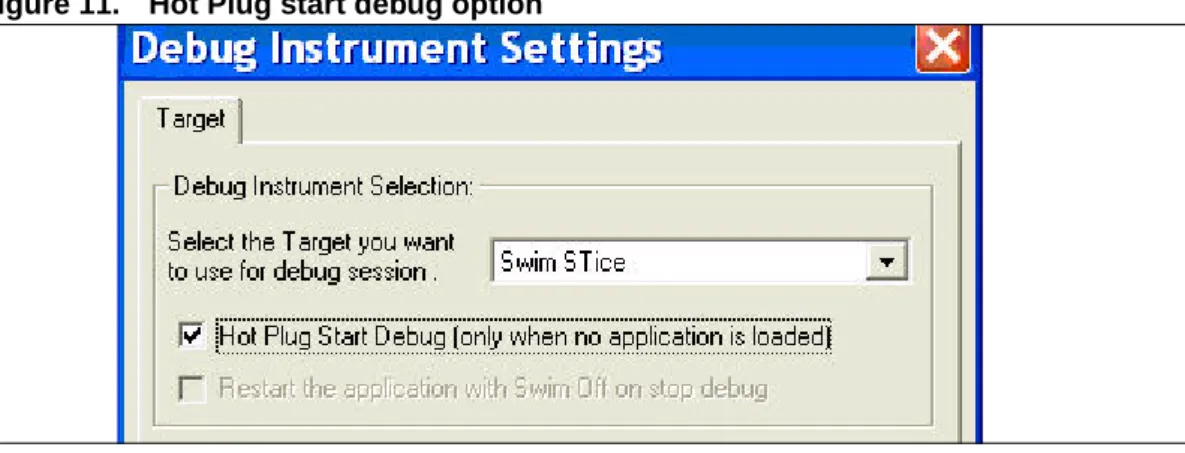
The SWIM debugger has two additional parameters to define the target connection:
1. Out of workspace, you can connect in Hot Plug mode, which means the microcontroller is not put under reset while initializing the connection. For more details on Hot Plug mode refer to Section 7.4: In-circuit debugging in hot plug mode (SWIM only).
Figure 11. Hot Plug start debug option
2. When you are inside a workspace and stop debug, by default STVD removes the software breakpoints (if any, and if possible) and makes the application restart with the SWIM module OFF on the microcontroller side (see Figure 12). You may change this default behavior by unchecking the Restart Application checkbox.
Caution: You must choose the behavior before the target is connected (start debug), even though the behavior only affects the target disconnection (stop debug).
Software breakpoints, if any, remain in Flash memory until reprogrammed.
After a reset the microcontroller needs a SWIM host before it can continue. A power-on reset is required to escape this state.
Figure 12. Restart with SWIM off option
2.6 Debug
your
application
In the Debug context, STVD provides access to the commands and windows that are specific to debugging applications, and that are specific to your debugging instrument. Select Debug > Start Debugging to change from the Build context to the Debug context. RESULT:
The commands in the Build menu are no longer available. Instead, commands specific to debugging, view windows for debugging and emulator features are now available.
For more information about debugging features, you can refer to Section 5: Basic debugging features on page 160.
2.7
Program your application to your microcontroller
Once you have finished debugging your application and have built the final version, you can program it to your target microcontroller using STVD’s Programmer.
To access the Programmer, select Tools > Programmer from the main menu bar. The Programmer window opens.
Figure 13. Programmer window
From this window, you have interfaces that allow you to: ● Select your programming hardware and mode
● Identify files to be programmed to specific Memory areas ● Configure the option bytes for your Flash microcontroller
● Monitor the status while your application is being programmed to your microcontroller For a complete description of features, refer to Section 11: Program on page 325.
3
Your STVD graphical environment
These sections describe the layout of STVD: the various menus, toolbars and status indicators that will help you, whether you are building, or debugging your application. In particular the following sections provide information about:
● Section 3.1: The main application window
● Section 3.2: The main menus and their commands ● Section 3.3: View windows
● Section 3.4: Workspace window ● Section 3.5: Editor windows ● Section 3.6: Output window
● Section 3.7: Customizing your work environment ● Section 3.8: Tooltips
● Section 3.9: Help and support features
● Section 3.10: Migrating old workspaces (STVD7 2.5.4 and prior versions)
3.1
The main application window
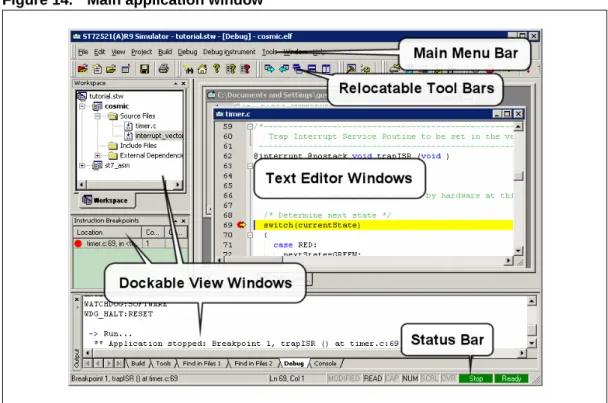
Figure 14 shows STVD’s main application window. An application has been opened and several of the debugging windows are seen in a typical configuration. This is one possible arrangement of window elements; you can change the position of all windows, open or close individual elements, change the windows that are visible at startup, and save the
configuration.
The different areas on this screen are:
● Main menu bar: The main menu bar is always visible. It contains pull-down menus to access the principal STVD functions (see Section 3.2: The main menus and their commands).
● Relocatable toolbars: Under the main menu, control buttons are grouped by subject into relocatable toolbars (default position). Toolbars may be shown or hidden
independently. The contents of each toolbar can be user-defined, and new toolbars created as required (see Section 3.7.2: Customizing toolbars on page 65).
● Text Editor windows: You can open up one or all of your application's source files in text editor windows. These windows can be cascaded, floated, minimized or maximized (see Section 3.5: Editor windows on page 43).
● Docking windows: The various STVD view windows are dockable for greater ease of use when several windows are open at the same time. They may be moved to different docking positions, undocked and placed independently on the desktop, or free-floating within the main STVD window area. The name of each window appears in a caption at the top of the window (see Section 3.5: Editor windows on page 43).
● The Status bar: Displays current attributes associated with the Edit window and STVD status.
Figure 14. Main application window
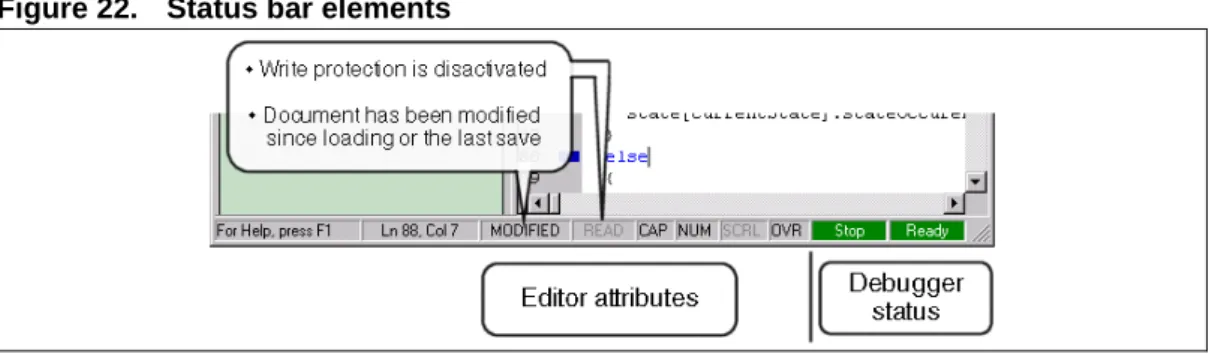
Status bar
The status bar in the lower frame of the STVD main application window contains useful information about editor attributes and debugger status.
Editor attributes such as keyboard states (for example CAPS On/Off, Type Over On/Off) are shown in the center of the bar. Also displayed are attributes of the active file in the Edit window, such as the current location of the cursor in the editor window, and whether the file has been modified or not. These attributes and their functions are described in more detail in Editor status bar information on page 48.
Figure 15. Status bar
The two right-most panels of the status bar show the current status. Stop and Ready shown in green mean that the program is halted and the debugger awaits further instruction. Run and Debugger, shown in red and orange, respectively, mean that the program is currently running on the debugger.
Note: The status bar does not explicitly indicate whether you are in the Build or the Debug context. The Stop and Ready messages appear when you are in either context. However the Run and Debugger messages only appear when you are in the Debug context.
3.2
The main menus and their commands
STVD’s menus provide a range of common commands for general activities such as opening projects, or loading, editing and saving files, as well as access to build and debug commands.
File menu
The File menu provides standard commands for managing workspace and text files, including: New, Open, Close, Close All, Save, Save as, Save All, Print and Recent.
The New Workspace and Open Workspace commands are very important because before you start creating projects, building or debugging your application, you must create or open a workspace. For more information, refer to Loading and creating workspaces (.stw) on page 76.
Edit menu
The Edit menu provides file editing and text search commands that are available whenever an Editor window is open, in both the Build and Debug context. In addition, this menu provides breakpoint commands, and access to the QuickWatch window, which you will use in the Debug context.
This section provides a summary of available commands. For more information about editing features and commands, refer to Editor windows on page 43. For more information about using debug commands from the Editor windows, refer to Basic debugging features on page 160.
Table 6. Edit menu commands
Command Description
Undo/Redo Undoes the last edit (text processing) command, or redoes last undone
command.
Cut, Copy, Paste Standard clipboard operations. Find..., Find
Next and Replace
Finds and/or replaces text in the text editor. The Find command is also available in the contextual menu.
Go to Opens the Go To window. Define a line, address or function to go to.
Find in Files Finds a string within any of the files in a given directory.
Breakpoints
Inserts breakpoint symbols into the source code in the active Edit window. The program can then be run taking into account the symbols that you inserted. For details, see Editor debug actions on page 169.
Bookmarks Insert/remove and navigate through the bookmarks in the margins of the current
source file.
QuickWatch Opens a QuickWatch window, which allows rapid access of common watch
functions.
Refresh Refreshes all windows.
Match Brace Goes to the brace that corresponds to the brace you have highlighted in the
View menu
The commands in the View menu open the Workspace, Output and Instruction
Breakpoint windows when you are in the Build or the Debug context. When you are in the Debug context this menu also allows you to open the different view windows for viewing disassembled code, registers, memory, stack and variables. These views are not available when you are in the Build context. They are explained in greater detail in Basic debugging features on page 160.
This menu may offer some different commands depending on your debug instrument. For information about commands that are specific to your debugging hardware, refer to the sections on target-specific debugging features.
Project menu
The Project menu gives you access to all of the following project-related commands and activities.
Complete Word Opens the auto completion pop-up for a list of context specific keywords to
complete the word you are typing.
Parameter Info Opens the parameter information pop-up to see the syntax for the ASM
instruction that you are typing. Table 6. Edit menu commands (continued)
Command Description
Table 7. Project menu commands
Command Description
Set Active Project Allows you to select which project you want to make active for building or
configuration.
Insert Files into Project
Opens a browse window from which you can locate an existing file to insert in the active project (see Section 4.3.3: Adding and removing folders and files on page 83).
Dependencies... Allows you to set dependencies among the projects in the current workspace
(see Section 4.12: Build commands on page 158).
Settings... Opens the Project Settings window (see Section 4.5: Configuring project
settings on page 84).
Export Makefile... Generates a makefile script that can be launched with the gmake utility,
separately from STVD full IDE.
Insert Project into Workspace
Opens a browse window from which you can locate an existing project to insert in the current workspace (see Section 4.3.1: Loading an existing project on page 80).
Add New Project to Workspace
Allows you to create a new project and add it to the current workspace (see Add a project (.stp) to your workspace on page 81).
Remove Project
Build menu
The Build menu contains the commands that allow you to set the configuration for building your application, and to start and stop the build. These commands, with the exception of
Compile and Batch Build, apply to the active project in your workspace. Compile applies
to the source file that you have selected in the Workspace window. Batch Build applies to the projects that you identify in the Batch Build window. For more information, see Build commands on page 158.
Note: You do not have access to the commands in this menu until you have created a workspace with a project.
Debug menu
This menu provides access to the commands associated with running and stopping a loaded program (Run, Restart, Continue, Run to Cursor and Stop), single stepping through it (Step Into, Step Over, Step Out), and the commands Go To PC, and Set PC. These commands are specific to running your program while debugging. For more information about using these commands refer to Running an application on page 167.
Debug instrument menu
This menu gives you access to options that are specific to your target debugging hardware. As a result, the menu contents will change when you start a debugging session, depending on the features supported by the debugging tool that you have specified.
Before you identify your debug instrument, this menu contains the following command by default.
For more information about other commands that can appear in this menu, refer to the debugging features that are specific to your debug instrument.
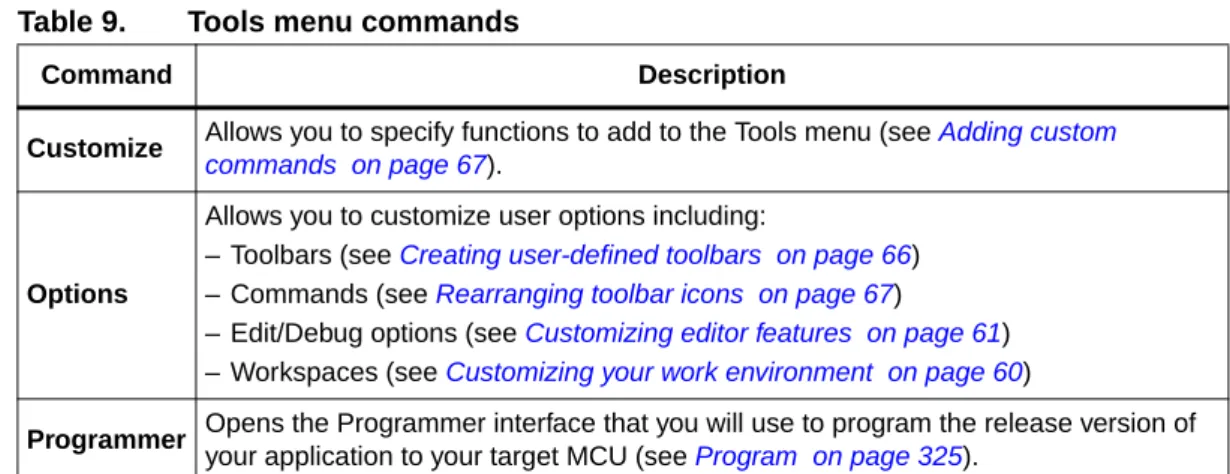
Tools menu
The Tools menu offers customization and setup options for defining the look and layout of STVD and to set a number of user options. The options of the Tools menu are described in
Table 9.
Table 8. Debug Instrument menu commands
Command Description
Target Settings
Opens the Debug Instrument Settings window, which allows you to choose your debug instrument and configure the parallel, USB or Ethernet connection (see Selecting the debug instrument on page 161).