MSc Finance and Strategic Management
May 2009
MASTER THESIS:
How do discounted cash flow analysis and real options
differ as basis for decision making about oil and gas field
developments?
Author: Thomas Kvalevåg
Table of Contents
1.0 Introduction... 6
1.1 Problem statement...7
1.2 Methodology...8
1.3 Models and Sources of information...9
1.4 Delimitation...11
2.0 Dynamics of valuation in the petroleum industry ... 12
2.1 Factors representing uncertainty and risk...12
2.1.1 Oil price...12
2.1.2 Technology...14
2.1.3 Costs and inflation...14
2.1.4 Amount of extractable petroleum reserves...15
2.1.5 The issue of time...15
2.2 Value chain analysis of the upstream petroleum industry...16
2.2.1 Prospects and licenses...16
2.2.2 Seismic and exploration drilling...17
2.2.3 Resources under evaluation...17
2.2.4 Resources under development...18
2.2.5 Resources in production...18
2.2.6 Liquidation...18
2.3 Phases of oil and gas field developments...19
3.0 Discounted Cash Flow Analysis... 20
3.1 Introduction...20
3.2 Variables in dcf-analysis...20
3.2.1 C0 - Investments...21
3.2.2 Ct - Cash Flows...22
3.2.3 r - Discount Rate...23
3.3 Different DCF-Techniques...27
3.3.1 NPV...27
3.3.2 IRR...27
3.4 Accounting for Uncertainty and Risk...28
3.4.1 Sensitivity Analysis...29
3.4.2 Scenario Analysis...29
3.4.3 Break-Even Analysis...30
3.4.4 Monte Carlo Simulation...30
3.4.5 Implicit Valuation Models vs. Explicit Valuation Models...31
3.4.6 Probability Distributions...32
3.5 Previously Research and Literature...33
3.5.1 Pros...33
3.5.2 Cons...34
4.0 Real Options ... 38
4.1 Introduction...38
4.2 Valuation of Financial Options...40
4.2.1 The Binomial Method for Valuation of Financial Options...40
4.2.2 The Black-Scholes Formula...43
4.3 Valuation of Real Options...44
4.3.1 The Model by Cox, Ross and Rubinstein (CRR)...45
4.4 Previously Research and Literature...48
4.4.1 Pros...48
4.4.2 Cons...49
5.0 Applying the Theory ... 51
5.1 Introduction...51
5.2 The Goliat Project...51
5.3 General Assumptions and Base Case...52
5.3.1 Extractable reserves and production rates...52
5.3.2 Oil and Gas Price Levels...53
5.3.3 Investments (capex) and Operating costs (opex)...54
5.3.4 Depreciation of capex...54
5.3.5 Tax System and Fees...54
5.3.6 Inflation...54
5.3.7 Liquidation...55
5.3.8 Discount Rate...55
5.3.9 Guidelines set by the Norwegian Petroleum Directorate...55
5.4 Base Case Valuation...56
6.0 Valuation under uncertainty using dcf-analysis and NPV... 57
6.1 Sensitivity Analysis...57
6.1.1 Extractable reserves and production rates...57
6.1.2 Capex...58
6.1.3 Opex...58
6.2 Scenario Analysis...59
6.2.1 Delay...59
6.2.2 Low production...60
6.2.3 High production...60
6.2.4 Low oil price levels...60
6.2.5 High oil price levels...60
6.2.6 Summary of Scenario analysis...60
6.3 Monte Carlo Simulation...61
6.3.1 Oil and Gas price levels...61
6.3.2 Extractable reserves and Production rates...62
6.3.3 Capex...62
6.3.4 Opex...63
6.3.5 Summary of Monte Carlo Simulation...63
7.0 Valuation under uncertainty using Real Options... 65
7.1 General Assumptions...65
7.1.1 Oil Price and Volatility...65
7.1.2 Length of Binomial Period...65
7.1.3 Risk Free Rate...66
7.1.4 Net Convenience Yield...66
7.1.5 Cash Flow Model...66
7.2 The Timing Option...67
7.3 The Option to Expand...68
7.4 The Abandonment Option...69
8.0 Discussion ... 71
8.1 Which assumptions is dcf-analysis and the real option framework based on?...71
8.1.1 Cash Flow Model...71
8.1.2 Subjectivity vs. Objectivity...71
8.1.4 Decision Rule...74
8.1.5 Discounting...75
8.2 Which practical challenges exist in applying the two methods?...76
8.2.1 Modeling expertise...76
8.2.2 Complexity...77
8.2.3 Organizational issues...79
8.3 How do the two methods differ in their ability to handle uncertainty?...79
8.3.1 Dcf-analysis...79
8.3.2 Real options...81
8.4 Implications...81
9.0 Conclusions... 84
9.1 Findings...84
9.2 Conclusions...85
9.3 Future research...85
Appendices... 87
References...87
Appendix 1: Valuation Base Case...90
Appendix 2: Sensitivity Analysis: Extractable reserves, Optimistic Case...91
Appendix 3: Sensitivity Analysis: Capex, Optimistic Case...92
Appendix 4: Sensitivity Analysis: Opex, Pessimistic Case...93
Appendix 5: Scenario Analysis: Delay...94
Appendix 6: Scenario Analysis: Low Production...95
Appendix 7: Scenario Analysis: High Production...96
Appendix 8: Scenario Analysis: Base Case...97
Appendix 9: Scenario Analysis: Low Oil Price...98
Appendix 10: Scenario Analysis: High Oil Price...99
Appendix 11: Monte Carlo Simulation...100
Appendix 12: Monte Carlo Simulation Report...101
Appendix 13: Real Option Analysis: Timing Option...102
Appendix 14: Real Option Analysis: Expand Option...103
Table of Figures
Figure 1: The structure of the analysis ...8
Figure 2: Investments in oil and gas activity on the NCS from 1985 to 2009 compared with average yearly oil price (Statistisk Sentralbyrå) ...12
Figure 3: The value chain of the upstream petroleum industry (Gjul and Ringvold, 2006) ....16
Figure 4: Decision space related to phases in oil and gas field developments (Lund, 1999) ...19
Figure 5: Replicating portfolio of a call option...41
Figure 6: Binomial tree with multiplicative process and corresponding option values ...45
Figure 7: Analogies between financial and real options (Zettl 2002) ...46
Figure 8: Location of the Goliat field in The Barents Sea in the northern parts of the NCS ...52
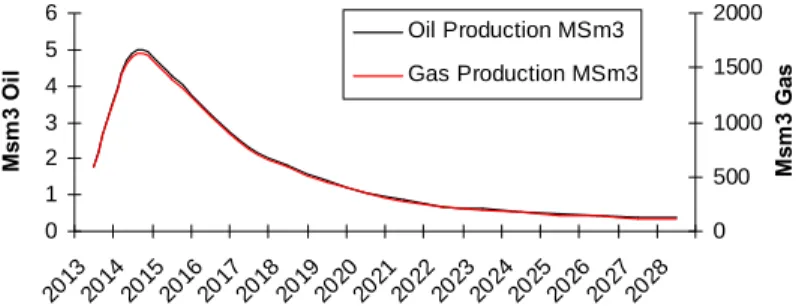
Figure 9: Assumption of Base Case production profile from Goliat ...53
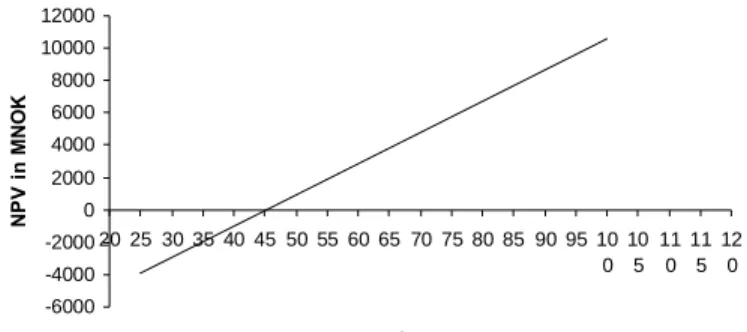
Figure 10: NPV profile of Goliat assuming Base Case...56
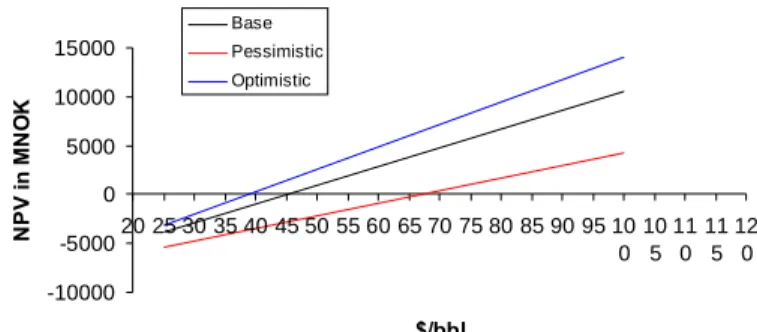
Figure 11: Sensitivity analysis: NPV profile with various amounts of extractable reserves....57
Figure 12: Sensitivity analysis: NPV profile with different capex ...58
Figure 13: Sensitivity analysis: NPV profile with different opex...59
Figure 14: Summary of scenario analysis using 7% discount rate...60
Figure 15: Triangular distribution of oil price used in Monte Carlo simulation ...62
Figure 16: Triangular distribution of extractable reserves used in Monte Carlo simulation....62
Figure 17: Triangular distribution of capex used in Monte Carlo simulation ...63
Figure 18: Triangular distribution of opex used in Monte Carlo simulation...63
Figure 19: Range of NPV outcomes in Monte Carlo simulation...64
Figure 20: Scatter plots of variables in the Monte Carlo simulation...64
Figure 21: Summary of timing option ...68
Figure 22: Summary of expand option...69
Figure 23: Summary of abandonment Option...70
1.0 Introduction
The aim of profit maximizing companies is to take on investments with positive net present values (NPV) in order to create shareholder value. Capital budgeting is the process in which companies determine whether an investment opportunity is worth pursuing or not. Investment decisions should be made on the ground of some kind of valuation and evaluation. Many industries face investments involved with uncertainty. Uncertainty factors may include the development of out put prices, demand, costs, technology, delays and other known and unknown factors. These kinds of uncertainties create problems in evaluating and valuing investment opportunities.
The petroleum industry is a good example of an industry exposed to high investments and high uncertainty. The level of activity is highly affected by the level of the oil price. Investments are high when market conditions are advantageous and prospects are good, and vice versa. Projects in the petroleum industry are often characterized by long time horizons. Such projects are recognized by heavy investments and negative cash flows in the early stage, released by production and positive cash flows after development is completed. This cash flow structure creates the risk of having good market conditions in the early stage, and bad market conditions during production.
The petroleum industry has experienced high activity and high investment level due to high oil price levels since 2003. Many projects have been found profitable and been initiated. The oil price has now dropped and is threatening projects recently found profitable. An example of this is an oil and gas field named Goliat, located in the Barents Sea in the northern parts of the Norwegian continental shelf (NCS). The project has received attention due to the possibility of being the first oil field development in the Barents Sea. There has also been discussion about the profitability of the project considering the recent decrease in oil price levels. The change in market conditions has increased the requirements of evaluation and valuation methods. “All” projects are no longer profitable. Companies must work harder and better in order to find the best projects and to make good investment decisions.
According to Begg, Bratvold and Campbell (2003), studies show that the oil and gas industry has consistently underperformed various market indices like the Dow Jones Industrial Average and the Standard & Poor 500. Some attribute the underperformance to project
evaluation and decision-making procedures that result in either a systematic overestimate of returns and/or underestimate of risks. A good decision should be an action companies take that is consistent with the alternatives they perceive, the information they have and the preferences they feel. In an uncertain world good decisions can lead to bad outcomes, and vice versa. Making this distinction allows us to separate action from consequences and hence improve the quality of action. By understanding existing decision-making tools and processes, and improving these tools and processes, it should be possible to make more accurate valuation of investments and better investment decisions.
Research and surveys show that traditional discounted cash flow analysis (from now on called dcf-analysis) is the standard when it comes to valuation of assets and projects in the petroleum industry. Valuations should provide decision makers with economic perspectives on investment opportunities. Research has pointed out some drawbacks of the traditional dcf-analysis. To overcome these drawbacks, a real option framework using the principles of financial option valuation to value real investments has been introduced. Due to practical challenges, it seems that the petroleum industry is reluctant to apply the real option framework. The real option framework seems logic and suitable in theory, but several practical challenges must be solved.
The motivation of the topic and the following problem statement stems from my interest in corporate finance and the petroleum industry. Literature on corporate finance and the petroleum industry often focus on the suitability of dcf-analysis and the real option framework to value investments. The recent change in market conditions has increased the importance of this matter and the need of sufficient decision making tools.
1.1 Problem statement
With regards to the introduction, the following main problem statement has been designed:
“How do discounted cash flow analysis and real options differ as basis for decision making about oil and gas field developments?”
In order to answer the main problem statement, the thesis will look closer into the following three questions:
- Which practical challenges exist in applying the two methods? - How do the two methods differ in their ability to handle uncertainty?
1.2 Methodology
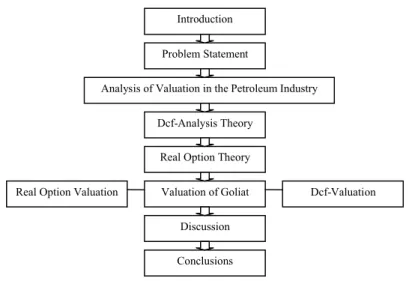
In order to answer the problem statement and the related questions, a case study will be performed. After an introduction of the theories of dcf-analysis and real options, the theories will be applied on an oil and gas field development case. The case chosen is the already mentioned Goliat project in the Barents Sea. Because of its small size, the discussion about the profitability of the project and the closely forthcoming start of development in 2010, the project is well fitted. Applying the two methods on a similar case should make it possible to answer the problem statement and the related questions. Results and experience from the valuation of Goliat will be discussed with regards to the questions in the problem statement. The findings are summarized and concluded in the last part of the thesis. Figure 1 shows the structure of the analysis.
Figure 1: The structure of the analysis
According to Begg, Bratvold and Campbell (2003), there are two main areas of investigation and theory development around decision-making under uncertainty; the normative and the descriptive. The normative approach aims at developing theories about how decisions should be made. The descriptive approach aims at developing theories about how decisions are actually made. This thesis contains elements of both normative and descriptive investigation. The normative approach is handled in the chapters explaining already existing theories. The descriptive approach is handled in the case study. The sum of the analysis should create
Introduction Problem Statement
Analysis of Valuation in the Petroleum Industry
Real Option Theory
Conclusions Discussion Valuation of Goliat Dcf-Analysis Theory
knowledge on both how decisions should be made, and how decisions are made. The next section will in further detail explain the execution of the methodology described above.
1.3 Models and Sources of information
In order to apply valuation methods in a specific context, an analysis of the specific context is required. The analysis of the upstream petroleum industry is performed by value chain analysis. The term “upstream” relates to operating stages in the petroleum industry that involve exploration and production. The aim of a value chain analysis is to recognize and examine all activities performed in a firm or an industry. By doing so, it should be possible to determine bases of competitive advantages (Porter, 1985). Evaluating the upstream petroleum industry in terms of competitive advantages is not the scope of this analysis. However, a value chain analysis can also be used to understand how projects are structured. This application should make it possible to identify when and how decisions are made. This analysis should contribute in further delimitation of the scope of the thesis, as it will identify where and how the valuation methods should be used.
The thesis also analyzes factors representing uncertainty and risk with regards to the profitability of oil and gas field developments. Identification of risk factors is essential when evaluating projects in an uncertain world. The analysis gives an overview and explains importance and implication of each factor. The analysis is based on a systematic review of the determinants of profitability in oil and gas field developments.
The choice of analyzing dcf-analysis and real options has its grounds in earlier studies of capital budgeting. Studies show that dcf-analysis has a strong position. Mukherjee and Henderson reported in 1987 that dcf-analysis was becoming the standard practice for capital budgeting. The internal rate of return was the preferred dcf-tool, with net present value being a distant second choice. The survey highlights the gap between theory and practice, as NPV is known as the theoretically preferred dcf-technique. McCormack and Sick (2001) categorize dcf-tools as fundamental to financial analysis in the petroleum industry.
However, studies also show that real option methods have gained more attention and may be better suited to value specific investments. In their article, Keefer and Corner (2004) identify and provide perspectives on trends and developments in decision analysis. Keefer and Corner take a normative approach and define decision analysis as a set of quantitative methods for
analyzing decisions. They find that the importance of modeling sequential decisions with the help of new information as time goes by is becoming more widely recognized. Investments characterized by high uncertainty and downstream decision alternatives can provide real options increasing flexibility of projects. The study points out that the use of option thinking can provide more realistic evaluations than traditional dcf-analysis. Other papers and articles discussing different aspects of real options are among others published by Smith and Nau (1995), Laine (1997), Copeland and Keenan (1998), Lund (1999) and Zettl (2002).
The reason for using case study in order to analyze the two methods has partial been explained in section 1.2. Case studies provide knowledge based on analysis of one or a small number of units. The unit in this thesis is Goliat, and gives specific knowledge about application of the two methods on Goliat as an investment opportunity in the petroleum industry. A drawback of case studies is the question regarding the validity of the results. By analyzing only one specific oil field development project, it can be questioned whether the obtained knowledge about the two methods is valid for other oil field development projects. The selection of a case study approach can be supported by the possibility of analyzing the two methods on a similar case. It should make it possible to discover differences and consequences of the two methods as decision making tools. Considering that most oil and gas field developments have approximately the same cash flow- and decision making structure, it should be possible to take advantage of knowledge obtained from the case study of Goliat in other oil and gas field developments.
The various analyses in the thesis are based on various sources, information and tools. The description of dcf-analysis and the real option framework is based on existing literature and research. Both valuations are performed in Microsoft Excel. Inputs used in the valuation are based on publicly available information, comments from the company operating the project and assumptions made by the author. Due to simplification and the lack of information, some of the real option valuation is based on simplified assumptions. The application of the analysis should however not be affected. The thesis is adjusted to the Norwegian continental shelf (NCS). This is caused by Goliat being located outside the coast of Norway, and affects the valuation by the use of Norwegian taxation rules.
1.4 Delimitation
The analysis focuses on issues related to the problem statement and the three related questions. Other methods for capital budgeting exist, but are not analyzed in this thesis. The attributes, importance and size of the petroleum industry attract many stakeholders. Examples include environmental and political issues playing different roles in capital budgeting. This thesis focuses mainly on financial and structural parts of capital budgeting in the petroleum industry, and not on non-financial considerations.
The case study of the Goliat project is based on various sources of information. The aim of the analysis is to construct a realistic but simplified valuation of the Goliat project. Assumptions taken in the case study may be wrong and misleading. Assumptions about exchange rates, inflation, oil and gas price levels and net convenience yield have not been investigated empirically. Such considerations would require knowledge, research and expectations which are not included in the scope of the thesis. Assumptions are based on present market conditions and the authors beliefes about the future. The aim of the analysis is not to predict future market conditions, but to compare dcf-analysis and real options ability to account for uncertainty related to future market conditions. The utility of the analysis should not be affected by the possibility of wrong assumptions being used as input in the valuation. Many real option valuation models exist. The case study use a real option model developed by by Zettl (2002). This model use some simplified principles for valuation of financial options developed by Cox, Ross and Rubinstein. Far more complicated, technical and complex models exist, but will not be considered in this thesis. The characteristics and application of the Cox, Ross and Rubinstein model should be capable of extracting necessary knowledge in order to answer the problem statement of the thesis.
The thesis does not focus on capital structure and how companies finance projects. Calculations assume that Eni Norge finance Goliat with equity. An analysis of the correct discount rate to be used by Eni Norge for discounting cash flows related to Goliat will not be performed. The thesis will instead focus on possible implications of choosing correct/ incorrect discount rate.
2.0 Dynamics of valuation in the petroleum industry
Figure 2 shows that the investment level on the NCS has more than doubled during the last 8-9 years. The figure also shows a clear correlation between investment level and oil price level. The petroleum industry is recognized by large fluctuations with regards to investments, activity and profitability. Fluctuations are result of factors creating uncertainty and unstable conditions in the industry. The next section gives an overview of these factors.
0 20 000 40 000 60 000 80 000 100 000 120 000 140 000 160 000
1985198619871988198919901991199219931994199519961997199819992000200120022003200420052006200720082009
M
il
li
o
n
N
O
K
0 20 40 60 80 100 120
$
Investments in MNOK Average Yearly Oil Price $/bbl
Figure 2: Investments in oil and gas activity on the NCS from 1985 to 2009 compared with average yearly oil price (Statistisk Sentralbyrå1)
2.1 Factors representing uncertainty and risk
2.1.1 Oil price
One of the most important factors affecting the petroleum industry is the price level of oil and gas. “We mean it is impossible to foresee the level of future oil prices”, states Torbjørn Kjus in DnB NOR Markets.2“The only certain thing about the oil price is that it is unstable”, states Øystein Noreng, a professor within petroleum economics and management at BI Norwegian School of Management.3Although it is widely recognized that foreseeing future oil prices is almost impossible, we do have knowledge about different factors affecting the oil price. First of all, the oil price is determined by supply and demand. Contracts of oil are traded at the New York Mercantile Exchange and the International Petroleum Exchange in London. Various institutions, governments of oil exporting countries, firms, the global economy, expectations and unexpected events like natural disasters and weather conditions all have potential to influence oil price levels. The following section gives a brief summary of the most important factors affecting supply and demand of oil and gas.
1http://www.ssb.no/olje_gass/
2http://www.orapp.no/pris_og_rente/20081219/umulig_a_spa_oljeprisen/ 3http://arkiv.na24.no/Nyhet/185380/-+Stabil+oljepris+er+umulig.html
The Organization of the Petroleum Exporting Countries (OPEC) is an organization working to coordinate and unify the petroleum policies of the member countries. OPEC wants to ensure the stabilization of oil markets in order to secure an efficient, economic and regular supply of petroleum to consumers, a steady income to producers and a fair return on capital to those investing in the oil industry.4OPEC controls about two thirds of the world’s oil reserves, and represents about 35 % of the world’s oil production. The idea is to coordinate production in order to control supply of oil. OPEC has been known to possess great control over oil price levels. This was for instance demonstrated in 1973 when OPEC stopped shipments of crude oil to the west, resulting in a dramatic increase in oil price from $3/bbl to $12/bbl. However, the power of OPEC has decreased after discoveries of oil in the Gulf of Mexico, the North Sea and the opening of Russia.
Other factors affecting the supply of oil are regulations and policies set by governments possessing oil and gas reserves. Environmental issues like climate changes, the fear of destroying other industries (fishery) and conservation of nature may create less exploration and less production as time goes by. Further on, natural disasters like hurricanes and other extreme weather conditions may destroy or shut down oil producing facilities. This can create lower supply and lead to higher oil price levels.
The demand side of oil and gas is equally important. The world, with China in the front seat, has during the last years experienced a global economic boom. Future expectations of high demand for energy brought the oil price to historical levels during the summer of 2008 ($143, 68/bbl Brent Blend on July 11th2008).5The pace and growth of the global economy highly affects the demand for oil and gas. Many things have happened with the global economic situation during the last half of 2008. Stock markets and housing markets have crashed around the world, and major banks and financial institutions have gone bankrupt. As we write May 2009, the world is facing financial crisis and low expectations of future growth and development. This has decreased the oil price, which is at the time trading at approximately $55/bbl.
4http://www.opec.org/home/
2.1.2 Technology
As time goes by, exploration will discover extractable petroleum reserves in new and old areas. Existing and future technology makes it possible to undertake projects in unknown areas with more difficult conditions. Examples include petroleum production in arctic areas, at deeper sea levels and more complex development concepts. Technology represents an uncertain factor in pioneer projects where new technology and new concepts play important roles. Investments in technology and the possibility of failure and delay make technology an uncertain factor.
2.1.3 Costs and inflation
The level of investment and operating costs (opex) are other factors representing uncertainty in the petroleum industry. High oil price levels results in high activity in the industry. High demand for skilled labour and petroleum related services drives up the cost level in the industry. The level of costs influences the profitability of projects.
According to Emhjellen, Emhjellen and Osmundsen (2002), one might expect that cost overruns have the same probability as completing projects below cost estimates. However, the authors argue that observations clearly indicate an over representation of cost overruns. This may be a consequence of two selection biases: (1) Project selection; it is typically the projects with the most optimistic internal cost estimates that are being pursued by the investing firm, and (2) tender selection; competition sees to it that tenders with pessimistic and realistic cost estimates are ruled out. The authors discuss the importance of accurate cost estimates and the implication of these estimates on investment decisions. The authors also point to an alternative statistical approach of estimating expected costs. The article points to Statoil and Norsk Hydro (at the time of the article two major Norwegian oil companies, today one merged company called StatoilHydro), using a 50/50 (median) capex (capital expenditure) cost estimation procedure. Due to statistical properties, this method will underestimate costs and may lead to incorrect investment decisions. Considering the attributes of petroleum projects, the authors argue that cost estimates should be assumed to be asymmetric, and not symmetric.
Uncertainty regarding inflation over long time horizons creates difficulties in estimating future real levels of revenues and costs. The level of inflation should be considered in valuations of oil and gas field developments.
2.1.4 Amount of extractable petroleum reserves
Another factor of uncertainty is the exact amount of extractable petroleum reserves in oil and gas fields. Petroleum reserves are forecasted by seismic surveys and exploration drilling. Calculations and predictions are made on the basis of the results. Errors and uncertainties may be present in these calculations. Actual amount of extractable reserves may turn out to be less than predicted. Predictions about production rates are subject to the same uncertainty as predictions about the amount of petroleum reserves. The characteristics of petroleum reservoirs and the pressure in production wells affect production rates. Predictions and calculations about total amount of extractable reserves and production rates are important inputs in valuations of oil and gas field developments. Wrong inputs may lead to bad investment decisions and unprofitable projects.
2.1.5 The issue of time
Oil and gas field developments are often characterized by long time horizons. Ekofisk was the first oilfield to be discovered on the NCS. The field, which is one of the largest on the NCS, started to produce in 1971 and will continue to produce oil and gas until 2025-20306. Gyda started production in 1990 and will continue to produce until 20307. Statfjord, the biggest oil field on the NCS, started production in 1979 and will continue to produce until 20208. Long time horizons affect uncertainty about variables affecting the profitability of projects. In addition, valuing revenues and costs in the distant future involves challenges with regards to the choice of correct discount rates.
6http://energilink.tu.no/leksikon/ekofisk.aspx
7http://petro.no/modules/module_123/proxy.asp?D=2&C=14&I=11060 8http://energilink.tu.no/leksikon/tampen%20link.aspx
2.2 Value chain analysis of the upstream petroleum industry
Understanding investment decisions in the upstream petroleum industry requires an understanding of the industry’s value chain. The concept of the value chain is to recognize and examine all activities performed in a firm or an industry. By doing so, it should be possible to determine bases of competitive advantages (Porter, 1985). Evaluating the upstream petroleum industry in terms of competitive advantages is not the scope of this thesis, but value chain analysis can be used in terms of understanding how projects are structured. The next section elaborates on the various activities in the industry, with emphasis on where and how investment decisions are made.
Figure 3: The value chain of the upstream petroleum industry (Gjul and Ringvold, 2006)
2.2.1 Prospects and licenses
This section takes a Norwegian approach, considering the legal framework and procedures prevalent on the NCS. Petroleum activities on the NCS are regulated by the Ministry of Petroleum and Energy on behalf of the Norwegian government. Petroleum companies operating on the NCS must comply with the existing legal framework. The Petroleum Act (Act of 29 November 1996 No. 72 regarding petroleum activities) provides the legal framework for the licensing system which regulates Norwegian petroleum activities, including exploration, production and transportation of petroleum.
Geographic areas with potential petroleum resources must be approved by the government before any petroleum activity can find place. When specific areas are approved, the government arranges a license round where interested petroleum companies can apply for the areas they find interesting. These areas are called blocks. Applicants can apply individually or in groups. Production licenses are awarded on the basis of impartial, objective, non-discriminatory and published criteria like technological and operating expertise, financial strength, geological interpretation and relevant experience. The Ministry of Petroleum and Energy puts together a group of companies for each license, or makes adjustments to groups that have submitted a joint application. An operator responsible for the day to day activities under the terms of the license is appointed.
Prospects and licenses
Seismic and explo-ration drilling
Resources under evaluation
Resources under development
Liquidation Resources
in production
Licenses contain both rights and obligations. It gives holders an exclusive right for exploration, exploration drilling and production of petroleum within a given specific geographical area within a specified period of time up to ten years. The license holders have the property rights of the petroleum. Each license also contains a specified work obligation to be met by the holders within a specified period of time. These obligations may include seismic data acquisitions and surveys and/or exploration drilling. If all the licensees agree, the license can be given back to the government after work obligations have been met.
Decisions in the prospects and licenses phase involve to apply/not apply for specific licenses. Considerations should be made regarding beliefs and investments needed to be taken regarding seismic data acquisitions and surveys and/or exploration drilling in order to meet specified obligations in the license. By applying for a license, companies agree to make investments that may or may not uncover profitable petroleum resources.
2.2.2 Seismic and exploration drilling
Results and interpretations of seismic surveys from areas with potentially profitable petroleum reserves determine whether companies want to start exploration drilling. Exploration drilling may already be an obligation in the license, and have to be undertaken independently from seismic surveys. If exploration drilling is voluntary, holders of a license must decide to drill/not to drill. Exploration drilling is recognized by high costs and risks of drilling a dry hole.
2.2.3 Resources under evaluation
The aim of exploration drilling is to obtain answers about the presence of petroleum resources, the size of the reservoir and the quality of the reserves. These indicators determine whether a project should be taken to the next stage, which is development. Holders of licenses must make decisions about further exploration drilling, waiting, abandonment or development. A final decision about development should incorporate economic, technological and environmental considerations. All the risks and uncertainties described in section 2.1 should be evaluated. Decision about oil and gas field developments confiscate both financial resources and labor for a long time horizon, and should be given great attention.
2.2.4 Resources under development
A decision about developing an oil and gas field means that investments in production facilities, necessary equipment and infrastructure must be made. If the field is located near other fields, it may be possible to take advantage of existing infrastructure and facilities. The issue of transporting petroleum resources to refineries and consumers must be solved and scaled according to the size of the field. The process of developing, engineering, building and installing technological and practical solutions may be time demanding. This results in a period of high investments and negative cash flows. This period is followed by positive cash flows as production gets going.
2.2.5 Resources in production
A normal production profile involves high production in the beginning of fields’ lifetime. After a period of time production starts to decline, and continues to decline until the end of the field’s lifetime. Different development concepts and production rates can give different production profiles. As the field gets older, different techniques are used to maintain as high production as possible. This often results in increasing marginal costs and decreasing profits per barrel of oil. Decision about shutting down and abandonment of the field should be made on the basis of total amount of extractable reserves left, production rates, oil price levels, costs of liquidation and alternative investment and resource allocation opportunities. When costs of production equal the price of oil, production should be shut down and the company should abandon the field.
2.2.6 Liquidation
Holders of licenses are responsible for shutting down production and liquidation of developed facilities. Costs and accomplishment of liquidation should be taken into account and estimated already at the time of valuation.
2.3 Phases of oil and gas field developments
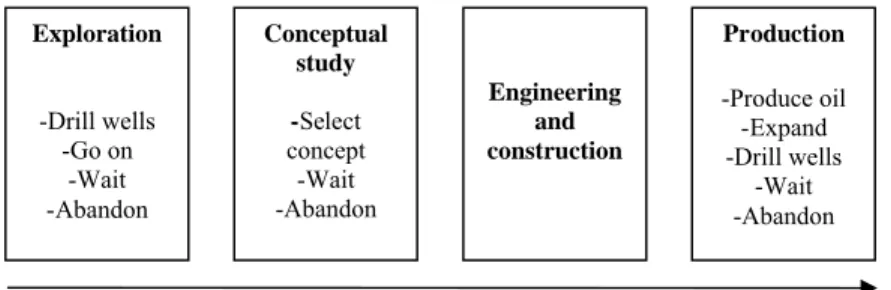
Lund (1999) presents a model determining different phases of oil and gas field developments. The model gives an overview of different decisions that can be made during the lifetime of development projects, and serves as a complement to the value chain analysis performed in section 2.2. Lund considers four phases; exploration, conceptual study, engineering and construction and production.
Figure 4: Decision space related to phases in oil and gas field developments (Lund, 1999)
In the first phase, companies have the possibility to decide whether to drill additional wells in order to obtain more information about total amount of extractable reserves and production rates, to go on with projects immediately, to wait and see or to abandon projects. In other words, companies can choose to invest in additional exploration wells in order to obtain more information.
In the second phase, companies should decide a development concept. A concept is defined by the installed production capacity of the production facilities and the option to increase this capacity during production. The production capacity relates to developments’ production, processing and storing facilities. In other words, operators decide initial production capacity and the possibility of increasing capacity at later stages. Companies can choose to invest in a more expensive concept with capacity flexibility. In addition, companies have the choice to wait and see and to abandon projects.
The third phase, engineering and construction, contains no decisions but carries out the decisions made in the conceptual study phase. In the fourth phase, production, companies can decide the level of production according to the choices made in the conceptual study phase. The drilling of additional production wells and expansion of developments’ production capacity can increase production and profitability if market conditions are advantageous. In addition, companies can choose to wait and see and to abandon projects.
Exploration
-Drill wells -Go on
-Wait -Abandon
Engineering and construction Conceptual
study
-Select
concept -Wait -Abandon
Production -Produce oil -Expand -Drill wells
-Wait -Abandon
3.0 Discounted Cash Flow Analysis
“Discounted cash flow techniques are rather like a loaded gun – able to hit the target in the hands of the marksman but a general hazard in the hands of the amateur”
-Robert Booth 3.1 Introduction
As described earlier, dcf-analysis seems to be the most popular and applied capital budgeting tool. According to Emhjellen and Alaouze (2003), the discounted net cash flow method is still the most common valuation method used by oil companies. In his article “Great Moments in Financial Economics”, Rubinstein (2003) points out the publication “The Theory of Interest”, written by Irving Fisher in 1930, as the first to derive present value calculations as a natural economic outcome in calculating wealth, and to justify maximization of present value as the goal of production. Fisher also derives the determinants of the interest rates used to calculate present value.
Rubinstein also points out John Burr Williams as one on the first economists to interpret stock prices as determined by “intrinsic value” (that is discounted dividends). According to Rubinstein, Williams’s “The theory of Investment Value” (1938) did not originate the idea of present value, but developed many implications of the idea that the value of a stock under conditions of certainty is the present value of all its future dividends.
Dcf-analysis can be divided into two main categories, the net present value method (NPV) and the internal rate of return method (IRR). The two methods have many similarities, but also some important differences. The following section explains a general model of dcf-analysis, section 3.3 explains differences between NPV and IRR.
3.2 Variables in dcf-analysis
The logic behind dcf-analysis is to forecast relevant future cash flows and take the issue of time into account by discounting the cash flows back to present value. The process is performed by the help of a discount rate, representing opportunity costs and risk. The aim of this cost-benefit analysis is to find expected present value of future income and costs, and to compare this value with projects’ investment costs. The difference between the present value
of net income and the project’s investment costs is the project’s expected net present value (NPV).
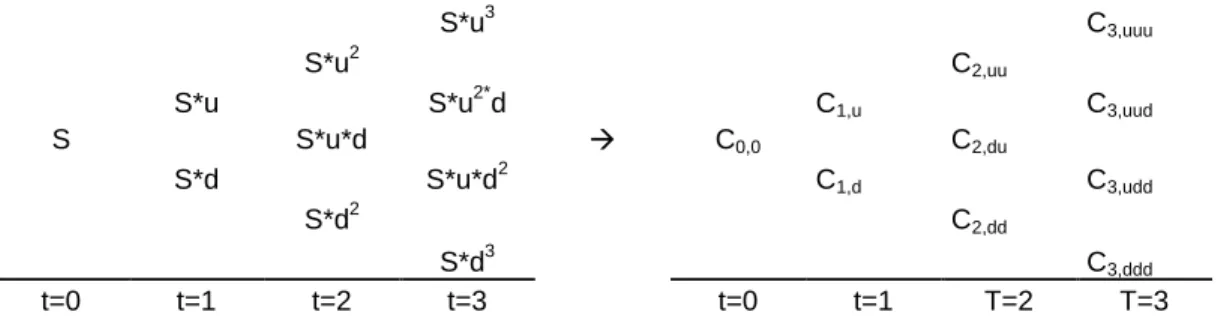
The following section gives a comprehensive overview of the variables in the model when applied in the upstream petroleum industry. In order to make the analysis understandable and manageable, some delimitations and specifications should be made. The analysis considers an example of a development project located in the “resources under evaluation” part of the value chain (figure 3). Seismic surveys and exploration drilling have been conducted, and the holder of the license must decide whether to wait, develop, expand or abandon the project. In terms of figure 4, the project is located in the exploration phase, where decisions should be made regarding drilling more wells, going forward, wait and see or to abandon the project. Formula (1) shows the standard expression for calculation of NPVs. The next section explains the attributes of the various variables in the expression.
(1)
n
t t
t
r C C
NPV
1 0
) 1 (
3.2.1 C0 - Investments
Investments have to be made in order to develop oil and gas fields. The size and time profile of these investments depend on the scale and structure of the project. Development of oil and gas fields often involves high complexity, long time horizons and multiple phases. Projects on the NCS involve investments in exploration, conceptual studies, engineering and facilities for production, storage, processing and housing.
Infrastructure for transportation of petroleum is another important feature that must be in place. In some cases, it may be possible to cooperate with other companies on the NCS. In developed and mature areas of the NCS pipelines may already be in place. During the last years the industry’s focus has turned towards areas located in the northern parts of the NCS. The fields located in the southern parts of the NCS; The North Sea and The Norwegian Sea, can be characterized as mature. Probabilities are high that these areas already have peaked in terms of production. In order to sustain high production, new big discoveries must be made. Development of new areas in the northern parts of the NCS will require high investments in infrastructure and transportation.
3.2.2 Ct - Cash Flows
In order to calculate expected NPV, future cash flows must be forecasted. Cash flows from an oil and gas field development consists of several factors that can be divided into two categories: revenues and costs. Revenues consist of the amount of oil and gas produced times the price of oil and gas. As described earlier, both oil price and production rates are subject to uncertainty and fluctuations, making it difficult to forecast income.
In order to estimate free cash flows, costs must be subtracted from revenues. Operational- and maintenance-costs are the two main categories of costs. Examples of operational costs involve personnel, transportation of personnel and various input factors like water and CO2 for
injection in wells in order to increase pressure and production, electricity/energy to operate production equipment and costs associated with renting pipelines and other infrastructure. Maintenance costs involve expected and unexpected maintenance and repairing of equipment and all other facilities connected to an oil and gas field. As described earlier, costs can be subject to inflation.
Due to operations and activities in several countries, many upstream petroleum companies are international companies. This may lead to situations where companies face costs and revenues in different currencies. Petroleum products are traded in dollar, creating revenues in dollar. Companies operating on the NCS have a great deal of its costs in NOK. Movements in the relationship dollar/NOK can give substantial currency effects, affecting the profitability of projects. When the relative price of one dollar increases, revenues increase, and vice versa. Another important factor affecting cash flows of petroleum companies is taxes. In principal, the state of Norway has the ownership of the natural resources located on the NCS. The state of Norway claims this value through taxation of oil and gas activities and charges/fees. In addition, the state also has direct ownership in oil fields and receives dividends from its ownership in StatoilHydro. The petroleum taxation is based on the Norwegian rules for ordinary corporation tax (28 %). Due to the extraordinary profitability associated with production of petroleum resources, a special tax is charged on income from these activities (50%).
When calculating taxable income for both ordinary and special taxes, an investment is subject to depreciation on a linear basis over six years from the date it was made. Companies can
deduct all relevant expenses, including exploration, research and development, net financial, operating and decommissioning expenses. In order to protect the normal return from the special tax, an extra deduction, the uplift, is allowed in the calculation base for special tax. This amounts to 30 percent of the investments (7.5 % per annum in four years from the year the investment was made). Companies that are not in tax position may carry forward their losses and the uplift with interest. An application may also be made for refund of the fiscal value of exploration costs in companies’ tax returns. (Samuelsen, 2006)
Other important taxes linked to petroleum activities are the carbon dioxide tax (CO2), NOxtax
and the area fee. The CO2tax was introduced in 1991 and is an instrument for reducing CO2
emissions in the petroleum industry. CO2 tax is charged at a rate per standard cubic meter
(scm) of gas burned or directly released, and per litre of petroleum burned. The rate for 2008 is NOK 0.45 per litre of petroleum or scm of gas. Pursuant to the Gothenburg Protocol of 1999, Norway has an obligation to reduce annual emissions of nitrogen oxides (NOX). In
order to fulfil this obligation, a NOxtax was introduced from 1 January 2007. For 2008, the
tax is NOK 15.39 per kg of NOx. The area fee is intended to be an instrument that contributes
to efficient exploration of awarded acreage, so that potential resources are produced as quickly as possible within a prudent financial framework, as well as to extend the lifetime of existing fields. In 2007, direct taxes accounted for 58 % of Norway’s cash flow from petroleum activities, while environmental fees and the area fee accounted for 0,1 % (FACTS-The Norwegian Petroleum Sector 2008). In other words, direct taxes are with no doubt the biggest tax expense for companies operating on the NCS. As a consequence, the case study does not consider environmental- and area fees.
3.2.3 r - Discount Rate
The purpose of the discount rate is to find the present value of future cash flows. Alternative terms for the discount rate are required rate of return, capital cost and alternative cost. Risky projects, all other things equal, are less valuable than safe projects. As a consequence, investors or companies demand higher rates of return from risky projects. R represents the company’s cost related to not employing the capital in alternative investments. When considering projects where cash flows are known in advance, the rate of return associated with other risk-free investments, such as bank deposits, makes the basis for the discount rate to be used in NPV calculations. When cash flows are uncertain, like in oil and gas field developments, they are normally represented by their expected values and the rate of return is
increased on the basis of the Capital Asset Pricing Model (CAPM) in order to outweigh the possibilities for undesirable outcomes (Risk Management, 2007).
It is not always straight forward to find the appropriate discount rate to be used in valuation of investments. Weitzman (2001) states: “The most critical single problem with discounting future benefits and costs is that no consensus now exists […] about what actual interest to use […] Therefore […] we should be operating from within a framework that incorporates the irreducible uncertainty about interest rates directly into our benefit-cost methodology”. In another article, he states: “While there is uncertainty about almost everything in the distant future, perhaps the most fundamental uncertainty of all concerns the discount rate itself” (Weitzman 1998).
When determining discount rates, many companies start with the company cost of capital, which is the opportunity cost of capital for investments in the company as a whole. The company cost of capital can be calculated as a weighted average cost of capital, meaning the average rate of return demanded by investors in the company’s debt and equity securities. This measure is often called “WACC”, or Weighted Average Cost of Capital. If a project is considered to be equally risky as the company’s existing business, the cash flows of the project should be discounted by the WACC. Formula (2) shows the formula for calculating WACC, the next section explains the formula in further detail.
(2) Company Debt REquity
Debt Equity R
Equity Debt
WACC
RDebt is the cost of debt, meaning the interest rate companies pay for their debt. The two
fractions represent debt and equity ratios. In order to calculate the WACC, companies need an estimate of the cost of equity (REquity). Many companies use the Capital Asset Pricing Model
(CAPM) to calculate the cost of equity. Investors investing in an upstream petroleum company should consider two types of risk; unsystematic risk and systematic risk. Unsystematic risk is company or industry specific risk, and relates to risk associated with bankruptcy, financial distress, strike and other risk inherent in each investment. Investors can remove unsystematic risk by investing in a market portfolio (diversification). Systematic risk is associated with variables that affect the entire market, and examples include wars, recessions and interest rates. These kinds of risk cannot be avoided through diversification.
The CAPM assumes that investors are well diversified when the cost of equity is calculated. Formula (3) presents the CAPM, the next section explains the model in further detail.
(3) REquity Rf Equity(RMarketRf),
REquity is the cost of equity, Rfis the risk free interest rate, βEquityis the systematic risk of the
equity and RMarket is the expected return of the market portfolio. The risk free interest rate is
the amount received from investing in securities considered to have no credit risk. Examples include government bonds and bank deposits. The beta of the equity measures how much the company’s share price moves compared to the market as a whole. A beta of one indicates that the share price moves in line with the market. If beta is bigger or smaller than one, the share price of the company moves respectively more or less than the market. The last part of equation (3) determines the equity market risk premium, ensuring that the cost of equity increases linearly with the systematic risk of the equity.
Estimating company beta can be done by regressing historical movements in share prices with historical movements in market returns. By doing so, it is possible to find the proportion of the total variance in the share’s returns that can be explained by market movements, and the proportion that can be explained by company specific movements. Brealy, Myers and Allen (2006) emphasize that the estimation of individual betas are just estimations. Estimation errors can easily occur, and results may vary when data from different time periods are considered. In order to improve the accuracy of betas, Brealey, Myers and Allen suggest using industry betas. They found that estimation errors tend to cancel out when estimating betas of portfolios. A lower standard error of the estimates was achieved when using industry betas instead of individual betas.
Considering the possibility of estimating wrong beta, the possibility of facing a project that does not have the same risk profile as the company’s existing business and the possibility of investing in assets with no convenient price record, some general guidelines for setting discount rates when you don’t have a beta should be made. Brealey, Myers and Allen propose three pieces of advice. Number one is to avoid fudge factors, meaning that managers should not add fudge factors to the discount rate in order to offset possible bad outcomes. Adjustments should instead be made to forecasted cash flows. The probability of different
outcomes should be taken into account in forecasted cash flows instead of increasing the discount rate by some percentage.
Advice number two highlights the importance of thinking about determinants of the asset betas. The characteristics of high- and low-beta assets can often be observed when the beta itself cannot be. Examples include cyclicality and operating leverage. Investors should demand a higher rate of return from investments whose performance is strongly tied to the performance of the economy. Further on, high fixed costs compared to variable costs equals high operating leverage. High operating leverage equals high risk. At last, Brealey, Myers and Allen state that beta should not be confused with diversifiable risk. A project may look extra risky viewed from close range, but if the project’s uncertainties are not correlated with the market or other macroeconomic risks, then the project is only average-risk to a diversified investor.
In their article, Emhjellen and Alaouze (2002) argument for an alternative discount rate approach compared to the traditional WACC and CAPM. In investment projects recognized by a cost cash flow and a revenue cash flow with different systematic risk, cost cash flows should be discounted by one discount rate and revenue cash flows by another. This approach is called the separate discounting method. According to earlier work by the same authors, development cost factors in the petroleum industry have low systematic risk. The risk free rate of return was used to discount expected after tax cost cash flows, while a higher discount factor was used to discount expected after tax revenue cash flows. When comparing these two approaches on various projects, Emhjellen and Alaouze found substantially different NPV’s for many projects. The paper concludes with the separate discounting method resulting in better estimates of project NPVs than the WACC method.
3.2.4 n – Time Horizon
Upstream petroleum projects often have long time horizons covering more than 20-30 years depending on amount of extractable reserves, production rates and other economical considerations. The effect of discount rates increase linearly with the length of the time horizon considered. This attribute creates additional challenges in estimation of discount rates. Small differences in discount rates can give big differences in expected net present values of projects.
In traditional dcf-analysis, discount rates are normally assumed to be constant during the lifetime of projects. However, it may be the case that discount rates should not be considered to be constant over long time horizons. The risk of projects may change as time goes by and initial investments are repaid. In their article, Dalen, Hoel and Strøm (2008) emphasize that especially for projects with long durations, the discount rate plays a crucial role when determining whether projects are profitable or not. The article gives arguments for the discount rate not being constant, but instead decreasing as time goes by. It points out that the petroleum industry has shown an increasing trend in prioritizing short term profitability measures. If this is the case, petroleum companies use higher discount rates resulting in less interest in investing in long term projects. As described earlier, long time horizons also create big ranges of possible outcomes with regards to oil price levels, costs and other unexpected events.
3.3 Different DCF-Techniques
3.3.1 NPV
The most used dcf-technique is NPV. The output of the analysis is a NPV figure, telling decision makers what the project is worth in terms of money at the date of the analysis. Projects with a positive NPV are worth more than they cost. Projects with positive NPVs should be undertaken, while projects with negative NPVs should not be undertaken. However, the NPV should always be evaluated in terms of the financial size of the project. As an example, companies should be careful about investing in projects with high capex and high opex and only marginally positive NPVs.
3.3.2 IRR
The output of IRR analysis is the project’s internal rate of return. The internal rate of return is defined as the rate of discount that makes NPV=0. The IRR rule states that companies should accept investment opportunities offering rates of return in excess of their opportunity costs of capital. Finding the IRR of a project lasting T years is solved for IRR in expression (4). This calculation usually involves trial and error. The expression can also be solved graphically.
(4) 0
) 1 ( ... ) 1 (
1 2
2 1
0
T T
IRR C IRR
C IRR
C C NPV
Brealey, Myers and Allen (2006) derive four pitfalls of the IRR method. Number one involves challenges associated with determination of whether cash flows represent lending or borrowing. If a project offers positive cash flows followed by negative cash flows, NPV can rise as the discount rate is increased. Number two involves projects with cash flows that change signs more than one time. If this is the case, the project may have several IRRs or no IRR at all. This may be the case in oil and gas field developments, where capex, production and liquidation cause cash flows to change signs more than one time throughout the lifetime of projects. Pitfall number three involves IRR not being able to rank projects of different scale, and the inability to rank projects with different patterns of cash flows over time. The last pitfall described by Brealey, Myers and Allen stems from the possibility of the cost of capital for near-term cash flows being different from the cost of capital for distant cash flows. The IRR rule requires comparison of projects’ IRR with the opportunity cost of capital. Sometimes this cost of capital differs over time, and there may be no simple yardstick for evaluating IRRs of projects. (Brealey, Myers and Allen, 2006)
It seems that pitfall two and four are most relevant in terms of oil and gas field developments. Cash flows changing signs more than one time, and long time horizons make the NPV rule better suited than the IRR rule in valuation of oil and gas field developments.
3.4 Accounting for Uncertainty and Risk
According to French and Gabrielli (2005), uncertainty impacts upon the valuation process in two ways: first, cash flows from investment are to varying degrees uncertain, and secondly, the resulting valuation figure is therefore open to uncertainty. The authors state that: “Uncertainty is anything that is not known about the outcome of a valuation at the date of the valuation, whereas risk is the measurement of the value not being as estimated”. A major challenge in valuation of oil and gas field developments is to incorporate the factors of uncertainty into the valuation model. Two main methods for accounting for uncertainty exist. The first involves adjusting the discount rate (see section 3.2.3). By increasing the discount rate, future and uncertain cash flows are valued lower. This results in lower project NPVs, and increases projects’ requirements of quality and profitability in order to be undertaken. The second method involves adjusting forecasted cash flows. Variables determining cash flows can move in different directions. Companies can account for uncertainty by forecasting subjective or statistical movements in these variables. Expected NPVs of projects are only as accurate as the accuracy of forecasted cash flows and the correctness of the discount rate. The
following sections examine different ways of accounting for uncertainty by adjusting forecasted cash flows.
3.4.1 Sensitivity Analysis
Sensitivity analysis involves identifying key factors that determine the profitability of projects. In oil and gas field developments key factors include oil price, total amount of extractable reserves, production rates, opex and capex. Other unidentified variables may be identified as projects move forward. Optimistic and pessimistic estimates should be given for the value of these identified factors. By changing key factors one at the time according to the optimistic and pessimistic estimates, it is possible to see how profitability is affected by changes. This analysis enables decision makers to get a better understanding of key drivers in projects, which should result in better investment decisions. Decision makers will be able to identify uncertainty factors of highest importance, and to locate areas where the company should invest in order to get additional information before final decisions are made.
Sensitivity analysis has some important drawbacks. The first is that it will always produce ambiguous results. It is difficult to determine what optimistic and pessimistic levels really are or should be. Another important problem is that key factors probably are interrelated. An increase in oil price levels will probably increase the activity in the industry, creating higher demand and probably higher costs. Estimation of future correlation between different key factors represents an important challenge in valuation of projects. (Brealey, Myers and Allen, 2006)
3.4.2 Scenario Analysis
Considering that key factors may be correlated, a possible approach is to analyze various possible scenarios. An example of the application of this approach is the Norwegian Petroleum Directorate’s scenario analysis about the development of the NCS. The analysis proposes four possible scenarios: Full speed ahead, Techno lab, Sorry we’re closed and Blood, sweat and tears. This is done by anticipating the development of oil and gas prices, the amount and size of new discoveries and global supply and demand of oil and gas.9
With regards to oil and gas field developments, scenario analysis can be used to anticipate different oil and gas price levels with combinations of different values of other key factors. It allows project managers to look at different, but consistent combinations of key factors. Different NPVs are calculated under different scenarios, and serves as a help in the decision making process. (Brealey, Myers and Allen, 2006)
3.4.3 Break-Even Analysis
Break-even analysis involves asking the question: At what level of oil and gas prices is the project no longer profitable? , or alternatively: What amount of extractable reserves does the field need in order to be profitable? The aim of the analysis is to find levels of key factors that ensure projects to not lose money. These measures are easy to interpret, easy to understand and an intuitive way of framing investment decisions. (Brealey, Myers and Allen, 2006)
3.4.4 Monte Carlo Simulation
The methods described above consider changes in one or a limited number of key factors at a time. Monte Carlo simulation is a tool for considering all possible combinations and enables decision makers to inspect an entire distribution of project outcomes. It is a problem solving technique used to approximate the probability of certain outcomes by running multiple trial runs using random variables.10A Monte Carlo simulation is undertaken by modeling a project
and its key factors affecting the profitability of the project. A computer with proper software is asked to simulate all possible outcomes for the project. The simulation should be done as many times as possible. By analyzing the results it is possible to plot a frequency distribution of the outcomes and to calculate expected values, upper limits and lower limits.
The process can be divided into four steps. Step number one is to model the project. The computer needs a precise model of the project, including revenue and cost equations and the interdependence between different periods and different variables. Step two involves specifying probabilities for estimation errors. The estimation of different key factors should be given with corresponding optimistic and pessimistic estimates. This should enable you to specify probabilities for estimation errors. Step number three involves simulation of cash flows. The computer samples from the distribution of the forecast errors, calculates the resulting cash flows for each period, and records them. After many simulations, accurate
estimates of probability distributions of project cash flows will occur. The last step involves calculating NPVs. The distributions of the project cash flows should enable decision makers to calculate expected cash flows more accurately. (Brealey, Myers and Allen, 2006)
Monte Carlo simulation allows decision makers to combine knowledge from many individuals into one model. Different analysts from specific competence areas, such as costs, market conditions and engineering can communicate their beliefs about the project. These beliefs can be transformed into probability distributions and incorporated into a model of Monte Carlo simulation. It allows different experts to work individually, but at the same time incorporate all expertise into one model and one output. (Mccray, 1975)
Drawbacks of the Monte Carlo simulation include time and resources in building an accurate model of the project. It is difficult to estimate correlation between variables and underlying probability distributions. If the model and the underlying variables are wrong, the results of the simulations will be wrong. The simulation will only be as good as the estimates and the correctness of the model. (Brealey, Myers and Allen, 2006)
3.4.5 Implicit Valuation Models vs. Explicit Valuation Models
In their article, French and Gabrielli (2005) highlight the difference between implicit valuation models and explicit valuation models. They apply the theory on property investments, but parallels can be drawn to oil and gas field developments. In the implicit valuation model, the valuer derives an appropriate all risks yield from market evidence or other transactions. The all risks yield states that comparable investments customarily sell for a certain multiplier of the income (rent, or revenues from oil production). Adjustments to the all risks yield in order to reflect differences between comparables and the subject investment are made subjectively. When there are sufficient sales transactions, or similar projects, it is possible to build up a picture of market sentiment to be reflected in the choice of an appropriate all risks yield for the subject property. This method gives no indication of the holding period or the overall required rate of return. The all risks yield is supposed to include all these factors implicitly. (French and Gabrielli 2005)
This method does not seem applicable for oil and gas field developments. The reason is that petroleum projects are normally very different in terms of capex, size, complexity, risk and technology. Contrary to real estate and properties, it is not possible to find sufficient “sales