Comparative Study for Melt Flow Index of Different
Microstructure Polyethylene
Raza Muhammad Khan, Asim Mushtaq*, Amina Israr, Asra Nafees
Polymer and Petrochemical Engineering Department, NED University of Engineering & Technology, Karachi, Sindh, Pakistan.
Correspondence Author: Email: [email protected]
Abstract
This study focus on the rheological behavior of polyethylene. The effect of molecular weight for three different types of polyethylene were study; high density polyethylene (HDPE), linear low density polyethylene (LLDPE) andlow density polyethylene (LDPE). To find the rheological behaviour of the polymer, melt flow indexer and capillary rheometer were used in this study. The shear stress and shear viscosity obtained from these three different polyethylene polymers were compared with the shear rate. It was observed that with the increase in shear rate, shear stress also increases. The behaviour of viscosity for HDPE, LLDPE and LDPE also discussed at the varying amount of shear rate. It was also found that viscosity of HDPE, LLDPE and LDPE decreases with increasing shear rate. The value of log shear stress of HDPE increases with an increase in log shear rate. The value of extension viscosity decreases from 8.295 to 1.606 KPa.s with a very high increase in extension rate of 23.5 s-1 to 721 s-1. Molecular mass and its distribution have a significant effect on the rheological behavior of polymers.
Key Words:
Melt flow index, Polyethylene, Extension Rate, Shear Stress, Shear Viscosity1.
Introduction
From the past two decades, the plastic industry has grown significantly, lots of plastic are consuming millions of material every year. Nowadays all these are looking for various techniques of characterization in order to avoid batch to batch variation. The variation in properties during processing and the processing of polymer have very costly. For considering the batch to batch variation, one must know the polymerization process. In the polymerization process the monomer or mixture of monomer used in the reaction kettle in the presence of a catalyst, initiator or water. This will depend upon the type of polymerization. After the reaction, these monomer converts into the polymer. The distribution of the molecule in polymers vary significantly; it may be narrow distribution or broad distribution. Because of this variation, there is a need for material characterization test. There is a different way of material characterization, some of them are very simple and some are very complex. The most common test of material characterizations is melt index (flow rate), viscosity test, capillary rheometer test, gel permeation chromatography test and analytical test [1, 2].
Rheology is defined as the flow of fluids and deformation of solids under stresses and strain. The rheometer is the instrument used to measure a material’s rheological properties. There are many types of Rheometer that are available
with versatile properties; these are controlled stress and strain Rheometer and capillary Rheometer. Rheology of the polymer melt is influenced by different parameters such as the design of equipment, the structure of the polymer and processing of the polymer. In the rheological measurement, the most important concepts are defined by shear stress, shear rate, viscosity elasticity and extensional viscosity [3]. The scope of the study is to compare the flow behavior of the different grades of Polyethylene.
2.
Materials and Methods
“Polyethylene is light weight flexible, tough, chemical resistant polymer”. Concerning electrical insulation polyethylene exhibits outstanding properties. Because of these properties, Polyethylene is widely used in the packaging industry. The general empirical formula for Polyethylene is [–CH2 – CH2 -] which shows ethylene unit of the polymer. The molecular structure depends upon the polymerization reaction condition [1, 2].
High density polyethylene is a linear structure polymer with little branching. Because of this structure, the polymer is highly crystalline and give the following advantages in comparison with Low density polyethylene. It increases stiffness, tensile strength and hardness. However, the impact strength and environmental stress crack are reduced because of the crystalline nature of HDPE
[4-6]. The HDPE form pellets have been purchased by Sigma Aldrich, Germany. The product grade is 547999, density 0.965 g/mL at 25 °C andhigh density average Mw ~125,000.
Low density polyethylene has a branched chain structure. Because of structural symmetry of molecules, the nature of polyethylene is partially crystalline.” Complete crystallization is prevented since the highly branched regions of the polymers chain will not pack closely, leaving unordered regions in the molecule” [7-9]. The LDPE have been purchased by Sigma Aldrich, Germany. The product grade is 428043, density 0.925 g/mL at 25 °C and low density average Mw ~847,00.
Linear low density polyethylene has a linear structure with short side chains. The highly crystalline structure is formed because of these short side chains similar to high density polyethylene. Low density polyethylene gives advantages because of its short chain. It has a high tensile strength, high melting point, higher flexural modulus, better elongation, and better environmental stress crack resistance [10-12]. The LLDPE have been purchased by Sigma Aldrich, Germany. The product grade is 428078, density is 0.918 g/ml at 25 °C and linear low density average Mw ~837,00.
The shear stress and shear rate are determined by the Eq. (1) and (2) respectively [13].
( ) ̇
( ) where; F is the force, A is the area, m is the mass, g is the gravitational constant, r is the radius and Q is the flow rate.
For the characterization of the above material the equipment used are melted flow indexer and capillary rheometer. The melt flow indexer (MFI)
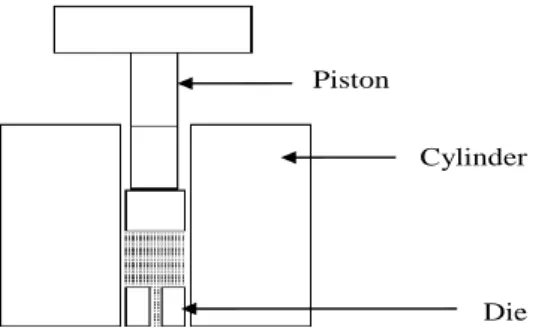
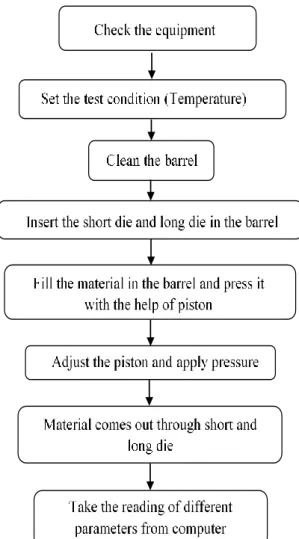
is the equipment for evaluating melt flow properties in the plastics industries. MFI are easy to operate and usually economical. It required less of expertise to decipher the outcomes. The essential test utilizes a solitary dead weight to record the amount of material expelled over a settled timeframe. Thus, the MFI rapidly turned into the true standard in the plastics business [14, 15]. The melt index tests measure the rate of extrusion of thermoplastic material through a hole of a particular length and diameter across under endorsed states of temperature and pressure as appeared in Fig. 1. The significance of the MFI is; it characterize the behaviour of molten plastic, measures the uniformity in the flow, the grades of the polymers can be differentiated and used for quality control. It is used to determine the extent of degradation. Melt flow indexer consists of piston, cylinder, die and heater. The material is kept in the cylinder and heated with the help of heaters. After heating the molten material is pushed out from the die with the help of piston as shown in Fig. 2. The methodology of MFI is given in Fig. 3.
The rheometer is used to measure the rheological properties of a material. They can rapidly and effortlessly measure the flow properties of material over the full range of pressures, temperatures, forces, geometry and that are experienced in actual procedures. Capillary rheometer is a technique whereby a sample is extruded through a die of definite dimensions and the shear pressure drop across the die noted at set volumetric flow rates. Capillary rheometer comprised of a temperature-controlled barrel integrating at least one precision bores fixed with capillary dies at the exit as shown in Fig. 4. Pressure transducers are mounted quickly over the dies to record the pressure drop since the material tested is extruded over the dies [3, 12]. The methodology of capillary rheometer is given in Fig. 5.
Fig. 1: Typical structure of melt flow indexer
(a) (b)
Fig. 2: (a) Kanyeness melt flow indexer used for
the characterization of HDPE, LDPE and LLDPE (b) The dies used in melt flow molten material is pushed out from the die with the help of piston.
Figure 1 : Shows the typical structure of Melt Flow Indexer. Piston
Cylinder
Fig. 3: Test procedure for melt flow indexer
(b)
(a) (c)
Fig. 4: (a) Bohun Instruments RH 10 advanced
capillary rheometer (b) Closer view of capillary rheometer showing the pistons (c) View of capillary dies, the short die is used for an extension while the long die is used for Shear
Fig. 5: Test procedure for capillary rheometer
3.
Results
Fig. 6 shows the flow curve of LDPE, HDPE and LLDPE at 90oC obtained with the capillary dies of length 8.0 x 10⁻³ m. The plotted curve shows the viscoelastic curve of LDPE, HDPE and LLDPE at 190oC. The data indicated the effect of pressure on the viscosity of material as discussed in the literature [3].
During the first run to carry out the effect of pressure isothermally the results explains that with the increase in shear rate the shear stress increases in LDPE, HDPE and LLDPE. At the value of a very small shear rate (100s-1) HDPE shows the stress value around 91.7 KPa which is lowest as compared to LDPE and LLDPE having a value of 178.64 KPa and 108.41 KPa respectively. This behaviour was studied by Mnekbi Cheima, which predict the viscosity-pressure dependency on HDPE due to increase in pressure as the shear rate increases [5].
Similar behaviour was shown by LDPE, where the value of shear stress is 108.41KPa at a shear rate of 100 s-1. The behaviour was studied by Burghelea, explains at greater rate of deformation the maximum value is stress is observed however the deformation is inhomogeneous [15]. The summarized result for shear stress and shear rate of HDPE, LLDPE and LDPE are shown in Table 1. Analogous experiments were performed on LLDPE, but there lies an anomaly, the shear stress increases with increasing the shear strain from 178.64 KPa (at 100s-1) to a value of 350 KPa (at 750 s-1). However, after this value, the stress decrease to 343 KPa and again raised till the value
of 434 KPa at a strain of 5000 s-1. The C-C bond flexibility leading low glass transition temperature. However, the Tg is related with the movement of moderately long segments in the amorphous region hence in a crystalline polymer there are few such portions the Tg has minimal physical importance [16].
The appearance of this hump was studied by Weon Jong, describes that the crosslinking density of LLDPE effect the thermal properties of the material [17].
Fig. 6: Comparison between shear stress and shear
rate of HDPE, LLDPE and LDPE
Fig. 7: Comparison between shear viscosity and
shear rate of HDPE, LLDPE and LDPE (Capillary Rheometer)
Table 1: Summarized result for shear stress and shear rate of HDPE, LLDPE and LDPE
HDPE LLDPE LDPE
Shear rate (s-1)
Shear stress (kPa)
Shear rate (s-1)
Shear stress (kPa)
Shear rate (s-1)
Shear stress (kPa)
100 91.756 100 178.643 100 108.414 248.146 161.551 248.118 272.938 248.146 151.190 499.162 227.079 498.937 343.895 498.937 193.465 750.515 269.565 750.937 350.973 750.459 222.878 999.337 300.186 999.703 343.585 999.506 243.588 2499.693 364.647 2500.087 392.157 2499.159 319.640 5000.315 376.031 4999.781 434.486 5000.034 381.778
Fig. 7 depicts the behaviour of viscosity by varying the amount of shear rate. At shear rate 100s-1, HDPE shows the lowest value of viscosity (917 Pa.s) followed by LDPE with viscosity of 1084.14 Pa.s and LLDPE with the value of 1786.47 Pa.s HDPE confirm that with an increase in shear rate there is a decrease in viscosity of HDPE to the value of 75.20 Pa.s at 5000 s-1. This is due to the chain branching significantly affect the viscosity of HDPE [6]. This decrease was also because of the flexible structure backbone and weak intermolecular forces. The most strength of
the polymer is because, crystallization permits molecular packing very closer.
LDPE behaviour can also be studied in Fig. 2 demonstrates the same trend as of HDPE, although the value of viscosity varies from 1084 Pa.s to 76 Pa.s with share strain changing from 100 to 500 s-1. This was reported by Peres Anderson explaining that at the low shear rate the chains are more resistive to deformation, however with an increase in the shear rate the deformation dominant [7]. Table 2 shows the summarized
0 100 200 300 400 500
0 2000 4000 6000
Sh
ea
r
Stre
ss
Shear Rate
HDPE LLDPE LDPE
0 500 1000 1500 2000
0 2000 4000 6000
Sh
ea
r
Vis
co
sity
(
P
a.
s)
Shear Rate (s-1)
LLDPE and LDPE. The experimental results also show that in LLDPE the value of shear viscosity decreases from 1786 to 86 Pa.s with an increase in shear strain form 100 to 5000s-1. The behaviour was explained by Weon Jong, that at constant temperature the increase in shear strain the viscosity decrease due to increase in crosslinking which results in greater value of viscosity among LDPE and HDPE at 5000s-1 [17]. This changed behaviour is due to the variation in the degree of short and long chain branching in the polymer, molecular weight, impurities, the presence of some comonomer residues, and polymerization residues [18, 19].
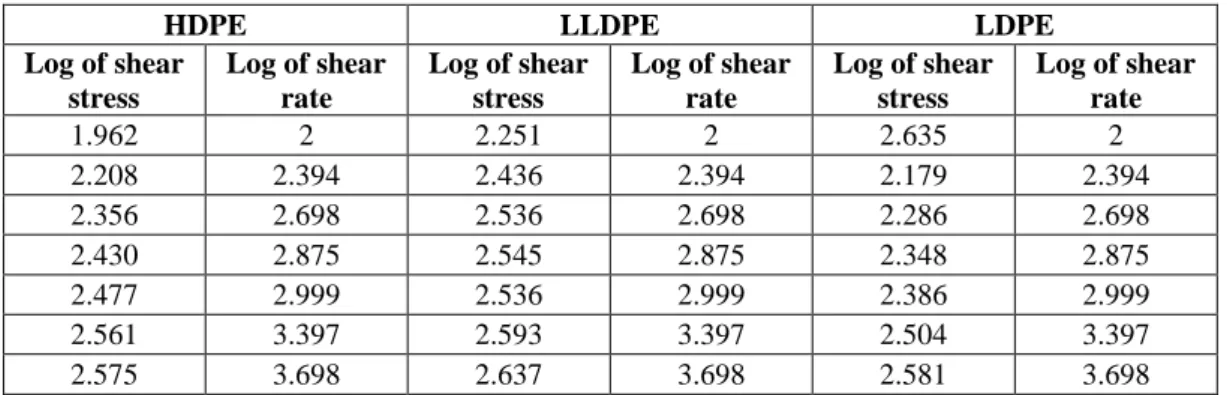
Fig. 8 explains the log-log relationship among shear stress and shear stain HDPE, LDPE and LLDPE. The value of log shear stress of HDPE increases with an increase in log shear rate. The value varies from 1.92 to 2.572 for log shear rate of 2 and 3.69 respectively. Although LDPE shows very different behaviour as compared to HDPE. The curve indicates the value of log shear stress is 2.394. After this point, the trend of LDPE is similar to that of HDPE. The curve of LLDPE explain the similar trend with HDPE, the log value of shear stress is lowest (2.2519) at log shear strain of 2 and increases till 2.637 at the log shear stress of 3.69895, also present in Table 3.
Table 2: Summarized result for shear viscosity and shear rate of HDPE, LLDPE and LDPE
HDPE LLDPE LDPE
Shear rate (s-1)
Shear viscosity (Pa.s)
Shear rate (s-1)
Shear viscosity (Pa.s)
Shear rate (s-1)
Shear viscosity (Pa.s)
100 917.564 100 1786.436 100 1084.145 248.146 651.030 248.118 1100.033 248.146 609.278 499.162 454.920 498.937 689.255 498.937 387.754 750.515 359.173 750.937 467.380 750.459 296.990 999.337 300.385 999.703 343.687 999.506 243.709 2499.693 145.876 2500.087 156.857 2499.159 127.899 5000.315 75.201 4999.781 86.901 5000.034 76.355
Fig. 8: Comparison between log shear stress and log shear rate of HDPE, LLDPE and LDPE
Table 3: Summarized result for log of shear viscosity and log of shear rate of HDPE, LLDPE and LDPE
HDPE LLDPE LDPE
Log of shear stress
Log of shear rate
Log of shear stress
Log of shear rate
Log of shear stress
Log of shear rate
1.962 2 2.251 2 2.635 2 2.208 2.394 2.436 2.394 2.179 2.394 2.356 2.698 2.536 2.698 2.286 2.698 2.430 2.875 2.545 2.875 2.348 2.875 2.477 2.999 2.536 2.999 2.386 2.999 2.561 3.397 2.593 3.397 2.504 3.397 2.575 3.698 2.637 3.698 2.581 3.698
0 0.5 1 1.5 2 2.5 3
1 1.5 2 2.5 3 3.5 4
L
o
g
o
f
Sh
ea
r
Stre
ss
Log of Shear Rate
Fig. 9: Comparison between extensional viscosity and extensional rate of HDPE, LLDPE and LDPE
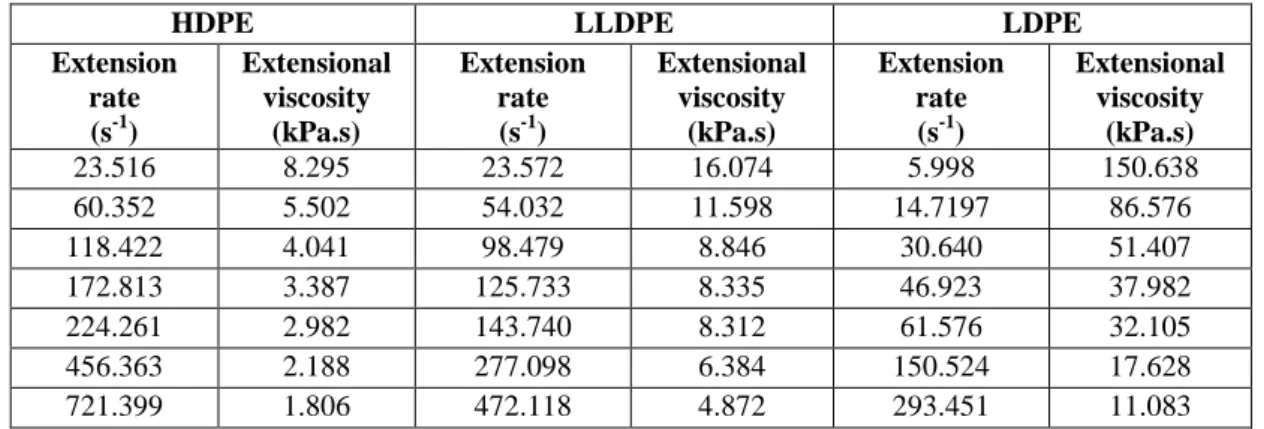
Table 4: Summarized result for extension rate and extension viscosity of HDPE, LLDPE and LDPE
HDPE LLDPE LDPE
Extension rate (s-1)
Extensional viscosity
(kPa.s)
Extension rate (s-1)
Extensional viscosity
(kPa.s)
Extension rate (s-1)
Extensional viscosity
(kPa.s)
23.516 8.295 23.572 16.074 5.998 150.638 60.352 5.502 54.032 11.598 14.7197 86.576 118.422 4.041 98.479 8.846 30.640 51.407 172.813 3.387 125.733 8.335 46.923 37.982 224.261 2.982 143.740 8.312 61.576 32.105 456.363 2.188 277.098 6.384 150.524 17.628 721.399 1.806 472.118 4.872 293.451 11.083
Table 5: MFI, shear stress and shear rate calculated of HDPE, LLDPE and LDPE
Polymers MFI gm/10 min
mx10-6 kg/sec
Flow rate Qx10-9 m3/sec
Shear stress τ Pa
Shear rate ̇ sec-1
HDPE 3.975 6.625 8.728 402449.92 9.6603 LLDPE 1.15 1.9166 2.2084 402461.538 2.44
LDPE 0.22 0.36667 0.39726 402453.89 0.44
The relation between extension viscosity and an extension rate of LDPE, HDPE and LLDPE. The experimental run for HDPE in Fig. 9 shows that with a significant increase in extension rate there is very less decrease in viscosity. The value of extension viscosity decreases from 8.295 to 1.606 KPa.s with a very high increase in extension rate of 23.5 s-1 to 721 s-1. Though LDPE shows a very drastic decline in extension viscosity from 150.63 to 86.57 KPa.s when extension rate decreases from 5.998 s-1 to 14.716 s-1 and this keep on reducing till the value of 0.11 KPa.s when the extension rate increase to 293.4551. Although the LLDPE curve shows the same behaviour as
result for extension rate and extension viscosity of HDPE, LLDPE and LDPE.
Table 5 represents the calculated values of MFI, shear stress and shear rate of HDPE, LLDPE and LDPE at temperature 190oC, mass 2.16 Kg, radius 1.048 x 10⁻³m and length 8.0 x 10⁻³m. The existence of these branch points is restrict to inhibit with the crystallization and this difference is clearly observed in the polymers. The high-pressure polymer has the low density (crystallization is reduced because of close packing), the minimum opacity and lower yield point, melting point and Young’s modulus in
are almost comprised of short side chains (free of long chain branches) through copolymerizing ethylene with a little amount of a complex alkene (oct-I-ene). This branching inhibits with the capability to crystallize the polymer. Thus, the degree of crystallinity mainly affect the properties like; molecular weight differences and small solid displacement that involve large deformations such as melt viscosity, tensile strength, low-temperature brittle point and elongation at break [16, 17, 20]. LDPE has low melt shear sensitivity and strength [3, 8, 21]. The flow of LDPE may restrict due to large chain branches that’s why its MFI is very low. Due to very short chain branches HDPE flows more easily that’s why its melt flow rate is more than the flow rate of LDPE. LLDPE has average branches so it is showing average flow rate.
4.
Conclusions
In polymer processing, it is very important to know the flow behavior of the material. By the characterization techniques, one can check the process ability, rheological and mechanical properties and performance. Melt flow indexer and capillary rheometer were used to study the rheological behaviour of the HDPE, LLDPE and LDPE polymers. Molecular weight and morphology of polymer have a significant effect on the process ability of the polymer through dynamic effects on their rheological properties. The flow rate was measured at single shear stress and shear rate performed at one set of temperature in MFI and the apparent viscosity is calculated while the capillary rheometer measure viscosity over an entire range of shear stress and shear rate. So, it is important to know the flow behavior of polymer in order to set good processing condition on actual processing equipment and avoid batch to batch variation.
5.
Acknowledgment
The authors would like to acknowledge School of Engineering Design and Technology, University of Bradford, United Kingdom and Department of Polymer and Petrochemical Engineering, NED University of Engineering & Technology, Karachi, Pakistan for supporting in this research work.
6.
References
[1] Reynolds, C., Thompson, R., & McLeish, T. (2018). Pressure and shear rate dependence of the viscosity and stress relaxation of
polymer melts. Journal of Rheology, 62(2), 631-642. doi: 10.1122/1.5012969.
[2] Yousfi, M., Alix, S., Lebeau, M., Soulestin, J., Lacrampe, M.-F., & Krawczak, P. (2014). Evaluation of rheological properties of non-Newtonian fluids in micro rheology compounder: Experimental procedures for a reliable polymer melt viscosity measurement. Polymer Testing, 40, 207-217.
doi: 10.1016/j.polymertesting.2014.09.010. [3] Ansari, M., Zisis, T., Hatzikiriakos, S. G., &
Mitsoulis, E. (2012). Capillary flow of low-density polyethylene. Polymer Engineering & Science, 52(3), 649-662. doi: 10.1002/pen.22130.
[4] Drozdov, A. D. (2010). Cyclic thermo-viscoplasticity of high density polyethylene. International Journal of Solids and Structures, 47(11-12), 1592-1602. doi: 10.1016/j.ijsolstr.2010.02.021.
[5] Mnekbi, C., Vincent, M., & Agassant, J. F. (2010). Polymer rheology at high shear rate for microinjection moulding. International Journal of Material Forming, 3(S1), 539-542. doi: 10.1007/s12289-010-0826-9. [6] Musil, J., & Zatloukal, M. (2011).
Experimental investigation of flow induced molecular weight fractionation during extrusion of HDPE polymer melts. Chemical Engineering Science, 66(20), 4814-4823. doi: 10.1016/j.ces.2011.06.047. [7] Peres, A. M., Pires, R. R., & Orefice, R. L.
(2016). Evaluation of the effect of reprocessing on the structure and properties of low density polyethylene/thermoplastic starch blends. Carbohydr Polym, 136, 210-215. doi: 10.1016/j.carbpol.2015.09.047. [8] Djellali, S., Sadoun, T., Haddaoui, N., &
Bergeret, A. (2015). Viscosity and viscoelasticity measurements of low density polyethylene/poly(lactic acid) blends. Polymer Bulletin, 72(5), 1177-1195. doi: 10.1007/s00289-015-1331-6.
[9] Huang, Q., Mangnus, M., Alvarez, N. J., Koopmans, R., & Hassager, O. (2016). A new look at extensional rheology of low-density polyethylene. Rheologica Acta, 55(5), 343-350. doi: 10.1007/s00397-016-0921-z.
[10] Khanoonkon, N., Yoksan, R., & Ogale, A. A. (2016). Effect of stearic acid-grafted starch compatibilizer on properties of linear
low density polyethylene/thermoplastic starch blown film. Carbohydr Polym, 137,
165-173. doi:
10.1016/j.carbpol.2015.10.038
[11] Ansari, M., Derakhshandeh, M., Doufas, A. A., Tomkovic, T., & Hatzikiriakos, S. G. (2018). The role of microstructure on melt fracture of linear low density polyethylenes. Polymer Testing, 67, 266-274. doi: 10.1016/j.polymertesting.2018.03.015 [12] Chen, A.-F., Huang, H.-X., & Guan, W.-S.
(2015). Comparison of superimposed effects in high-shear-rate capillary rheology of polystyrene, polypropylene, and linear low-density polyethylene melts. Polymer Engineering & Science, 55(3), 506-512. doi: 10.1002/pen.23915
[13] Wingstrand, S. L., van Drongelen, M., Mortensen, K., Graham, R. S., Huang, Q., & Hassager, O. (2017). Influence of Extensional Stress Overshoot on Crystallization of LDPE. Macromolecules,
50(3), 1134-1140. doi:
10.1021/acs.macromol.6b02543
[14] Vera-Sorroche, J., Kelly, A. L., Brown, E. C., Gough, T., Abeykoon, C., Coates, P. D., Price, M. (2014). The effect of melt viscosity on thermal efficiency for single screw extrusion of HDPE. Chemical Engineering Research and Design, 92(11), 2404-2412.doi:
10.1016/j.cherd.2013.12.025.
[15] Burghelea, T. I., Starý, Z., & Münstedt, H. (2011). On the “viscosity overshoot” during the uniaxial extension of a low density polyethylene. Journal of Non-Newtonian
Fluid Mechanics, 166(19-20), 1198-1209. doi: 10.1016/j.jnnfm.2011.07.007.
[16] Ebrahimi, M., Tomkovic, T., Liu, G., Doufas, A. A., & Hatzikiriakos, S. G. (2018). Melt fracture of linear low-density polyethylenes: Die geometry and molecular weight characteristics. Physics of Fluids, 30(5), 1-11. doi: 10.1063/1.5029380. [17] Weon, J.-I. (2010). Effects of thermal
ageing on mechanical and thermal behaviors of linear low density polyethylene pipe. Polymer Degradation and Stability, 95(1), 14-20.
doi:10.1016/j.polymdegradstab.2009.10.016 [18] Rasmussen, H. K., & Fasano, A. (2018). Flow and breakup in extension of low-density polyethylene. Rheologica Acta, 57(4), 317-325. doi: 10.1007/s00397-018-1081-0.
[19] Ansari, M., Hatzikiriakos, S. G., & Mitsoulis, E. (2011). Slip effects in HDPE flows. Journal of Non-Newtonian Fluid Mechanics, 167, 18-29. doi: 10.1016/j.jnnfm.2011.09.007.
[20] Li, K., & Matsuba, G. (2017). Effects of relaxation time and zero shear viscosity on structural evolution of linear low-density polyethylene in shear flow. Journal of Applied Polymer Science, 135(13), 1-9. doi: 10.1002/app.46053.
[21] Zatloukal, M. (2016). Measurements and modeling of temperature-strain rate dependent uniaxial and planar extensional viscosities for branched LDPE polymer melt. Polymer, 104, 258-267. doi: 10.1016/j.polymer.2016.04.053.