Probability and Sensitivity Analysis of the Slope Stability of Naulong
Dam
Khan, F.S.1
&
Malik, A.A.21. Senior Geotechnical Engineer, NESPAK, Pakistan. Ph: 03004574353 Email: [email protected]
2. Senior Geotechnical Engineer, NESPAK, Pakistan. Ph: 03334611721 Email: [email protected]
Abstract
Slope stability analysis was carried out for an earthfill dam having a sloping core. From the analysis, it was concluded that the pseudostatic case is critical for this dam. A probability and sensitivity analysis was carried out for some of the cases to assess probability of failure. The materials in the zoned embankment were assigned some variation for the probability analysis which showed that some slip surfaces had a probability of failure which is much greater than an acceptable limit. From the sensitivity analysis it was concluded that the variation in friction angle of the shell material affects the factor of safety more than any other material parameter and variation tried. To get a probability of failure within selected limits the probability analysis was carried out on revised downstream slopes to see the difference in probability of failure after the slopes are flattened from 1.75H:1V to 2H:1V and 2.25H:1V.
Key Words
: Probability and sensitivity analysis; parameter variability; earthfill dam.1. Introduction
The proposed Naulong Dam will be located on Mula river at Sunth, about 30 Km from Gandava town in Tehsil and District Jhal Magsi of Balochistan Province. The services of Naulong Dam Project Consultants – a consortium led by Pakistan Engineering Services (Ltd), and joined by Barqaab Consulting Services (Pvt) Ltd and Development and Management Consultants - were hired by Water and Power Development Authority (WAPDA) in December 2006 for carrying out the Project Planning Studies, Detailed Engineering Design and preparation of Tender Documents.
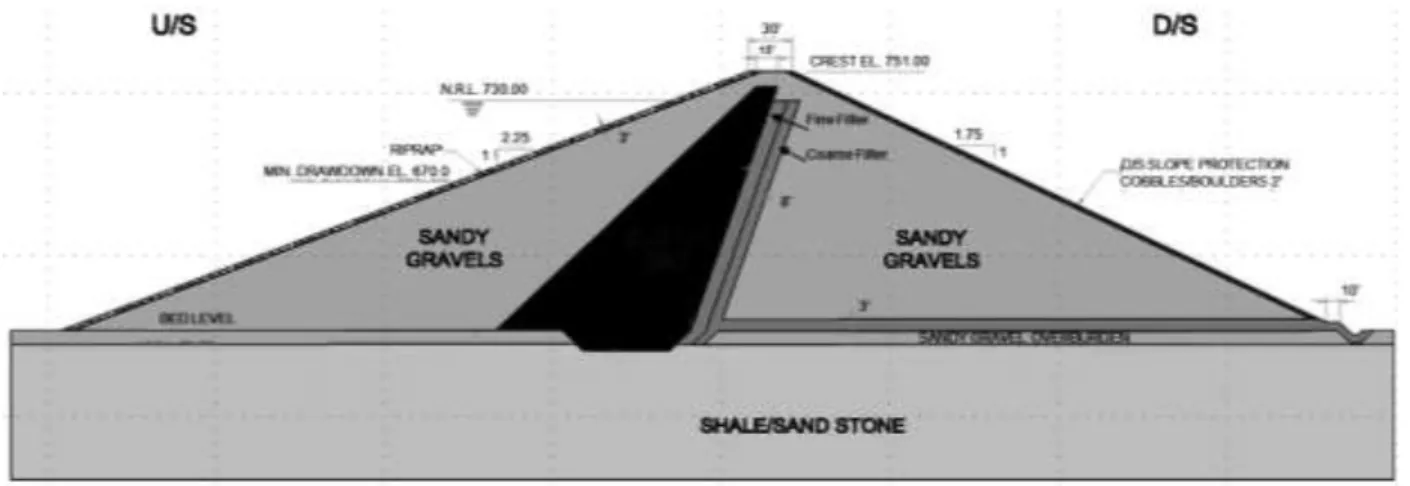
The geotechnical analysis of Naulong dam was carried out by the consultants, Pakistan Engineering Services and the final selected upstream and downstream slopes are 2.25H:1V and 1.75H:1V respectively. The typical section of the main dam is shown in the figure 1 below:
Slope stability analysis of earthen dams and slopes has advanced from deterministic approaches to more advanced probabilistic methods which has been shown to lead to a more economical design by many researchers et al. [2]. There is always a certain level of uncertainty in geotechnical design parameters either through testing and human errors or because of
the special variability due to the natural heterogeneity of soils. The probabilistic approach considers this spatial variability in the slope stability analysis.
The traditional deterministic approaches are the limit equilibrium methods (LEM), in which an assumed slip surface is solved for factor of safety using the method of slices, or the finite element strength reduction methods (FE SRM) which are popular for they do not require any assumption about inter slice forces, location or shape of the failure surfaces. The FE SRM method is an iterative procedure and in each step the original shear strength parameters are divided into a trial factor of safety. These reduced strengths are used in the finite element analysis, then shear stresses in each element are compared to a failure criteria like Mohr-Columb criteria. FE SRM is terminated when the stresses become unacceptably large or trial and error procedure do not converge to a solution [4].
Banaki et al. [2] states that the cases that calculated factor of safety without modeling uncertainties is bigger than reality, safety is not guaranteed and this inattention may cause loss of life of the residents in the area near slopes or those who pass through the roads across the slopes Moreover, repairing damaged earth structures are quite costly,
Fig. 1 Typical section of the main embankment
Fig. 2 Selection of slip surfaces for analysis
so probabilistic analyses found their popularity in slope stability and entered in engineering standards [2]. In the probabilistic approach the shear strength parameters, mainly cohesion and friction angle, are taken as random variables. The probability of failure is calculated either by the simulation based approach (e.g., Monte Carlo simulation; subset simulation) or analytical based approaches (e.g., first-order second-moment; first-order reliability method). Both these approaches require a deterministic analysis to get the factor of safety. The probabilistic analysis provides the designer tools to see the uncertainties in the analysis that can be incorporated to make a more economical design. In this study probability of failure is carried out using Monte Carlo simulations and the deterministic part is carried out using LEM.
2. Selection of Slip Surface
Guidelines for selection of slip surface are explained in general in USACE [11]. The shape of the slip surface of the fill embankment is analyzed
using circular failure surfaces. Failure along the shallow surface (slip surface C) in the embankment would consist simply of raveling of material down the slope and would only pose a maintenance problem. Failure along the deeper surface (slip surface A and B) might require reconstruction of the embankment. If the slip surface in the LEM is limited to circular shape, many failure modes that pass through a weak seem cannot be captured and probability of failure is under-estimated [7]. For this reason three slip surfaces were analyzed and are shown in figure 2 above;
3. Slope Stability Analysis
The stability analysis was performed as per guidelines of United States Army Corps of Engineers (USACE). The analysis was carried out in SLOPE/w [6] using the Spencer E. 1967 [10] method of slices as it satisfies both moment and force equilibrium (Fredlund and Krahn, 1977 [3]) and its results are verified in SLIDE [9] and/or hand calculations (HC).
3.1 Loading Conditions
The stability of the upstream and downstream slopes of the dam embankment is analyzed for the most critical or severe loading conditions that may occur during the life of the dam. These loading conditions typically include:
a) End of Construction
When significant pore pressure development is expected either in the embankment or foundation during construction of the embankment. The materials which are fine grained and with low permeability are considered to remain undrained at this stage.
b) Steady-State Seepage
When the long-term phreatic surface within the embankment has been established. All materials are considered drained and effective strength parameters are used.
c) Rapid (or Sudden) Drawdown
When the reservoir is drawn down faster than the pore pressures can dissipate within the embankment after the establishment of steady-state seepage conditions. In this case the fine materials with low permeability are assigned a composite envelop of drained and undrained strengths as per USACE guidelines.
d) Earthquake
When the embankment is subjected to seismic loading. This analysis is mostly carried out on the steady state seepage condition.
For the evaluation of embankment dam stability, the applicable loading conditions need to be determined.
The loading conditions are from the Engineering Manual EM 1110-2-1902 [11]. Other codes and standards may have their own loading conditions that may differ slightly from these ones. For details of the loading conditions, please refer to the Engineering Manual EM 1110-2-1902 [11].
3.2 Material Properties
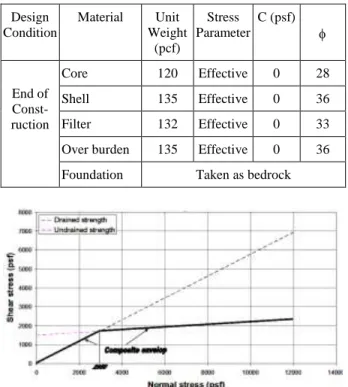
The material properties were selected as per guidelines of USACE and for each loading condition as shown in table 1 and 2 and figure 3.
Table 1 Material parameters for End-of-Construction stability analysis
Loading Condition
Material Unit
Weight (pcf)
Stress Parameter
C
(psf)
End of Const-ruction
Core 120 Total 1500 4
Shell 135 Effective 0 36
Filter 132 Effective 0 33
Over burden 135 Effective 0 36
Foundation Taken as bedrock
Table 2 Material parameters for Steady State Seepage stability analysis
Design Condition
Material Unit
Weight (pcf)
Stress Parameter
C (psf)
End of Const-ruction
Core 120 Effective 0 28
Shell 135 Effective 0 36
Filter 132 Effective 0 33
Over burden 135 Effective 0 36
Foundation Taken as bedrock
Fig.3 Composite shear strength envelope for rapid drawdown
The shear strength of the core material for rapid drawdown is a composite envelop (drained and undrained strengths) as per Corps of Engineers 1970 [11] method. The drained friction angle of 28° alongwith undrained cohesion of 1500 kPa and friction angle of 4° was used to develop a composite envelop as shown in figure 3. The strength will change from effective to undrained when the effective stress is greater than 2950 psf.
The material properties for earthquake loading (pseudostatic case) are the same as the steady state
seepage case. A horizontal acceleration factor of 0.2g was selected for the pseudostatic analysis. This value is based on Consultant’s study for the projects and so is used as it is. The pseudostatic earthquake analysis is carried out under the steady state seepage condition with surcharge pool level.
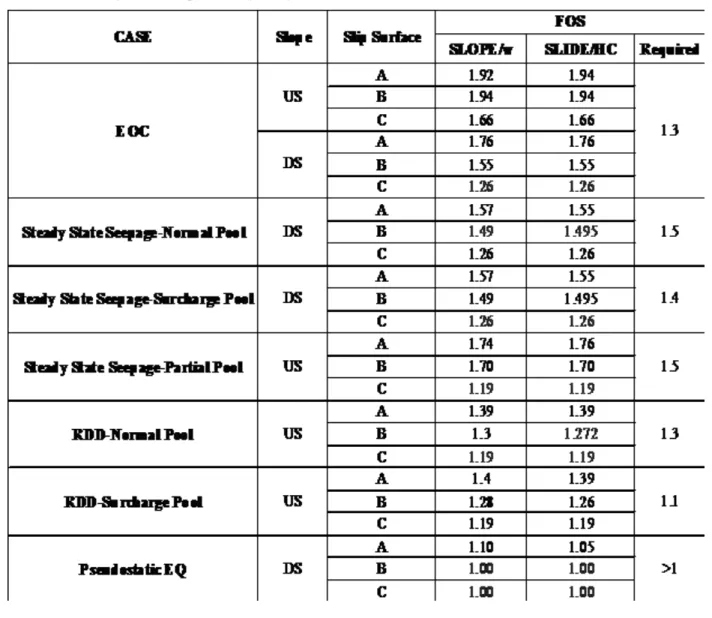
3.3 Stability Analysis Results
From the table 3 below, it is evident that the pseudostatic case is the most critical and so a probability and sensitivity analysis is carried out to investigate this case and other cases for which factor of safety is not meeting the minimum requirements set by USACE.
4. Probability and Sensitivity Analysis
A study at the University of Alberta, Alberta, Canada [5], reveals an ever increasing interest in a probability analysis.In the deterministic slope stability analyses, if the factor of safety is more than one, the slope is considered to be stable. If the factor of safety is less than one, the slope is considered to be unstable. In deterministic analyses the variability of the input parameters is not considered.
Probabilistic slope stability analysis allows for the variability in the input parameters. This can be solved in SLOPE/W, using the Monte Carlo method. Many of the input parameters can be assigned
a probability distribution, a probability distribution of the resulting safety factors is calculated. As the probability distribution of the safety factors becomes known, it is now possible to calculate the probability of failure.
With a uniform probability distribution (see Figure 4), a sensitivity analysis can also be carried out. For the different probability distribution functions, the reader is suggested to read the manual of SLOPE/W, whereas in this analysis only the normal probability distribution is selected.
4.1 Monte Carlo Method
The Monte Carlo method is simple and versatile, that is suitable for high speed computers. This method involves the following steps:
Modelling of the input parameters is done probabilistically and the representation of their variability is done in terms of a selected distribution model (Normal probability distribution in this case).
Conversion of the distribution function into a sampling function, then comes the random sampling of new input parameters and the determination of new factors of safety over and over again. For a normal probability distribution function, the sampling function has a relatively straight segment in the middle. This means that the parameters around the mean will be sampled more frequently than the values at the ends of the sampling function.
The probability of failure based on the number of factors of safety less than 1.0 with respect to the total number of slip surfaces with factors of safety greater than 1.0. For example, in an analysis with 2000 Monte Carlo trials, 1860 trials produce a factor of safety greater than 1 and 372 trials produce a factor of safety of less than 1.0. The probability of failure is 20.0 %. Probabilistic analysis is performed on the slip surfaces, taking into consideration the variability of the input parameters. The number of Monte Carlo trials in an analysis depends on the variability of input parameters and the expected probability of failure. The number of required Monte Carlo trials in general, is proportional to the material parameter variability.
Parameter Variability:
Laboratory results on natural soils have shown that most soil properties can be considered as variables as to the normal distribution function.
The variability of the following input parameters is considered:
Material parameters for unit weight, cohesion and frictional angles,
Random Number Generation:
In SLOPE/W, this is done using a random number generation function that is the fundamental input into a deterministic model.
Number of Monte Carlo trials:
The details on how to calculate the number of trial runs are given in SLOPE/W engineering manual. For practical purposes, the number of Monte Carlo trials to be conducted is usually in the order of thousands. Malkawi et al. [1] recommends the Monte Carlo method. 2000 Monte Carlo trials are selected for each parametric group to give reliable reproducible estimates of the probability of failure, which was simply defined as the proportion of 1,000 Monte Carlo slope stability analyses that failed [4].
4.2 Probability of Failure
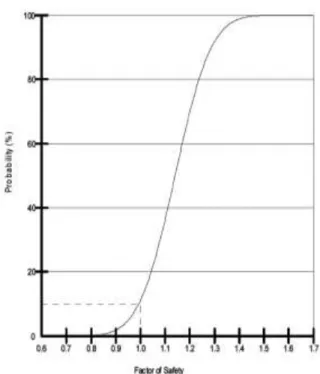
As illustrated in figure 4 below, the probability of failure is the probability of obtaining a factor of safety less than 1.0.
The probability of failure can be understood in two ways:
If a slope was to be constructed many times, what percentage of such slopes would fail, or
The level of confidence that can be placed in a design.
The first interpretation may be relevant to slopes where the same slope is constructed many times, while the second interpretation is more relevant to this project where slopes are only to be constructed once and it either fails or it does not. There is no direct relationship between the deterministic factor of safety and probability of failure. A slope with a higher factor of safety may not be more stable than a slope with a lower factor of safety.
Fig. 4 Factor of safety, probability of failure For guidance Washington State Department of Transportation (WSDOT) guidelines (table 4) have been used and a probability of failure of 0.001 (0.1%) is selected for slips surface A and B while 0.01 (1%) is selected for slip surface C.
4.3 Sensitivity Analysis
In sensitivity analysis the parameters are selected in an orderly manner, and the Uniform Probability Distribution function is used. The point where the two sensitivity curves cross is the factor of safety at the mid-point of the ranges for each of the strength parameters.
4.4 Material Parameters for Probability AND Sensitivity Analysis
The material properties have been taken from the Consultant’s study. No tests for shear strength were carried out for the shell, filter and overburden materials and hence their properties were selected from the Consultant’s recommended values. The material parameter variation for the unit weights of core, shell and filter material is shown in Figures 5.
The average unit weight for the core, shell and filter material is 115, 154 and 163 pcf. The maximum and minimum unit weights measured were 138 pcf
Table 4 Adapted from WSDOT Table 7-1 (After Santamarina et al. 1992 [8])
Conditions Probability of Failure Pf Unacceptable in most cases > 0.1 Temporary structures with no
potential life loss and low repair cost
0.1 Slope of riverbank at docks no
alternative docks, pier shutdown threatens operations
0.01 to 0.02
Low consequences of failure, repairs when time permits, repair cost less than cost to go to a lower Pf
0.01
Existing large cut on Interstate Highway
0.01 to 0.02 New large cut (i.e., to be constructed
on Interstate Highway)
0.01 or less Acceptable in most cases except that
lives may be lost
0.001 Acceptable for all slopes 0.0001
Unnecessarily low. 0.00001
80 90 100 110 120 130 140 150 160 170 180
0 1 2 3 4 5 6 7 8 9
U
n
it
W
e
igh
t
(p
c
f)
Test no.
Filter
Core
Shell
Fig. 5 Variation in unit weights
and 95.5 respectively. The unit weight is not as sensitive to the stability analysis as will be shown later and hence a 5 pcf variation from average is selected for all the materials. The unit weight of materials is controlled in constructing dams and hence there will not be a great deal of difference for this parameter from its average value.
The variation in cohesion value for the consolidation drained test on core material is shown in figure 6. The average cohesion from the tests is 225 kPa and so the variation selected for the cohesion of clay material is 200 kPa to be on the safer side. The variation in friction angle for core material is
shown in the figure 7. The average value for drained friction angle for the core material is 33º, the maximum being 36º and minimum being 30º. The variation selected for the friction angle for the core, shell, filter and overburden is 2º.
80 130 180 230 280 330 380
0 1 2 3 4 5 6
D
r
ai
n
e
d
c
oh
e
si
on
(p
sf)
Test no.
Core
Fig. 6 Variation in cohesion
29 30 31 32 33 34 35 36 37
0 1 2 3 4 5 6
Eff
e
c
ti
ve
fr
ic
ti
on
(
ф
')
Test no.
Core
Fig. 7 Variation in friction angle
a) End of construction
For the probability and sensitivity analysis the downstream slope is selected for analysis, as the upstream slope has a higher factor of safety. The material parameter variability in tabulated form for the end-of-construction case is given in table 5.
b) Steady state seepage-Surcharge pool
For the probability and sensitivity analysis of this case, the slip surface B is selected for analysis, as it has a lower factor of safety. The material parameter variability in tabulated form for this case is given in table 5.
c) Upstream partial pool
For the probability and sensitivity analysis of this case, the slip surface B is selected for analysis, as it has a lower factor of safety. The material parameter variability for the analysis is the same as used in the steady state seepage analysis.
d) Upstream rapid draw down-Surcharge pool level condition
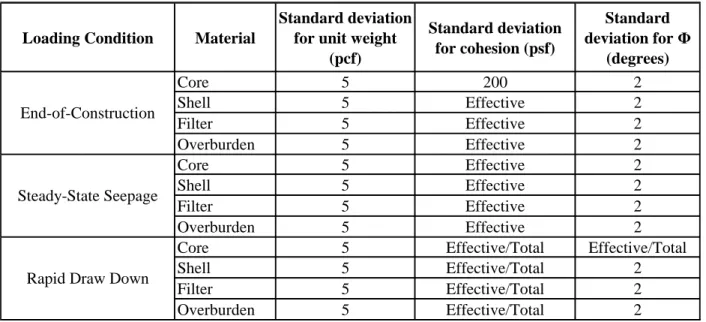
For the probability and sensitivity analysis the slip surface B is selected for analysis, as it has a lower factor of safety. The material parameter variability for this case is the same as used in the steady state seepage analysis and is given in table 5. Table 5 Selected material parameter variability different cases
Loading Condition Material
Standard deviation for unit weight
(pcf)
Standard deviation for cohesion (psf)
Standard deviation for Φ
(degrees)
Core 5 200 2
Shell 5 Effective 2
Filter 5 Effective 2
Overburden 5 Effective 2
Core 5 Effective 2
Shell 5 Effective 2
Filter 5 Effective 2
Overburden 5 Effective 2
Core 5 Effective/Total Effective/Total
Shell 5 Effective/Total 2
Filter 5 Effective/Total 2
Overburden 5 Effective/Total 2
End-of-Construction
Steady-State Seepage
e) Pseudostatic earthquake condition
The material parameter variability for the analysis is the same as used in the steady state seepage analysis.
4.5 Probability and Sensitivity Analysis
After performing 2000 Monte Carlo trials in SLOPE/w, the probability distribution and sensitivity analysis output for the pseudostatic case is as shown in the figures 8 and 9.
From figure 8 it is evident that for a factor of safety of 1 there is a 10 percent probability of failure for all the material parameter variability tried in the analysis.
Probability Distribution Function
P (F of S < x)
P (Failure)
P
ro
b
ab
il
it
y
(
%
)
Factor of Safety 0
20 40 60 80 100
0.85 0.90 0.95 1.00 1.05 1.10 1.15 1.20 1.25 1.30
Fig. 8 FOS vs Probability of failure for downstream slip surface A in SLOPE/W.
This probability of failure is of serious concern to the designer and calls for some improvement in slopes in order to reduce to the probability of failure. From figure 9 it is evident that the frictional angle of overburden is significantly affecting the factor of safety for the slip surface A, as some part of the slip surface is passing through this material.
Material #1: Wt Material #1: Phi Material #2: Wt Material #2: Phi Material #4: Wt Material #4: Phi Material #5: Wt Material #5: Phi Material #6: Wt Material #6: Phi Material #7: Wt Material #7: Phi
F
ac
to
r
o
f
S
af
et
y
Sensit ivity Range 0.8
0.9 1.0 1.1 1.2 1.3 1.4
0.0 0.1 0.2 0.3 0.4 0.5 0.6 0.7 0.8 0.9 1.0
Fig. 9 Sensitivity plot for the downstream slip surface A from SLOPE/W
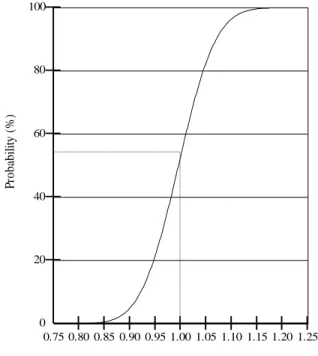
From figure 10 it is evident that for a factor of safety of 1 there is a 55 percent probability of failure for all the material parameter variability tried in the analysis.
Probability Distribution Function
P (F of S < x)
P (Failure)
P
ro
b
ab
il
it
y
(
%
)
Factor of Safety 0
20 40 60 80 100
0.75 0.80 0.85 0.90 0.95 1.00 1.05 1.10 1.15 1.20 1.25
Fig. 10 FOS vs Probability of failure for downstream slip surface B in SLOPE/W.
From figure 11 it is evident that the frictional angle of shell, is significantly affecting the factor of safety for the slip surface B, as most part of the slip surface is passing through this material. Also the gravel drain material is affecting the factor of safety to some extent.
Sensitivity Data
Material #1: Wt Material #1: Phi Material #2: Wt Material #2: Phi Material #4: Wt Material #4: Phi Material #5: Wt Material #5: Phi Material #6: Wt Material #6: Phi Material #7: Wt Material #7: Phi
F
ac
to
r
o
f
S
af
et
y
Sensit ivity Range 0.7
0.9 1.1 1.3 1.5
0.0 0.1 0.2 0.3 0.4 0.5 0.6 0.7 0.8 0.9 1.0
Fig. 11 Sensitivity plot for the downstream slip surface B from SLOPE/W
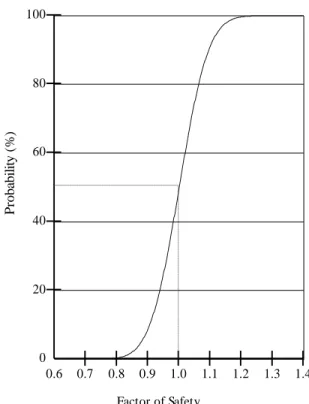
From the figure 12 it is evident that for a factor of safety of 1 there is a 52 percent probability of failure for all the material parameter variability tried in the analysis. From the figure 13 it is evident that the frictional angle of shell, is significantly affecting the factor of safety for the slip surface C, as most part of the slip surface is passing through this material.
Similar analysis was carried out for other critical conditions not meeting the minimum requirements of USACE in the slope stability analysis.
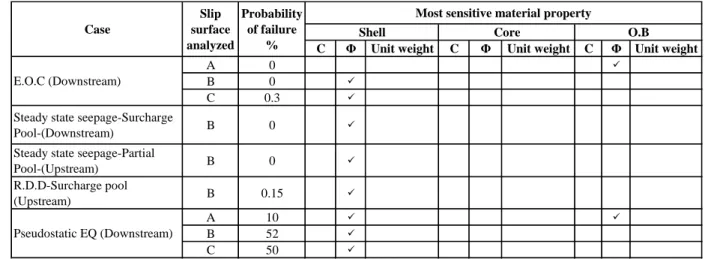
Summary of the probability and sensitivity analysis of all the cases analyzed is shown in table 6.
From the table it can be seen that the frictional angle of shell, is significantly affecting the factors o safety in almost all the conditions considered and so is regarded as the most sensitive material parameter for this dam. The reason for a large difference between the probability of failure of slip surface A as
Probability Distribution Function
P (F of S < x)
P (Failure)
P
ro
b
ab
il
it
y
(
%
)
Factor of Safety 0
20 40 60 80 100
0.6 0.7 0.8 0.9 1.0 1.1 1.2 1.3 1.4
Fig.12 FOS vs Probability of failure for downstream slip surface C in SLOPE/W
Sensitivity Data
Material #1: Wt
Material #1: Phi
Material #2: Wt
Material #2: Phi
Material #4: Wt
Material #4: Phi
F
ac
to
r
o
f
S
af
et
y
Sensitivity Range 0.6
0.8 1.0 1.2 1.4 1.6
0.0 0.1 0.2 0.3 0.4 0.5 0.6 0.7 0.8 0.9 1.0
Fig.13 Sensitivity plot for the downstream slip surface C from SLOPE/W
Based on these results, revised section is analyzed with flatter downstream slopes of 2H:1V
Friction angle of shell.
and 2.25H:1V. The upstream slope of 2.5H:1V is already stable and so is not revised.
Summary of the probability and sensitivity analysis of the revised sections analyzed is shown in table 7.
5. Conclusions
From the slope stability analysis, it was concluded that the pseudostatic case is critical for this dam and so a probability and sensitivity analysis was carried out for the critical case as well as for cases in which the factor of safety was near the minimum requirements of USACE. Given the material parameter variability, the probability analysis showed
that slip surface B and C had a probability of failure of more than 50% which is much greater than an acceptable 0.1 % and so the dam slopes for downstream need to be revised.
The sensitivity analysis showed that the friction angle of the shell material is most sensitive to the stability of this dam and so it can be controlled or improved, then the slopes may not be require flattening. From table 9 it can be seen that by flattening the downstream slope from 1.75H:1V to 2H:1V there is a marked reduction in the probability of failure. For the pseudostatic earthquake case for slip surface A, the probability of failure has reduced from 10% to 1.6%, for slip surface B the probability Table 6 Summary of the probability and sensitivity analysis
C Φ Unit weight C Φ Unit weight C Φ Unit weight
A 0
B 0
C 0.3
Steady state seepage-Surcharge
Pool-(Downstream) B 0
Steady state seepage-Partial
Pool-(Upstream) B 0
R.D.D-Surcharge pool
(Upstream) B 0.15
A 10
B 52
C 50
E.O.C (Downstream)
Pseudostatic EQ (Downstream)
Most sensitive material property Core
Shell O.B
Case
Slip surface analyzed
Probability of failure
%
Table 7 Summary of the probability and sensitivity analysis of revised downstream slopes
A 0 0 0
B 0 0 0
C 0.3 0 0
Steady state seepage-Surcharge
Pool-(Downstream) B 0 0 0
Steady state seepage-Partial
Pool-(Upstream) B 0 0 0
R.D.D-Surcharge pool (Upstream) B 0.15 0.15 0.15
A 10 1.6 0.1
B 52 2 0.1
C 50 2.5 0.4
E.O.C (Downstream)
Pseudostatic EQ (Downstream)
Probability of failure %
Case
U/S Slope 2.25H:1V D/S Slope 2H:1V
U/S Slope 2.25H:1V D/S Slope 2.25H:1V
Probability of failure %
U/S Slope 2.25H:1V D/S Slope 1.75H:1V
Probability of failure %
Slip surface analyzed
of failure has reduced from 52% to 2% and for slip surface C it has reduced from 50% to 2.5%. Similarly when the downstream slopes are flattened further to 2.25H:1V, the probability of failure is reduced to come within the selected acceptable limits of 0.1% for slip surfaces A and B and within 1% for slip surface C. Hence the recommended upstream and downstream slope for this dam is 2.25H:1V.
6. Acknowledgements
The authors are deeply thankful to the Consultants for sharing and providing the required data for analysis purposes. This would also not have been possible without the technical guidance from engineers of PES and professors at UET. We would also like to appreciate our Chief Editor at UET for getting this paper reviewed by foreign professors which was very helpful in correcting and updating this paper.
7. References
[1] A.H. Malkawi, W.F Hassan and F.A. Abdulla, (2000), Uncertainty and reliability analysis applied to slope stability, Structural Safety, No.22, pp: 61-187.
[2] Banaki R., Ahmad F., Tabarroki M., Yahaya A. S. 2013. Probabilistic Analyses of Slopes: A State of the Art Review. International Journal
of Current Engineering and Technology. Vol. 3
(1). pp 58-63.
[3] D. G. Fredlund and J. Krahn 1977. Comparison of slope stability methods of analysis.
Canadian Geotechnical journal. Vol. 14. pp.
429-439.
[4] D.V. Griffiths, and G.A. Fenton, (2004), Probabilistic slope stability analysis by finite elements Journal of Geotechnical and Geo
environmental Engineering, No.130, pp:
507-518.
[5] El-Ramly, H., Morgenstern, N.R., Cruden, D.M. 2002. Probabilistic Slope Stability Analysis for Practise. Canadian Geotechnical
Journal. Vol. 39. pp. 665-683.
[6] GEO-SLOPE. Slope/W for slope stability analysis. Version 5. Calgary, Alberta: GEO-SLOPE International Limited; 2002.
[7] J. Ching, K.K. Phoon, and Y.G. Hu (2010), Observations on Limit Equilibrium–Based Slope Reliability Problems with Inclined Weak Seams, Journal of Engineering Mechanics,
No.10, 136, pp:1220-1233.
[8] Santamarina, L.C., Altschaeffl, A.G. and Chameau, J.L.,1992. “Reliability of Slopes: Incorporating Qualitative Information.” Transportation Research Board, TRR 1343. [9] SLIDE for slope stability analysis. Toronto,
Ontario: Rocscience Inc.
[10] Spencer, E. 1967. A method of analysis of the stability of embankments assuming parallel inter-slice forces. Geotechnique, 17, pp. 11-26.
[11] USACE, United States Army Corps of Engineers, (2003). Slope Stability, Engineering Manual 1110-2-1902, Department of the Army,