KHARKIV NATIONAL UNIVERSITY OF RADIO ELECTRONICS
GII Laboratory Work
Call Centre Calculation
Purpose: Laboratory work is devoted to the investigation of the Call Centre parameters and its calculation.
Introduction to the Call Centre Calculator
The Call Centre Calculator is a JavaScript program which has been provided on the Internet. With the calculator, you can work out how many call answering agents you need in your call centre and how many lines you need into your call centre. These
calculations can be performed in hourly increments for an eight hour working day. To work this out, you need to know how many incoming calls you handle each hour. In addition, you need to know the average call duration and the average call
wrap up time (this is the period after a call during which an agent is unavailable to accept a further call, usually because administrative tasks relating to the previous call
are being completed).
You also need to decide upon your service targets. There are two service targets
required:
1. The percentage of calls which need to be answered within a specified time of
being presented to the system (e.g. 80% of calls to be answered within 20 seconds).
2. The acceptable blocking which may be experienced on the trunks into the call centre (e.g. 1% of calls may be blocked).
If you provide too many agents, you are obviously wasting your valuable
resources. However, if you provide too few agents, you run the risk of imposing unacceptably long ring times on your callers, or even worse, suffering from abandoned
calls.
aware that these model makes some assumptions about the nature of telephone traffic and may prove inaccurate under special circumstances such as high incoming call volumes generated by television and radio advertising.
The Erlang C traffic model
The Erlang C Traffic model was established by A.K. Erlang, a Danish scientist who was responsible for much of the early work in telephone traffic theory. It is an
analytical formula for modeling telecommunications systems which involve queuing. As such, it can be applied to the design and analysis of inbound call centers which
queue calls before presenting them to agents.
The model makes the following assumptions:
1. Calls are presented randomly to the servers (Poisson arrivals).
2. Callers finding the system busy will wait (that is, they will be queued).
3. Service times are exponential.
4. Callers are answered in the order in which they arrived. 5. Callers are directed towards the first available agent.
6. There is an unlimited queue size.
The assumption that there is an unlimited queue size is obviously not usually the
case. However, in practice, this is not usually an obstacle. If reasonable service targets are used, then call abandonments will be minimal, and the errors they introduce
should be minimal. The assumption that call arrivals are random can sometimes underestimate the number of agents required if some calls actually arrive in a short
peak, for example, in response to a television advertisement.
The Erlang B traffic model
analytical model for calculating call blocking and is the basis for the traffic calculator which you are using.
The model makes the following assumptions:
1. Calls are presented randomly to the trunk group (Poisson arrivals). 2. Call times are fixed or are exponentially distributed.
3. Blocked calls are cleared.
The assumption that blocked calls are cleared is only valid if calls are overflowed
to another trunk group (for instance, calls to a private network link are overflowed to the public PSTN telephone network if all trunks on the private network are in use). In
practice, this is often not the case. However, if blocking is low the error introduced by this assumption is small.
Performing a calculation
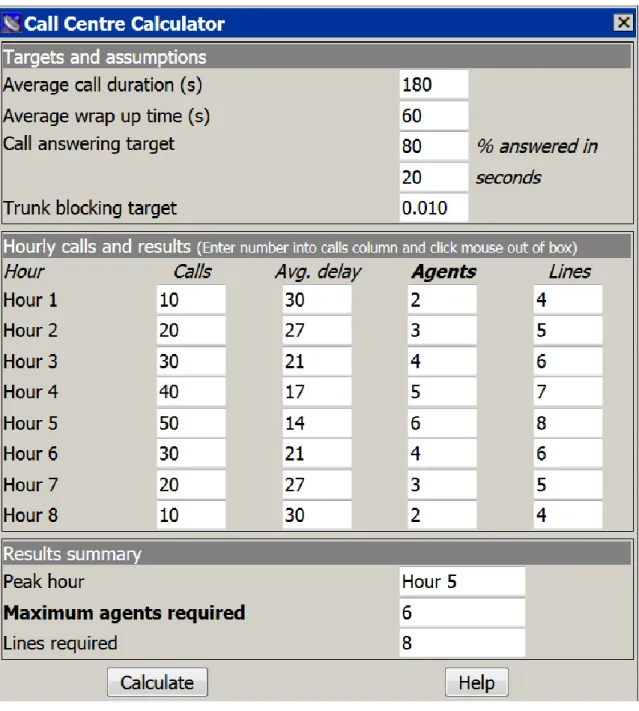
The calculator is split into three area (Fig. 1):
The first area is for you to enter general details about your call durations and your service targets.
The second area allows you to enter hourly call volumes for an eight hour period. It also displays the hourly results.
The final area summarizes the results for the eight hour period.
Targets and assumptions:
Before you start entering hourly figures, you need to specify some general call
details and your service targets into the top area “Targets and assumptions”:
Average Call Duration – enter the average call length in seconds into this box.
Average Wrap Up Time – This is the time, in seconds, during which an agent is not available to answer a call after completing the last call. It is usually used to
Call answering target – Use these two boxes to specify service targets to which the call centre works. For example, if you require that 75% of calls are answered
within 15 seconds, enter 75 into the first box and 15 into the second box.
Trunk blocking target – This is the grade of service target which is used when sizing the lines into the call centre. It is expressed as a fraction of the total calls which will be lost because insufficient lines have been provided. For example,
0.010 means that 1% of all calls would be blocked.
Hourly calls and results:
When the target figures have been entered, you can enter the hourly figures into the boxes in the second section. Each line in this section represents an hour. In the
first column of each row, you should enter the number of calls received at the call centre in that hour. As soon as you leave the box, the remaining three boxes are
calculated for you. The results displayed are:
Age delay – the average delay which will be experienced by all calls, including those calls which are not queued.
Agents – the number of agents required during that hour in order to meet the call answering target which you specified.
Lines – the number of lines required to carry that traffic into the call centre in order to meet the trunk blocking target which you specified.
Once you have entered the hourly figures, you can change the Targets and
assumptions figures which you entered into the top area of the calculator. The hourly calls figures will remain, but the results will be removed. To recalculate the hourly
results, press the Calc button.
Results summary:
The bottom section of the calculator summarizes the daily call centre estimates.
There are three boxes:
Peak hour – this shows the name of the busiest hour in terms of call arrivals
Maximum agents required – this box shows the number of agents required during that busiest hour
Lines required – the final box shows the number of lines required into the call centre to carry the peak traffic. It should be borne in mind that although the
How the calculator works
The calculator uses a two step process to make its estimates for each hour. Firstly, the number of agents required is estimated using Erlang C. This calculation also
results in an average delay figure. This delay and the average call duration are then applied to Erlang B to calculate the number of trunks required.
Erlang C calculation
The Erlang C calculation uses the sum of average call duration and average wrap
up time to work out the average hold time for a call. The sum of these two figures provides the average time during which an agent is occupied with a call. Although the
call is not in progress during the wrap up time, the agent is still unavailable to accept further calls during this period as administrative tasks relating to the previous call are
being completed.
Erlang B calculation
Although the wrap up time is used in the Erlang C calculation, is not applied when sizing the trunk group required. This is because, during the wrap up time, the call is not in progress and is therefore no longer occupying a trunk. However, the time
during which a call is queued does account for trunk occupancy. Therefore, when working out the traffic figure to apply to Erlang B for the hour in question, the average
call duration is added to the average delay (which resulted from the Erlang C calculation). The result is the number of lines required during that hour.
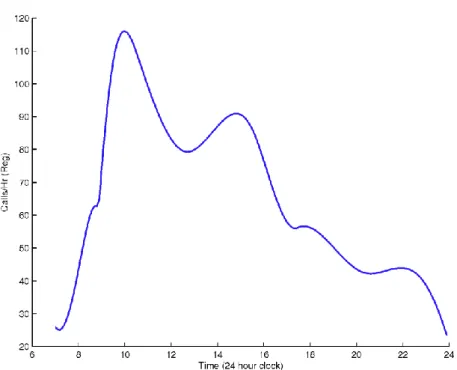
Task List:
1. Investigate different patterns of Calls per Hour and make calculations using Call
Centre Calculator.
Example:
Figure 2 – Statistical pattern of Number of Calls per Hour
Useful links:
http://www.erlang.com/