Speaker Recognition System using Wavelet Transform under
Stress Condition
Kshirabdhi Tanaya Biswal, Janmejaya Rout Dept. of Electronics and Telecommunication Engineering Indira Gandhi Institute of Technology, Sarang, Dhenkanal, Odisha
[email protected], [email protected]
Abstract— In this paper, we introduced a
text-depend speaker recognition by using wavelet transform under stressed conditions. Here we compare different feature such as ARC, LAR, LPCC, MFCC, CEP and after comparison we found that LPCC provides best feature. For decompose signal at two levels Discrete Wavelet Transform is used here. Discrete Wavelet Transform (DWT) based Linear Predictive Cepstral Coefficients (LPCC) used as a feature for recognized the speaker system. For classification Vector Quantization method is used. Four different stressed data has selected for (SUSAS) i.e. stress speech data base for speaker recognition. Improvement is achieved 93% and 94% in case of Lombard and Neutral case.
Keywords: Speaker Recognition, Feature
Extraction, Discrete Wavelet Transform, Linear
Predictive Cepstral Coefficient, Vector Quantization.
Introduction
The speech production under any condition that causes the speaker to vary the speech production from natural condition is called stressed speech. We consider 4 types of stress conditions from SUSAS database: Anger, Lombard, Neutral and Question [2] [3].Depending upon the application speaker recognition system are two type i.e. speaker identification and speaker verification. Speaker identification is determining who is speaking from a set of knows voices or speakers. In speaker identification system, an unknown speaker speech signal is analyzed and compared with known speaker’s speech models and in speaker verification system validity of speaker can be verified . Speaker identification method are classifiy as text-depend or text-in depended method. Text-dependent means that the training system and test system use the same data, where as text-independ means the text uesd in the test system has no limitation [1].
The speaker recognition system contains feature extraction and classification stage. Linear Predictive Cepstral Coefficients is used as a reference feature. Although Cepstral Coefficients provide a good set of feature vectors, but to extract dynamic information from speech signal it is diffciult . Therefore a another method is required to extracted specific features from speech signal. So wavelet transform has become use for analysis of speech signals.
Speaker Recognition System using Wavelet Transform under
Stress Condition
Kshirabdhi Tanaya Biswal, Janmejaya Rout Dept. of Electronics and Telecommunication Engineering Indira Gandhi Institute of Technology, Sarang, Dhenkanal, Odisha
[email protected], [email protected]
Abstract— In this paper, we introduced a
text-depend speaker recognition by using wavelet transform under stressed conditions. Here we compare different feature such as ARC, LAR, LPCC, MFCC, CEP and after comparison we found that LPCC provides best feature. For decompose signal at two levels Discrete Wavelet Transform is used here. Discrete Wavelet Transform (DWT) based Linear Predictive Cepstral Coefficients (LPCC) used as a feature for recognized the speaker system. For classification Vector Quantization method is used. Four different stressed data has selected for (SUSAS) i.e. stress speech data base for speaker recognition. Improvement is achieved 93% and 94% in case of Lombard and Neutral case.
Keywords: Speaker Recognition, Feature
Extraction, Discrete Wavelet Transform, Linear
Predictive Cepstral Coefficient, Vector Quantization.
Introduction
The speech production under any condition that causes the speaker to vary the speech production from natural condition is called stressed speech. We consider 4 types of stress conditions from SUSAS database: Anger, Lombard, Neutral and Question [2] [3].Depending upon the application speaker recognition system are two type i.e. speaker identification and speaker verification. Speaker identification is determining who is speaking from a set of knows voices or speakers. In speaker identification system, an unknown speaker speech signal is analyzed and compared with known speaker’s speech models and in speaker verification system validity of speaker can be verified . Speaker identification method are classifiy as text-depend or text-in depended method. Text-dependent means that the training system and test system use the same data, where as text-independ means the text uesd in the test system has no limitation [1].
Figure 1: Speech signal for the word ‘‘Break” of speaker emotions (a) Anger (b) Lombard (c) Neutral (d) Question.
Four stress speech signals are shown in Fig.1 To improve the speaker recognition under stressed condition wavelet transform is used through SUSAS database.
This paper is organized as follows. Methodology is describe in section 2. The details explain about the feature used is discussed in section 3 and 4. about Vector Quantization is describe in section 5. Details of database is explained in section 6 and in 7 results and discussed are given. The paper conclusion describe in section 8.
2. METHODOLOGY
The speaker identification system is categorized in to two modes, i.e. training and testing mode. In training mode, the speech signal is pre-processed first and after pre-processing wavelet transform is applied to extract the feature. Similarly for testing mode, speech signal is preprocess and extracted by using wavelet feature. After that by using vector quantization classifier speaker identification will decided [5].
.
Figure2: Speaker Identification System
3. DISCRETEWAVELETTRANSFORM
In the field of signal processing the wavelet method is new technique for feature extraction. Wavelet transforms is used by several researches for automatic speech recognition, speech coding and compression, speech de noising and enhancement and other processes. Wavelet transform replaces the fixed bandwidth of Fourier transform with one proportional to frequency which allows better time resolution at high frequency rather than Fourier Transform.
Wavelet means a small wave. The smallness means the condition that this (window) function is of finite length. And as this function is oscillatory so it is called wave. Wavelet transform is used because it is more suitable to deal with non-stationary signals like speech. The advantage using wavelet transform is that it provides at which time which frequency is present so that it gives time frequency information of the signal. For analysis of such non stationary signal Fourier transform is not suitable because it gives only the frequency information of the signal and does not gives time information means at what time which frequency is present. So wavelet have the capacity to analyzed different parts of the signal at different scale [6].
The continuous one dimensional wavelet transform (CWT) is the decomposition of ( )into a set of basis function , ( )calledWavelets:
w(a, b) = ∫ f(t)ψ Ѱ∗a, b(t) dt (3.1) Wavelet are generated from a signal called mother wavelet.
, ( )is a dilation and translation.
, ( ) = √ Ѱ (3.2)
Where is the signal which is to be analyzed a is defined as a scale factor and b is the translation factor.ψ (t) is the transforming function and it is all so called the mother wavelet.
Input Speech
Pre-Processing
DWT based Feature Extracti
on VQ Classifier
DWT based Feature Extracti
on Hhhh
Pre-Processing Input
Speech
Testing Phase hhh hhhhhhhhhhhbbb
Training Phase
Speaker id hhh hhhhhh hhhhhb
Figure3: DWT decomposition structure
DWT involve two set of function called scaling function and wavelet function which can be shown as low-pass and high-pass filter respectively. Here low frequency contain is more important than high frequency part. DWT decomposition structure is shown in fig 3.
The original signal s is pass through two respective filter know as low-pass and high-pass filter and produced two signal know as approximation A and details D coefficients. The approximation coefficients are high scale and low frequency whereas details coefficients are low scale and high frequency components. The DWT process repeated until a one coefficient is found. Here we used daubechies wavelet [2].
S
Figure4: Wavelet decomposition of signal S into details
4. LPCC
LPCC become a suitable technique for estimating the basic parameter of a speech signal. The basic concept of LPCC method is one speech sample at the current time can be predicted the linear combination of past speech sample. The LPCC algorithm is shown in figure 5.
I/P
Figure5: Step for LPCC
The energy contained within a speech signal is distrusted more in lower frequency as compare to higher frequency.
Pre-emphasis of the signal is done in order to enhance the energy contained within high frequency. The transfer function of this filter in z- domain is
( ) = 1 −
Where filter coefficient is constant which has atypical value of 0.97. The pre-emphasized of signal is divided in to frames. Windowing function of the signal is performed in order to reduce the signal discontinuities at the edge of each frame. The common windowing technique is used is known as hamming window because of its smoothness and low side lobe and is describe in below equation.
( ) = 0.54 − 0.4 cos 2 ; 0 ≤ ≤ (4.2)
Where the length of the window function is defined as N. In linear predictive analysis the shape of the vocal tract decided the characteristics of the sound being produced. To model the vocal tract digital all-pole filter is used and the transfer function is represent in z-domain.
( ) = − ∑
0 500 1000 1500 2000 2500 3000
-0.8 -0.6 -0.4 -0.2 0 0.2 0.4 0.6 0.8 1
0 500 1000 1500
-1.5 -1 -0.5 0 0.5 1 1.5
0 500 1000 1500
-0.4 -0.3 -0.2 -0.1 0 0.1 0.2 0.3
0 100 200 300 400 500 600 700 800 -1.5
-1 -0.5 0 0.5 1 1.5 2
0 100 200 300 400 500 600 700 800 -0.8
-0.6 -0.4 -0.2 0 0.2 0.4 0.6 0.8
S
Low pass High pass
A D
cA cD
cA1 cD1
Pre-emphasis
and Hamming Windowing
Linear Predictive
Analysis
Where ( ) is known as vocal tract transfer functions, the gain of the filter is defined as G. is the set of auto regression coefficients known as Linear Prediction Coefficients(LPC). One of the efficient methods is Auto Correlation method for estimating the LPC coefficients and filter gain. The cepstra analysis which refers to the process of finding out the spectrum of speech sequence is the last stage of algorithm. There are two type of cepstral approaches known as FFT and LPC spectrum. The real cepstrum is defined as the inverse FFT of the logarithm of speech magnitude defined by below equation.
∆[ ] = [ ( )]
Where ( )shows the Fourier spectrum of a signal and
∆[ ] is the cepstrum respectively.However another
method for estimating the coefficients from LPC via several filteris known as linear prediction Cepstral Coefficients (LPCC).
5. VECTOR QUANTIZATION
In Vector Quantization code book (VQ codebook) the speech signal is divided into some frames and the number of feature that is extracted is known as p number of feature from each frame. Thusa set of p features, = , ,… … . , is generated and represents one feature vector. From L number of frame a set of input vectors given as = [ , , … . . ] is generated. In this way, possible feature vectors are extracted. The codebook is design on the minimization of average distance between the training vector and codebook ( = , … … and the size of codebook is defined as P) [5].
Avg distortion measure = ∑ ( , )
Where ( , )denotes the distance between vector and . The code book for each speaker is designed by using the generalized Lloyd algorithm. These code books are reference code books for recognition of speakers. 97% correct speaker recognition for a database of 10 speakers with the cepstral coefficients are shows by Vector Quantization classifier.
For evaluation of relative recognition performance of deferent speech features Vector Quantization (VQ) is used. By using Vector Quantization based classifier
speaker identification and verification performance feature are evaluated. Sixty four size code words are ready for these comparisons. Using the Euclidean distance it can be measure, every vector is clustered around each code word. The input vector belongs to thecode word that yields the minimum distance between them. From the above steps, a new set of code words have been calculated by estimating the average of each frame.
Final set code is calculated by repeating the above two steps until repetition are exhausted.
In SUSAS speaker speakers data base 45 numbers of utterances are used for training and 15 stress speech utterance are used for testing. The testing phase include all code books and then find the minimum distance code book.
6. SPEAKER DATABASE
In this work the data base used is stress speech database which is known as speech under stimulated and actual stress (SUSAS). It consists of four stress class or emotion that is Anger, Lombard, Neutral, Question and thirty five words uttered by nine speakers. In this database each speaker has uttered each word twice making eighteen utterances. For each word under each stress that makeup to a total 2520 utterances. All speech signals are sampled at 8 kHz. Out of 2520 utterances from the database we have used 1620 for training and 900 for testing.
7. EXPERIMENTAL RESULTS
Different type of feature namely Male Frequency Cepstral Coefficients (MFCC), Linear Frequency Cepstral Coefficients (LFCC), Real Cepstral Coefficient (RCC), Log Area Ratio (LAR) are used for evaluation of speaker recognition under stress condition. The classifier is used here is a 64-size Vector Quantization (VQ) classifier for evaluation of speaker identification results. Table 7.1 show recognition results for speech signals records under four different emotions or stressed condition. The performance of speaker recognition system may degrade under stress condition because of due the change in speech signal characteristics.
the table show the results of the speaker recognition value for testing utterance under the emotion indicated by column and for code book used indicated by the row.
Table7.1: speaker identification rate using VQ classifier
Among all the feature comparison it is shown that the Linear Predictive Cepstral Coefficient (LPCC) is the best feature for speaker recognition. Table 7.2 show the recognition rate by using LPCC feature.
Table7.2: speaker identification using LPCC feature
Trainin g
Classification results of different feature Ange
r
Lombar d
Neutra l
Questio n
Avg
Anger 67.50 36.01 42.66 29.33 43.8
7 Lombar
d
31.25 88.29 49.85 43.05 53.1
1 Neutral 29.54 58.66 82.05 65.35 58.9
0 Questio
n
29.69 48.88 70.61 80.00 56.5
4 Highest recognition result are obtained for Lombard and Neutral trained data (codebook) with Lombard and Neutral test data respectively 88.29 % and 82.05% . Anger trained model gives least average performance of 43.87%. The optimal number of LPCC should be
extracted from each sub band. By taking various numbers of LPCCS (8 to 12) we have measure the recognition rate. Recognition result vs number of Linear Prediction Cepstral Coefficient per sub band graph is shown in fig (6).
Table 7.3: speaker identification rate (%) using 8 LPCC
Trainin g
Classification results of different feature Ange
r
Lombar d
Neutra l
Questio n
Avg
Anger 67.50 36.01 42.66 29.33 43.8
7 Lombar
d
31.25 88.29 49.85 43.05 53.1
1 Neutral 29.54 58.66 82.05 65.35 58.9
0 Questio
n
29.69 48.88 70.61 80.00 56.5
4
Table 7.4: speaker identification rate(%) using 9 LPCC
Table 7.5: speaker identification rate (%) using 10 LPCC
Table 7.6: speaker identification rate (%) using 11 LPCC
Emotion Classification results of different feature
Training Testing
Anger Lomba rd
Neutra l
Questi on
Avg
ARC 52.88 61.90 70.93 73.80 64.87
LAR 52.49 60.82 73.52 75.41 65.52
RC 50.99 61.91 68.54 70.31 62.93
LPCC 64.33 87.91 68.11 62.04 70.52
MFCC 54.88 63.69 74.64 78.03 67.14
CEP 24.01 36.41 43.35 46.03 37.41
Trainin g
Classification results of different feature Ange
r
Lombar d
Neutra l
Questio n
Avg
Anger 70.76 40.66 47.01 32.76 47.7
9 Lombar
d
35.88 89.33 70.22 51.23 61.6
6 Neutral 37.66 61.34 87.77 79.07 66.4
6 Questio
n
32.13 51.66 73.55 79.44 59.1
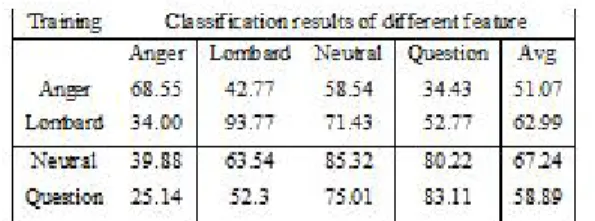
Table 7.7: speaker identification rate (%) using 12 LPCC
Number of LPCC per sub-band
Number of LPCC per sub-band
Number of LPCC per sub-band
Number of LPCC per sub-band
Figure 6: Recognition rate vs numbers of LPCC per sub-band (a) Anger (b) Lombard (c) Neutral
(d)Question.
Maximum recognition rate 93% and 94% obtain where 11 LPCCs and 12 LPCCs are extracted in case of Lombard and Neutral case. Similarly for Anger it is 68% and Question it is 83%.
8. CONCLUSION
In this work speaker recognition using wavelet is perform by VQ. Different type of features such as MFCC, LFCC, ARC, LAR, CEP, and LPCC are compare for speaker recognition under stress condition. For speaker recognition the technique wavelet transform is applied to different stressed condition. Feature recombination technique is used. Linear predictive cepstral coefficient of wavelet decomposition speech signals is extracted. It is clearly visible that recognition rate is improved as compared to the conventional system.
The Speaker recognition system performance is degraded due to uncertain condition like emotion and noise environment. We have analyzed the performance degradation due to different emotions for speaker recognition. The performance of same emotion speaker models and testing utterances give more recognition. Alternative emotion speaker models and testing utterances give less recognition.
9. REFERENCE
[1] J.P. Campbell, “Speaker Recognition: A Tutorial,” proc. IEEE., Vol. 85, no. 9, Sep 1997.
[2]Herman J.M.Steeneken and John.H.L.hasen ‘‘Speech under stress condition.”IEEE “Robust Speech process”1999.
0 20 40 60 80
8 9 10 11 12
anger
0 20 40 60 80 100
8 9 10 11 12
lombard
lombard
0 20 40 60 80
8 9 10 11 12
neutral
Table 7.7: speaker identification rate (%) using 12 LPCC
Number of LPCC per sub-band
Number of LPCC per sub-band
Number of LPCC per sub-band
Number of LPCC per sub-band
Figure 6: Recognition rate vs numbers of LPCC per sub-band (a) Anger (b) Lombard (c) Neutral
(d)Question.
Maximum recognition rate 93% and 94% obtain where 11 LPCCs and 12 LPCCs are extracted in case of Lombard and Neutral case. Similarly for Anger it is 68% and Question it is 83%.
8. CONCLUSION
In this work speaker recognition using wavelet is perform by VQ. Different type of features such as MFCC, LFCC, ARC, LAR, CEP, and LPCC are compare for speaker recognition under stress condition. For speaker recognition the technique wavelet transform is applied to different stressed condition. Feature recombination technique is used. Linear predictive cepstral coefficient of wavelet decomposition speech signals is extracted. It is clearly visible that recognition rate is improved as compared to the conventional system.
The Speaker recognition system performance is degraded due to uncertain condition like emotion and noise environment. We have analyzed the performance degradation due to different emotions for speaker recognition. The performance of same emotion speaker models and testing utterances give more recognition. Alternative emotion speaker models and testing utterances give less recognition.
9. REFERENCE
[1] J.P. Campbell, “Speaker Recognition: A Tutorial,” proc. IEEE., Vol. 85, no. 9, Sep 1997.
[2]Herman J.M.Steeneken and John.H.L.hasen ‘‘Speech under stress condition.”IEEE “Robust Speech process”1999.
anger
lombard
neutral
0 20 40 60 80
8 9 10 11 12
Question
Table 7.7: speaker identification rate (%) using 12 LPCC
Number of LPCC per sub-band
Number of LPCC per sub-band
Number of LPCC per sub-band
Number of LPCC per sub-band
Figure 6: Recognition rate vs numbers of LPCC per sub-band (a) Anger (b) Lombard (c) Neutral
(d)Question.
Maximum recognition rate 93% and 94% obtain where 11 LPCCs and 12 LPCCs are extracted in case of Lombard and Neutral case. Similarly for Anger it is 68% and Question it is 83%.
8. CONCLUSION
In this work speaker recognition using wavelet is perform by VQ. Different type of features such as MFCC, LFCC, ARC, LAR, CEP, and LPCC are compare for speaker recognition under stress condition. For speaker recognition the technique wavelet transform is applied to different stressed condition. Feature recombination technique is used. Linear predictive cepstral coefficient of wavelet decomposition speech signals is extracted. It is clearly visible that recognition rate is improved as compared to the conventional system.
The Speaker recognition system performance is degraded due to uncertain condition like emotion and noise environment. We have analyzed the performance degradation due to different emotions for speaker recognition. The performance of same emotion speaker models and testing utterances give more recognition. Alternative emotion speaker models and testing utterances give less recognition.
9. REFERENCE
[1] J.P. Campbell, “Speaker Recognition: A Tutorial,” proc. IEEE., Vol. 85, no. 9, Sep 1997.
[2]Herman J.M.Steeneken and John.H.L.hasen ‘‘Speech under stress condition.”IEEE “Robust Speech process”1999.
12
Question
[3] Sanjay. Patil“ Speech under stress: Analysis, Modeling And Recognition,” January 2007.
[4]W.Alkhadi, W.Fakhar and N.Handy ‘‘Automatic Speech/speaker recognition in noisy environments using WT,”senior member, IEEE2002.
[5]Shailaja S Yadav, D.G. Bhalke , ‘‘ Speaker Identification System using Wavelet Transform and VQ modeling Technique,’’International Journal Of Computer Applications Volume 112– No. 9, February 2015.
[6]Mahmoud I. Abdalla, Haitham M. Abobakr, Tamer S. Gaafar ‘‘DWT AndMfccs Based Feature ExtractionMethods For Isolated Word Recognition,’’Volume69–No.20, May 2013 21.
[7]TaabishGulzar, Anand Singh, Sandeep Sharma, “Comparative Analysis of LPCC, MFCC and BFCC For the Recognition using Artifical Neural Network,”International Journal of Computer Application Volume 101-No.12, September 2014. [8]J.H.L Hasen , Mark A .Clements ‘‘Stress compensation noise reduction algorithm for robust speech recognition” 1989IEEE.
[9]Levent M. Arslan and John H.L Hasen ‘‘Speech enhancement for cross talk interference” IEEE signal processing letter, VOL.4, no.4, APRIL 1997.
[10]Murray , I. R, Baber. c and south. A .j “towards defination and working model of stress and its effects on Speech.” Speech enhancement communication vol.20,nov. 1-2,1996.
[11]H.Hermansky, S. Tibrewala, and M. Pavel,“Towards ASR on Partially Corrupted Speech,” in Proceedings of ZCSLP, 1996.
[12]J.N.Gowdy, Z.Tufekci ‘‘Mel-scale Discrete Wavelet Coefficiant forSpeech recognition”2000.
[13]Evan Ruzanski1, John H.L. ‘‘ Stress Level Classification of Speech Using Euclidean Distance Metricsin a Novel Hybrid Multi-Dimensional Feature SpaceHansen”2006.
[14] Alm,C.O., Roth, D., Sproat, R.: Emotions from Text: ‘‘Machine Learning for Text based Emotion Prediction. In: Proceedings of HLT/EMNLP 05, Vancouver’’ (2005).
[15]A. Mantilla-Caeiros, M. Nakano-Miyatake, H. Perez-Meana, “A New Wavelet Function for Audio and Speech Processing”, 50th MWSCAS, pp. 101-104.(2007).
[16]HynekBoˇril, Member, IEEE, and John H. L. Hansen, Fellow, IEEE ‘‘Unsupervised Equalization of Lombard Effect for Speech Recognition in Noisy Adverse Environments” Transactions On Audio, Speech, And Language Processing, Vol. 18, No. 6, August 2010.