The handle
http://hdl.handle.net/1887/22833
holds various files of this Leiden University
dissertation.
Author
: Di, Zi
Title
: Development of automatic image analysis methods for throughput and
high-content screening
methods for high-throughput and
high-content screening
for high-throughput and high-content screening
Zi Di
Thesis, Leiden University, 2013
ISBN: 978-94-6191-979-3
© 2013, Zi Di. All rights reserved. No part of this thesis may be
reproduced or transmitted in any form, by any means, electronic or
mechanical, without prior written permission from the author.
Cover: Lennard Kager
methods for high-throughput and
high-content screening
Proefschrift
ter verkrijging van
de graad van Doctor aan de Universiteit Leiden,
op gezag van Rector Magnificus prof. mr. C.J.J.M. Stolker,
volgens besluit van het College voor Promoties
te verdedigen op dinsdag 10 December 2013
klokke 11.15 uur
door
Zi Di
Promotor:
Prof. Dr. B. van de Water LACDR, Leiden
Co-promotoren:
Dr. J. H. N. Meerman LACDR, Leiden Dr. Ir. F. J. Verbeek LIACS, Leiden
Overige leden:
Prof. Dr. P. H. van der Graaf LACDR, Leiden Prof. Dr. J. N. Kok LIACS, Leiden Prof. Dr. H. J. Tanke LUMC, Leiden Prof. Dr. Ir. A. J. Koster LUMC, Leiden
1 General introduction 1
1.1 Introduction of the thesis . . . 1
1.2 High-throughput and high-content screening . . . 1
1.2.1 “High-throughput” . . . 2
1.2.2 “High-content” . . . 2
1.3 Workflow of high-throughput and high-content screenings . . . 2
1.3.1 Sample preparation . . . 2
1.3.2 Image acquisition in a high-throughput manner . . . 4
1.3.2.1 Microscope models . . . 4
1.3.2.2 Magnification, resolution, sampling size and camera setting . . . 4
1.3.2.3 Balance between quality and quantity . . . 5
1.3.3 Image analysis . . . 5
1.3.3.1 Segmentation . . . 6
1.3.3.2 Quantification . . . 6
1.3.3.3 Tracking and analysis for image stacks . . . 7
1.3.4 Data analysis . . . 7
1.4 Scope and structure of this thesis . . . 8
2 Automated analysis of NF-κB nuclear translocation kinetics in high-throughput screening 13 2.1 Introduction . . . 15
2.2 Results . . . 16
2.2.1 Image collection and pre-processing . . . 16
2.2.2 Segmentation for individual nuclei: Watershed Masked Clus-tering (WMC) . . . 18
2.2.3 Cell tracking . . . 18
2.2.4 Segmentation for individual cells: Best-fit Ellipse of Voronoi Cell (BEVC) . . . 19
2.2.5 Quantification of NF-κB translocation dynamics . . . 19
2.2.6 Quantification of NF-κB translocation analogue parameters . . 21
2.2.7 Statistical validation of the NF-κB quantification method . . . 21
2.2.11 Application of the NF-κB quantification method in high-throughput
screening assays . . . 24
2.3 Discussion and conclusions . . . 27
2.4 Methods . . . 30
2.4.1 Cell line and cell culture . . . 30
2.4.2 Treatment of cells . . . 30
2.4.3 Fluorescence microscope . . . 30
2.4.4 Image analysis and statistical analysis . . . 31
3 Ultra high-content analysis and phenotype profiling of 3D cultured micro-tissues 43 3.1 Introduction . . . 45
3.2 Results . . . 46
3.2.1 4T1 breast cancer cells acquire a complex phenotype in 3D culture, which is perturbed by biologically active compounds . 46 3.2.2 Multi-parametric image analysis for phenotypic profiling . . . . 46
3.2.3 Identification of biologically active compounds . . . 48
3.2.4 Concentration dependent phenotypic trajectories of biologically active compounds . . . 48
3.2.5 Trajectory modeling and phenotypic pattern recognition . . . . 51
3.2.6 Contribution of the different parameter classes to the classifi-cation . . . 53
3.2.7 Computational efficiency . . . 55
3.2.8 Comparison to other analysis methods . . . 55
3.2.9 Reproducibility of the methodology . . . 56
3.2.10 Other applications of the methodology: classification of human breast cancer cell lines . . . 56
3.3 Discussion and conclusions . . . 58
3.4 Methods . . . 59
3.4.1 Cell culturing, fluorescence staining, and image acquisition . . . 59
3.4.2 Image analysis for multi-parametric phenotype profiling . . . . 59
3.4.3 Identification of the biologically active compounds . . . 65
3.4.4 Software . . . 67
4 Automated analysis pipeline for 3D surface reconstruction and phe-notype profiling of 3D cultured micro-tissues suitable for high-content and high-throughput screening 83 4.1 Introduction . . . 85
4.2 Results . . . 86
4.2.1 Method development for 3D surface reconstruction . . . 86
4.2.1.1 Deconvolution . . . 86
in z-direction . . . 89
4.2.2 Phenotype measurement . . . 92
4.2.2.1 Phenotype measurement for individual nuclei . . . 92
4.2.2.2 Phenotype measurement for multi-cellular micro-tissue network . . . 94
4.2.3 Validation by comparison to the confocal laser scanning micro-scope results . . . 96
4.2.3.1 Comparison of the quantification results of nuclei ob-tained from the wide-field microscope images and con-focal microscope images. . . 98
4.2.3.2 Comparison of the quantification result of micro-tissue networks obtained from the wide-field microscope im-ages and confocal microscope imim-ages . . . 99
4.2.3.3 Comparison of the time efficiency between the wide-field microscope and confocal microscope . . . 101
4.2.3.4 Assessment of different sampling step sizes in z-direction103 4.3 Discussion and conclusions . . . 104
4.4 Methods . . . 105
4.4.1 Cell culturing . . . 105
4.4.2 Image acquisition . . . 105
4.4.3 Software . . . 105
5 Comparison of phenotype profiling of 3D cultured micro-tissues for ultra-high content screening by a 2D projection based method and a 3D method 113 5.1 Introduction . . . 115
5.2 Methods . . . 116
5.2.1 High-content screening of 4T1 cells . . . 116
5.2.2 Automated phenotype profiling platform based on 2D projection117 5.2.3 Automated 3D phenotype profiling platform . . . 117
5.3 Results . . . 121
5.3.1 Hit identification . . . 121
5.3.2 Phenotype classification . . . 122
5.3.3 Reproducibility of concentration dependent phenotypic trajec-tories . . . 129
5.4 Discussion and conclusions . . . 130
6 Discussion and conclusions 143 6.1 Developing ultra-high content analysis platforms for high-throughput screening which do not require high resolution microscopes . . . 143
6.2 Balance between “high-content” and “high-throughput” . . . 144
6.3 Ultra-high content analysis . . . 147
6.3.1 Subpopulations . . . 147
6.3.2 Ultra-high level in information content . . . 148
6.4 Future perspective . . . 149
Nederlandse samenvatting 153
English summary 157
Curriculum vitae 161
General introduction
1.1
Introduction of the thesis
This thesis focuses on the development of image analysis methods for ultra-high con-tent analysis of high-throughput screens where cellular phenotype responses to various genetic or chemical perturbations that are under investigation. Our primary goal is to deliver efficient and robust image analysis platforms which can 1) automatically detect cellular structures of interest from florescence microscope images and 2) quan-tify dynamics and organization of multi-cellular systems with phenotypic features. To recover heterogeneity of cellular behavior, we aim to develop single-cell-based image analysis methods so that cell subpopulations can be distinguished and investigated. Furthermore, we intend to develop methods to extract an ultra-high level of phe-notypic details from images. This would enable system-level studies of phenotype characterization.
To promote a further understanding of this thesis, this introductory chapter firstly provides the general background and essential knowledge related to the high-throughput and high-content screening. Next, the state-of-the-art techniques and image analysis methods that have been already applied to throughput and high-content screenings are given. Finally, the scope and structure of this thesis is pre-sented at the end of this chapter.
1.2
High-throughput and high-content screening
methodologies, or by expression of green fluorescent protein (GFP)-tagged proteins. Finally, micro plates are imaged by an automated microscope system to monitor cellular response to the different perturbations.
1.2.1 “ High-throughput”
In recent years, florescence microscopy technology has been developed dramatically in respect to resolution, speed, complexity and scale. The emergence of automated microscope systems with robotic handling enables the investigation of a large volume of compounds or genetic players simultaneously. Combined with genome-wide RNAi approaches [1, 2], high-throughput small-molecule-based perturbations [3] or over-expression strategies [4], high-throughput and high-content screening has become a powerful technology to thoroughly study the regulation of biological pathways that underlie the function of intact cells.
1.2.2 “ High-content”
Although other high-throughput techniques, such as mass spectrometry or DNA-microarrays, have been developed and successfully applied to study diverse cellular pathway and their possible involvement in disease, these techniques, despite their great usefulness, cannot provide adequate temporal and spatial information , in the context of the structural and functional integrity of cells. Most importantly, they do not directly show whether the identified molecules have a functional role in the cellu-lar process that is under investigation. High-throughput and high-content screening technique fills this gap by probing the function of molecules in their nature environ-ment with exquisite and ever increasing spatial and temporal resolution [5–8]. More-over, integrated with other high-throughput techniques, interdisciplinary information is collected, which provides us a challenging opportunity to study whole biological systems more comprehensively.
1.3
Workflow of high-throughput and high-content
screen-ings
High-throughput and high-content screenings consist of four major stages: sample preparation, image acquisition, image analysis and data analysis. In this chapter, a general introduction for each of these stages is provided and the state-of-the-art techniques that are used in each stage are summarized.
1.3.1 Sample preparation
fixed assay. In this assay, cells are grown as a cell monolayer (therefore the term “2D” is used) and only a simple and specific read out is measured. Because this type of assay is relatively easy to be processed and imaged, it is often considered for higher-throughput experimentation and larger scale automation. Many projects have already achieved a great success using this type of assay [1, 3, 7, 9, 10]. One example is the work of Marino Zerial and his co-workers [1]: a genome-wide RNAi screen was performed in HeLa cells to explore the function of human kinases in two principal types of endocytosis: clathrin- and caveolae/raft-mediated endocytosis. They showed that a high number of kinases is involved in endocytosis, and that each endocytosis route is regulated by a specific kinase subset.
However, 2D fixed assays are not representative of the cellular environment found in organisms. In fact, tissue-specific architecture, mechanical and biochemical cues, and cell–cell communication are lost under such simplified and highly biased condi-tions. Efforts to address this problem led to the development of 3D cell cultures. They utilize an extracellular matrix (ECM) gel to re-establish physiological cell–cell and cell–ECM interactions, thus mimicking spatial organization of real tissues in their nature environment better than 2D cultures. Recently 3D cultures have shown many advantages in a broad range of cell biology studies [11, 12], including tumori-genesis [13, 14], cell adhesion [15–17], cell migration [18] and epithelial morphogene-sis [19]. Many researchers also start to establish 3D assays for high-throughput and high-content screening, for example, in the study of tumor cell migration and inva-sion [20]. Two 3D screening assays based on mouse and human breast cancer cells are extensively described inchapters 3 and 5 of this thesis.
Another type of assays are live-cell assays which are used to study the dynamics of cellular processes. It requires automated microscope to monitor these processes and often fluorescence tagged protein are used that are continuously imaged over a certain period of time. This allows the collection of much more detailed phenotypic information, especially temporal information is provided that otherwise cannot be obtained. In addition, live-cell assays can reveal primary defects and secondary con-sequences of the phenotype and thereby allow a more precise interpretation of the function of the molecules that are under investigation. This type of assays has been widely used in the study of embryogenesis [2], cell division [21], and intracellular translocation of molecules [22,23], which so far are the most significant achievements among all high-throughput and high-content studies. These type of studies are based on the discrimination between the cell membrane, the nucleus and the cytoplasm, and the translocation of fluorescently labeled molecules between the distinct com-partments. One example is the study of NF-κB nuclear translocation. Many studies
on this subject have been published in recent years, notably the work of Covert and co-workers [24,25]. They developed a screen platform with single cell resolution that can image and determine the NF-κB activation over time in a high-throughput
man-ner. Inchapter 2 of this thesis, a novel NF-κB screening platform is described that
also measures NF-κB activation dynamics at a single cell level but is able to apply
1.3.2 Image acquisition in a high-throughput manner
One of the characteristics of high-throughput and high-content screening is that a large amount of images needs to be acquired. Therefore image acquisition systems that are fully automated and time efficient are required. Most researchers choose to use commercial systems that are already available on the market [7, 26, 27]. In this chapter, the techniques that are relevant in the context of this thesis are summarized.
1.3.2.1 Microscope models
Most high-throughput and high-content image acquisition systems are equipped with wide-field fluorescence microscopy. For this type of microscopy, cellular structures of interest are tagged with fluorescent proteins and exited by light of a specific wave-length. After absorbing energy from excitation light, the fluorescent proteins emit light of longer wavelength that is captured by a detector to generate images. Confo-cal microscopy is another frequently used and more advanced fluorescence microscopy method. It adds a pinhole aperture in front of the light source so that light excites only one optical plane (focal plane) at a time. In addition, another pinhole is added in front of the detector to filter out the emission light generated from the plane above and beneath the focal plane. Therefore, images from confocal microscopy contain only sharp in-focus information from the focal plane. This is especially useful when a specimen is relatively thick and a series of optical sections need to be acquired through the specimen. The disadvantage is the relatively slower imaging process and longer exposure time of the specimen. Especially when a large number of sections needs to be imaged, severe photobleaching can occur and that presents an as yet unresolved problem.
The new generation of high-throughput screening systems starts to explore two-photon excitation microscopy [28], spinning disc microscopy [3] and super resolution microscopy [29]. Unfortunately, due to their relatively higher demand for both hard-ware and softhard-ware, only few researchers have so far developed and applied them successfully in high-throughput and high-content screening.
1.3.2.2 Magnification, resolution, sampling size and camera setting
Objective lenses are the most important component of an optical system because they are the predominant factor that defines image quality. In general, objective lenses can be classified based on their magnification and resolution. High-throughput and high-content screening systems are typically equipped with<10×,20×and40× magnification lenses. Different magnifications are applied according to the structure of analysis. Measurement of structures over large areas, such as cell networks or zebrafish embryos, requires lower magnification than measurement of sub-cellular structures, for example, nuclear repair foci in a DNA damage and repair assay.
from the focus that the objective can collect. According to the Rayleigh criterion, the relation between NA and resolution is formulated as:
r = 0.61× λ
NA (1.1)
whereλis the wavelength of emitted light. For a fluorescence microscope of NA= 0.5
and λ= 500nm, this results a resolution limit of 610nm. Two distinct objects closer
than this resolution will be imaged as a single object. Because in high-throughput and high-content screening image acquisition is often done (as well as in this thesis) with 4× or 10×lenses with NA equivalent to 0.13–0.3 (corresponding to resolution
limits of2346nm–1017nm at λ= 500nm), the objective lenses are the limiting factor
in determining which sub-cellular structures can still be imaged.
Sampling size (also refers to sampling frequency) often refers to the distance between 2 signal-recording points. According to the Nyquist rate, image sampling size in xy-direction bigger than half of the objective lens resolution would result in a loss of information. The pixel size of the camera used often determines whether this can be achieved (the width of each pixel in the camera chip divided by the magnification gives the size of each pixel in the sample plane). Combining pixels in the camera (pixel binning) can increase the pixel size and signal intensity. The benefits of this setting are that exposure time and image file size can be reduced significantly, but the disadvantage is that spatial resolution will be decreased.
1.3.2.3 Balance between quality and quantity
Image quality is directly related to magnification, resolution, sampling size, pixel binning and other elements. Higher magnification, smaller sampling size or no pixel binning could increase the image quality and this could make complex and compu-tational intensive image analysis methods redundant while much more detailed and accurate information can be extracted. However, better image quality sacrifices imag-ing time, processimag-ing time and requires more data storage. For example, reducimag-ing z sampling size from10µm to 5µm not only doubles the size of the image file, but also
doubles the time of imaging. Moreover, the limitations of hardware and software often make it impossible to deal with extremely large amount of data. For example, image files bigger than 1.5 gigabyte cannot be opened and analyzed by ImageJ on a 32-bit Windows operation system. Therefore finding the balance between image quality and quantity is very critical for high-throughput and high-content screening.
1.3.3 Image analysis
1.3.3.1 Segmentation
Segmentation is a technique of defining regions of the images that contain signals from the molecules which are under investigation (also called region of interested or ROIs). Those molecules are often fused with fluorescence protein or antibodies, or stained with fluorescent dyes, and as a result, regions that contain these molecules present higher signal intensity in images than other regions. This difference of intensity between ROIs and background is used for most segmentation algorithms. The key of those algorithms is to automatically determine an intensity threshold to distinguish ROIs and background, or sometimes multiple-levels are selected. There are other advanced segmentation methods that are model based or using prior knowledge, for example active contour model [30, 31]. However, considering their complexity and specificity, they have not been widely applied in high-throughput and high-content screening.
Because quantification is often made based on the segmentation result, proper segmentation is the key to generate meaningful data and must be optimized for ev-ery screening. Several commercial systems already combine image acquisition and analysis [7], for example, the BD pathwayTM bioimaging system, KineticScan HCS Reader (Cellomics) and ImageXpress high-content imaging Systems (Molecular De-vices). They provide many standard image analysis methods, however, it is not possible for researchers to substantially adapt these methods for more specific biolog-ical questions. Therefore many researchers choose to use independent image analysis packages or write their own macros. One of the most popular tools used in high-throughput and high-content screening is ImageJ (or Fiji, which is considered as a distribution of ImageJ). It contains various standard image analysis algorithms. More importantly, because of its free open-source feature, hundreds of state-of-the-art methods have been programmed in the form of ImageJ plugins and macros, and are provided online. Furthermore, it provides a user-friendly platform for developers to customize their own analysis. For example, image analysis algorithms developed in this thesis are programmed as ImageJ plugins.
1.3.3.2 Quantification
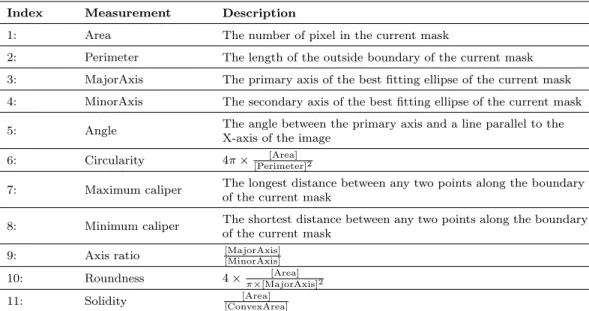
Quantification aims to extract numerical features from images. According to biolog-ical questions, features can be classified as morphologbiolog-ical based, localization based and intensity based. Morphological based features usually refer to the morphological properties of structures that are under investigation, such as the area of the nucleus (2D) or surface of neuron cell (3D). Localization based features contain relative spa-tial information of interested structures, for example the position of focal adhesions relative to the cell border. Both features are measured based on the segmentation result, and can be measured on the single-cell level or cell population level, or some-times even sub-cellular level [32]. Intensity based features can be measured from the segmentation result as well. For example, in the study of NF-κB translocation [33]
(chapter 2), dynamic changes of fluorescence intensity in the nuclear and cytoplasmic
based features are independent of segmentation result, such as moments and wavelet. Recently those features started to draw more and more attention, and some analysis packages already embed algorithms to measure them, such as CellProfiler [34] and PSLID [32,35].
1.3.3.3 Tracking and analysis for image stacks
For some research projects, tracking techniques are required. Tracking refers to find-ing the location of objects (such as nuclei or cells) in each consecutive frame of time-lapse images. It works directly on the segmentation result and it connects ob-jects in time on the basis of criteria such as the speed of motion, the shape of the trajectory and the possibility of the objects splitting (cell division) or merging (cell fusion). Once tracking is computed, the tracks and associated object properties (mor-phology and intensity changes) can be combined to yield a powerful description of the phenotypic evolution of cells.
For the study of 3D structures, series of optical sections are typically acquired and compose image stacks. Those stacks can be used to reconstruct the 3D geomet-ric models of the sample, or can be collapsed (also called projected) into a single 2D image. For the latter, further analysis such as segmentation and quantification is performed on the 2D projected images, thus saving processing time and data stor-age significantly. However, information in z-direction is missing. 3D analysis provides much more detailed spatial information, but requires more complicated and computa-tional intensive reconstruction methods and quantification methods. Although it has not been widely used for high-throughput screening, especially for large-scale experi-ments such as genome wide siRNA screens, due to the physiological and pathological relevance of 3D culture systems, image analysis for 3D throughput and high-content screening will become an important area for future innovative developments in image processing. This is the subject of chapters 4 and 5of this thesis.
1.3.4 Data analysis
applied, for example Mahalanobis distance. Because more aspects of phenotype are taken into account, multi-parametric tests often provide more precise hits for treat-ments that have high variability in a single readout metric. Several multi-parametric methods will be introduced and applied in this thesis.
Recently, machine learning started to show its powerful function in high-throughput and high-content screening [38]. Clustering is one of the typical techniques. It is a form of unsupervised machine learning and can be used to group the samples based on the phenotypic similarities. For example, clustering has been used to group drugs by their effects [39] and proteins by their sub-cellular patterns [40]. Another often used technique is classification [41], which is a form of supervised machine learning. The biologists define the classes of treatments according to the biological properties in advance. For example, genes which are involved in the same signaling pathway are assigned to the same class. Those samples with known classes are used as training data to train a “classifier”, which can automatically determine the class of unknown sample and which of the features are informative for distinguishing the classes. Some-times unsupervised machine learning and supervised machine learning are combined in one experiment, to for example investigate the relationship of known biological classes with morphological clusters.
1.4
Scope and structure of this thesis
Currently, image analysis is likely the major bottleneck in throughput and high-content screening studies. One of the problems is the lacking of robust single-cell based analysis. Few platforms perform single cell image analysis but rely on the cell density or image resolution. When the cells are too dense or image resolution and magnification is relatively low, for example in micro-tissue study, existing methods cannot work properly. Therefore, one goal of this thesis is to develop robust and efficient image analysis methods suitable for single-cell studies that should not be largely limited to cell type, cell density and image quantity
The reason that there is a great need for the methods of single cell analysis is that cells may respond to stimuli or perturbation differently, creating distinct sub-populations. Although many studies emphasize this effect, it has almost never been quantitatively identified and the information on subpopulation behavior has not been used for later screening data analysis. Thus how important the role is of subpopula-tion in many high-throughput and high-content screens is still unknown. This thesis aims to develop an analysis platform that takes into account the heterogeneity of cellular behavior so that subpopulation information is collected for the further data analysis.
they miss the information which cannot be revealed by morphological properties. This thesis aims to develop an ultra-high content analysis which collects maximum information of phenotype from images, which can be applied for various types of screening assays.
The structure of this thesis is as follows: chapter 2introduces an automated
im-age analysis for the study of NF-κB nuclear translocation kinetics in high-throughput
screening. Chapter 3 moves away from the live-cell screening and presents another
image analysis platform suitable for the study of 3D cultured micro-tissues. This platform firstly projects each image stack into a single in-focus 2D image, and then ultra-high content measurement is carried out on the 2D projected image. The work in
chapter 4extends this 2D projection based analysis to real 3D analysis, and
demon-strates that it is suited for screenings which use wide-field microscopy. In chapter 5, this 3D analysis platform is applied to analyze the effects of various anti-cancer
drugs on 3D micro-issues of mouse breast cancer. The performance of 2D projection analysis and 3D analysis is compared in chapter 5. Finally,chapter 6 provides a
References
[1] Pelkmans, L. et al. Genome-wide analysis of human kinases in clathrin- and caveolae/raft-mediated endocytosis. Nature 436, 78-86 (2005).
[2] Sonnichsen, B. et al. Full-genome RNAi profiling of early embryogenesis in Caenorhabditis elegans. Nature 434, 462-469 (2005).
[3] Korn, K. & Krausz, E. Cell-based high-content screening of small-molecule libraries. Curr Opin Chem Biol 11, 503-510 (2007).
[4] Starkuviene, V. et al. High-content screening microscopy identifies novel proteins with a putative role in secretory membrane traffic. Genome Res 14, 1948-1956 (2004).
[5] Chudakov, D. M., Lukyanov, S. & Lukyanov, K. A. Fluorescent proteins as a toolkit for in vivo imaging. Trends Biotechnol 23, 605-613 (2005).
[6] Lippincott-Schwartz, J. & Patterson, G. H. Development and use of fluorescent protein mark-ers in living cells. Science 300, 87-91 (2003).
[7] Pepperkok, R. & Ellenberg, J. High-throughput fluorescence microscopy for systems biology. Nat Rev Mol Cell Biol 7, 690-696 (2006).
[8] Tsien, R. Y. Building and breeding molecules to spy on cells and tumors. FEBS Lett 579, 927-932 (2005).
[9] Puigvert, J. C. et al. Systems Biology Approach Identifies the Kinase Csnk1a1 as a Regulator of the DNA Damage Response in Embryonic Stem Cells. Sci Signal 6 (2013).
[10] Zanella, F., Lorens, J. B. & Link, W. High content screening: seeing is believing. Trends Biotechnol 28, 237-245 (2010).
[11] Huh, D., Hamilton, G. A. & Ingber, D. E. From 3D cell culture to organs-on-chips. Trends Cell Biol 21, 745-754 (2011).
[12] Pampaloni, F., Reynaud, E. G. & Stelzer, E. H. K. The third dimension bridges the gap between cell culture and live tissue. Nat Rev Mol Cell Bio 8, 839-845 (2007).
[13] Petersen, O. W., Ronnov-Jessen, L., Howlett, A. R. & Bissell, M. J. Interaction with basement membrane serves to rapidly distinguish growth and differentiation pattern of normal and malignant human breast epithelial cells. Proc Natl Acad Sci U S A 89, 9064-9068 (1992). [14] Wang, F. et al. Reciprocal interactions between beta1-integrin and epidermal growth factor
receptor in three-dimensional basement membrane breast cultures: a different perspective in epithelial biology. Proc Natl Acad Sci U S A 95, 14821-14826 (1998).
[15] Cukierman, E., Pankov, R., Stevens, D. R. & Yamada, K. M. Taking cell-matrix adhesions to the third dimension. Science 294, 1708-1712 (2001).
[16] Meshel, A. S., Wei, Q., Adelstein, R. S. & Sheetz, M. P. Basic mechanism of three-dimensional collagen fibre transport by fibroblasts. Nat Cell Biol 7, 157-164 (2005).
[18] Zaman, M. H. et al. Migration of tumor cells in 3D matrices is governed by matrix stiffness along with cell-matrix adhesion and proteolysis. Proc Natl Acad Sci U S A 103, 13897-13897 (2006).
[19] O’Brien, L. E., Zegers, M. M. & Mostov, K. E. Opinion: Building epithelial architecture: insights from three-dimensional culture models. Nat Rev Mol Cell Biol 3, 531-537 (2002). [20] Echeverria, V. et al. An Automated High-Content Assay for Tumor Cell Migration through
3-Dimensional Matrices. J Biomol Screen 15, 1144-1151 (2010).
[21] Neumann, B. et al. Phenotypic profiling of the human genome by time-lapse microscopy reveals cell division genes. Nature 464, 721-727 (2010).
[22] Bartfeld, S. et al. High-throughput and single-cell imaging of NF-kappaB oscillations using monoclonal cell lines. BMC Cell Biol 11, 21 (2010).
[23] Azorsa, D. O. et al. High-content siRNA screening of the kinome identifies kinases involved in Alzheimer’s disease-related tau hyperphosphorylation. BMC Genomics 11, 25 (2010). [24] Lee, T. K. & Covert, M. W. High-throughput, single-cell NF-kappaB dynamics. Curr Opin
Genet Dev 20, 677-683 (2010).
[25] Tay, S. et al. Single-cell NF-kappaB dynamics reveal digital activation and analogue informa-tion processing. Nature 466, 267-271 (2010).
[26] Abraham, V. C., Taylor, D. L. & Haskins, J. R. High content screening applied to large-scale cell biology. Trends Biotechnol 22, 15-22 (2004).
[27] Starkuviene, V. & Pepperkok, R. The potential of high-content high-throughput microscopy in drug discovery. Br J Pharmacol 152, 62-71 (2007).
[28] Lakowicz, J. R., Gryczynski, I. I. & Gryczynski, Z. High Throughput Screening with Multi-photon Excitation. J Biomol Screen 4, 355-362 (1999).
[29] Ries, J., Kaplan, C., Platonova, E., Eghlidi, H. & Ewers, H. A simple, versatile method for GFP-based super-resolution microscopy via nanobodies. Nat Methods 9, 582-584 (2012). [30] Maksimovic, R., Stankovic, S. & Milovanovic, D. Computed tomography image analyzer: 3D
reconstruction and segmentation applying active contour models–’snakes’. Int J Med Inform 58-59, 29-37 (2000).
[31] Maksimovic, R. et al. Computed tomography image analyzer: segmentation applying active contour models–"snakes". Stud Health Technol Inform 68, 395-399 (1999).
[32] Glory, E. & Murphy, R. F. Automated subcellular location determination and high-throughput microscopy. Dev Cell 12, 7-16 (2007).
[33] Di, Z. et al. Automated analysis of NF-κB nuclear translocation kinetics in high-throughput screening. PloS one 7, e52337 (2012).
[34] Carpenter, A. E. et al. CellProfiler: image analysis software for identifying and quantifying cell phenotypes. Genome Biol 7 (2006).
[35] Huang, K. & Murphy, R. F. Boosting accuracy of automated classification of fluorescence microscope images for location proteomics. Bmc Bioinformatics 5 (2004).
[37] Malo, N., Hanley, J. A., Cerquozzi, S., Pelletier, J. & Nadon, R. Statistical practice in high-throughput screening data analysis. Nat Biotechnol 24, 167-175 (2006).
[38] Murphy, R. F. An active role for machine learning in drug development. Nat Chem Biol 7, 327-330 (2011).
[39] Perlman, Z. E. et al. Multidimensional drug profiling by automated microscopy. Science 306, 1194-1198 (2004).
[40] Chen, X. & Murphy, R. F. Objective clustering of proteins based on subcellular location patterns. J Biomed Biotechnol 2005, 87-95 (2005).
Automated analysis of NF-
κ
B
nuclear translocation kinetics in
high-throughput screening
Zi Di, Bram Herpers, Lisa Fredriksson, Kuan Yan, Bob van de Water, Fons J Verbeek & John H N Meerman
Abstract
Nuclear entry and exit of the NF-κB family of dimeric transcription factors play an
essential role in regulating cellular responses to inflammatory stress. The dynamics of this nuclear translocation within a cell population may dramatically change e.g. upon drug exposure. Furthermore, there is significant heterogeneity in individual cell response upon stress signaling. In order to systematically determine factors that de-fine NF-κB translocation dynamics, high-throughput screens that enable the analysis
of dynamic NF-κB responses in individual cells in real time are essential. Thus far,
only NF-κB downstream signaling responses of whole cell populations at the
tran-scriptional level are in high-throughput mode. In this study, we developed a fully automated image analysis method to determine the time-course of NF-κB
translo-cation in individual cells, suitable for high-throughput screenings in the context of compound screening and functional genomics. Two novel segmentation methods were used for defining the individual nuclear and cytoplasmic regions: watershed masked clustering (WMC) and best-fit ellipse of Voronoi cell (BEVC). The time profiles of NF-κB oscillatory response at the single cell and population level was coupled to
automated extraction of 26 analogue parameters including number of translocation peaks, amplitude of each peak, and duration of each translocation. The automated image analysis method was validated through a series of statistical tests demonstrat-ing computational efficient and accurate quantification of our algorithm. Both phar-macological inhibition of NF-κB and short interfering RNAs targeting the inhibitor
of NF-κB, IκBα, demonstrated the ability of our method to identify compounds and
2.1
Introduction
NF-κB is a family of dimeric transcription factors consisting of homo- or heterodimers
of different subunits (e.g. p65/RelA). It is involved in cellular stress responses to stimuli such as cytokines, free radicals, ultraviolet irradiation, oxidized LDL, and bacterial or viral antigens [1–5]. In resting cells, NF-κB dimers are located within
the cytoplasm, bounding to the NF-κB inhibitor IκB. After being exposed to NF-κB
activating stimuli such as TNFαor IL1β, the IKK (the inhibitorκB kinase) complex is
activated, which in turn phosphorylates IκB [6] and NF-κB [7,8]. Phosphorylated IκB
proteins are then ubiquitinated and degraded by the proteasome, thereby liberating NF-κB dimers that translocate into the nucleus and regulate the transcription of the
target genes. However, NF-κB dimers do not stay in the nucleus permanently. IκBα,
a member of IκB family, is a transcriptional target of NF-κB [9]. Transcription of
IκBα creates a negative feedback loop: newly synthesized IκBα protein enters the
nucleus and binds to NF-κB, leading to the export of complex back to the cytoplasm
(Figure 2.1). This negative feedback loop creates an oscillation of NF-κB
nuclear-to-cytoplasmic translocation. Such a response seems essential in modulating differential transcriptional responses under transient or sustained cytokine signaling [10]. Given the role of NF-κB in diverse (patho)physiological responses, understanding the cell
population dynamics of this process is essential.
The most common approach taken in NF-κB translocation studies, which
sim-ply measures the NF-κB localization ratio between the total nuclear and total
cy-toplasmic region of a cell population, obscures the fact that not all cells respond to the stimulation synchronously [10, 11](Figure 2.2a and 2.2b). Similarly, recent studies of lipopolysaccharide-induced NF-κB activity showed that only half of the
cells responded to the secondary TNFα autocrine signal, creating distinct
subpop-ulations [12, 13]. Such cell-to-cell heterogeneity seems essential for the plasticity of tissue responses to inflammation [14,15].
Furthermore, NF-κB responds to many different stimuli, each of which may lead
to different activation dynamics. To understand NF-κB signaling under a wide
vari-ety of stimulation conditions, it is important to measure single-cell NF-κB dynamics
in large cell populations. Obviously, studies of NF-κB translocation in just several
individual cells are not sufficient for this purpose, although dedicated and sophisti-cated image analysis methods have been developed for this specific task [11,16,17]. In order to systematically determine factors that define NF-κB translocation dynamics,
high-throughput screens need to be developed in relevant cell lines in the context of compound screening and functional genomics.
Our goal was to develop a methodology for quantification of NF-κB translocation
dynamics in single cells, suitable for high throughput screening (HTS). For this, we used HepG2/GFP-p65 cells which show a dynamic nuclear-to-cytoplasmic transloca-tion response upon TNFα stimulation (Figure 2.2a). To derive quantitative
informa-tion of this shuttling in the entire cell populainforma-tion, we set out a strategy for the image analysis (Figure 2.2c). We describe two novel segmentation methods that are required for this purpose: one for the segmentation of individual nuclei, and one for the seg-mentation of individual cells. Next, cell tracking was done based on the segseg-mentation results of nuclei. Finally, methods for the quantification of NF-κB translocation
dy-namics, and the extraction of informative parameters from the NF-κB translocation
time profiles are described. In addition, procedures and results for the validation of each step in the quantification methodology are presented.
2.2
Results
2.2.1 Image collection and pre-processing
Gaussian filter [18] to be 3 pixels, and the scaling of the filter to be 0.6. Next, the so-called Rolling Ball method [19] was used to remove the unevenly illuminated back-ground by subtracting an averaged image intensity within a circular kernel around each pixel (by ImageJ). The size of the kernel was chosen to be slightly larger than the radius of the largest nucleus. A pre-processed image of the nuclear channel is shown in Figure 2.3b. To define the overall cell cluster regions in images, the GFP-p65 channel was processed with a Median filter [20], resulting in smooth cellular regions (Figure 2.3f).
2.2.2 Segmentation for individual nuclei: Watershed Masked
Clus-tering (WMC)
The segmentation of individual nuclei was accomplished by watershed masked clus-tering [21, 22]. This method uses a watershed segmentation to divide images into separated regions, each of which contains only one nucleus. Subsequently, within each region K-means clustering [23] was applied to define the nuclear region (Figure 2.3c). This method is based on the assumption that each nucleus is evenly illumi-nated and the contrast between nuclei and background is sufficiently high. Over-segmentation is a well-known issue of watershed Over-segmentation. In order to address this issue, pre-processed images (Figure 2.3b) were convolved with a Gaussian filter to smooth discrete intensity signals, using an optimized kernel size. Once watersheds were obtained from this image, the pre-processed images prior to Gaussian convolving (Figure 2.3b) were used to apply K-means clustering.
2.2.3 Cell tracking
The nuclear masks obtained from the segmentation were used for the cell-tracking. In our NF-κB translocation experiments, we observed that most of the cells moved over
short distances between two consecutive image frames, and also a negligible number of cell divisions occurred during the image acquisition period. Given these condi-tions, the maximum overlap ratio OLR (Equation 2.1) is a feasible and applicable
criterion. For every labeled nuclear region in the current framenfi, whereirepresents
corresponding label and f represents the frame index, we connect its track with the
labeled nucleus in the next framenfj+1 which maximizes the OLRwithnfi:
OLRij =
nfi ∩nfj+1
max(Area(nfi), Area(nfj+1)) (2.1)
Given the short imaging interval, cells should not disappear from one frame to another except when moving out of the frame borders. Disappearing cells are thus likely to be caused by under-segmentation. In order to avoid fragmented cell traces, as may occur in the more condensed cell clusters, we applied an extra tracking image buffer [24] to store disappearing cell regions until they are recovered again in one of the subsequent frames that maximizes the OLRs. As a result, nuclei that are not
2.2.4 Segmentation for individual cells: Best-fit Ellipse of Voronoi Cell (BEVC)
The objects that need to be extracted in this particular live-cell NF-κB imaging
application are cells that grow in clusters. These cells touch and may slightly overlap with each other thus making it sometimes difficult to uniquely identify the cellular edges. Therefore the classic edge detection methods which locate the maximum intensity gradient are not applicable to this particular case. Instead, we propose a single cell simulation algorithm called best-fit ellipse of Voronoi cell (BEVC). The algorithm produces an estimate of the single cellular areas based on the topology of the cells, which is derived from the distribution of nuclei. In principle, it consists of three steps:
Step 1, generate Voronoi diagram according to the topology of nuclei:
A Voronoi diagram [25] was generalized based on a set of disjointed nuclear masks
bnucleus
i for i =1,2,3,. . . , Df, (Figure 2.3c) with bnucleusi
T
bnucleus
j = 0 when i 6= j,
whereDf is number of nuclear masks in the framef. Each Voronoi cellVi containing bnucleusi (Figure 2.3d) is defined as a region which includes all pixelsr closer to the
boundary of bnucleusi than to the other nuclear masks. The formula is presented as
following:
Vi(bnucleusi ) =
(
r∈ min
s∈bnucleus i
|r−s|< min s0∈SD
j6=ibnucleusj
|r−s0 |
)
(2.2)
Step 2, obtain the Voronoi diagram within the cell cluster regions: A
global threshold was applied to the pre-processed images of the GFP-p65 channel (Figure 2.3f) to obtain the binary masks of cell clusters (Figure 2.3g). Subsequently the masks were multiplied (AND operation) with the Voronoi diagram obtained from step 1, so that only the Voronoi cells within the binary masks of cell clusters were preserved (Figure 2.3h).
Step 3, estimate the cell shape per Voronoi cell: The underlying model
for BEVC is that cells are ellipsoid shaped objects. Based on this assumption, we simulated the region, or better shape, of an individual cell as the best-fit ellipse in each Voronoi cell Vi by calculating the major and minor axis from the centralized
moments (Figure 2.3i) [26,27].
2.2.5 Quantification of NF-κB translocation dynamics
In order to exclude improper segmentation, both cellular masks and nuclear masks were validated by supervised two-class classifiers, based on their morphological fea-tures (Table S2.1, Figure S2.1-S2.3 and see Supplementary note for details). Next, the NF-κB translocation dynamics Dt
i of a single cell i at a time point t is defined
as the ratio of average fluorescence intensities between the nuclear area bnucleusi and
Dt,fi =
1
N
P
p∈bnucleus
i Intensity(p) 1
M
P
p∈bnucleus
i ∩bnucleusi
Intensity(p) (2.3)
where p represents a pixel and f represents the frame index. N is the number of
pixels in the nuclear mask of celli, andM is the number of pixels in the cytoplasmic
mask of celli.
Figure 2.3: Stepwise demonstration of the image analysis method. An original image from the Hoechst stained nuclear channel (a) is pre-processed by image sharpening and background subtraction (b), followed by WMC for the nuclear mask identification (c). Subsequently, the Voronoi diagram (d) is generated based on the disjointed nuclear masks. For the GFP-p65 channel, the original image (e) is pre-processed by a smoothing filter (f) for the identification of cell cluster regions (g). By multiplication of the cell cluster masks (g) with the Voronoi diagram (d), the Voronoi mask is defined for each cell (h). The cytoplasmic areas are refined as the best-fit ellipse of Voronoi cells (i). Figure(j) shows the composite view of the original image from GFP-p65 channel and the corresponding BEVC segmentation result.
frames, linear interpolation was applied to generate missing data. For cells with tracks that disappeared in more than three consecutive frames, interpolation becomes too inaccurate and the corresponding translocation profiles were removed from the final data. Generally, <30% of cells were removed by this procedure.
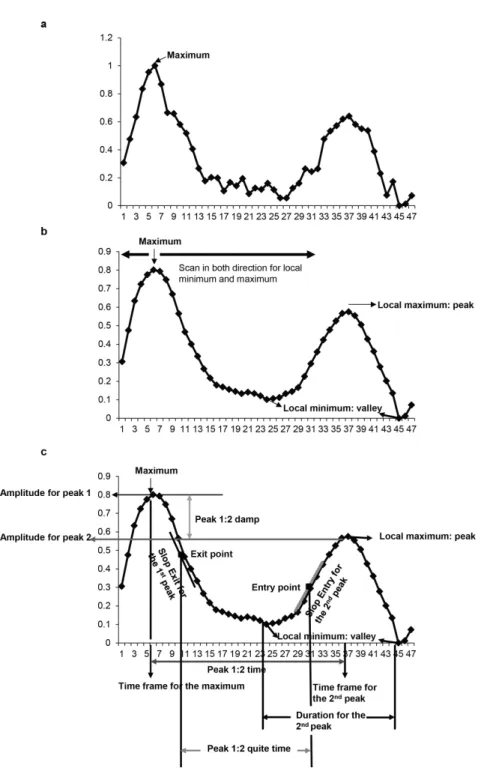
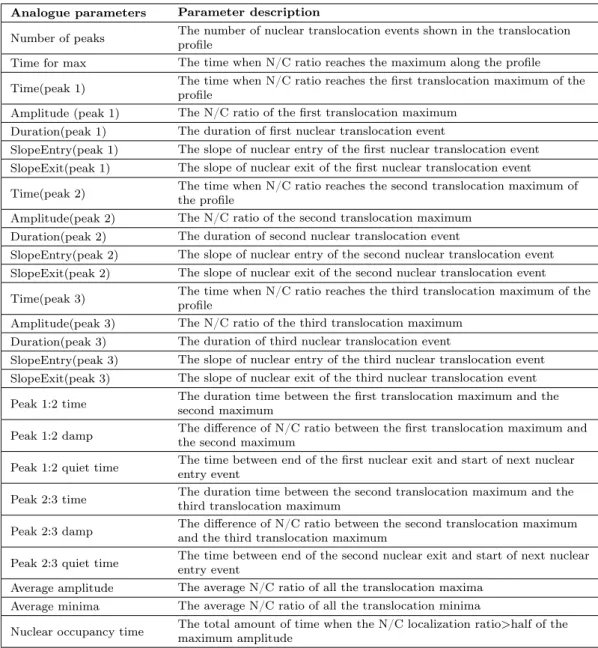
2.2.6 Quantification of NF-κB translocation analogue parameters
One advantage of the proposed analysis method is its ability to automatically quan-tify analogue parameters from each individual translocation profile (Supplementary note, Figure S2.5, Table S2.2). We first defined translocation events which start at a local minimum of a profile (NF-κB stays in the cytoplasmic region), include the
next local maximum (NF-κB translocates to the nuclear region), and end at the next
local minimum (NF-κB translocates back to the cytoplasmic region). We calculated
the number of translocation events, various properties for each translocation event, nuclear entry and exit rates and time between consecutive peaks; in total 26 ana-logue parameters. More detailed information and pseudo code are presented in the Supplementary note.
2.2.7 Statistical validation of the NF-κB quantification method
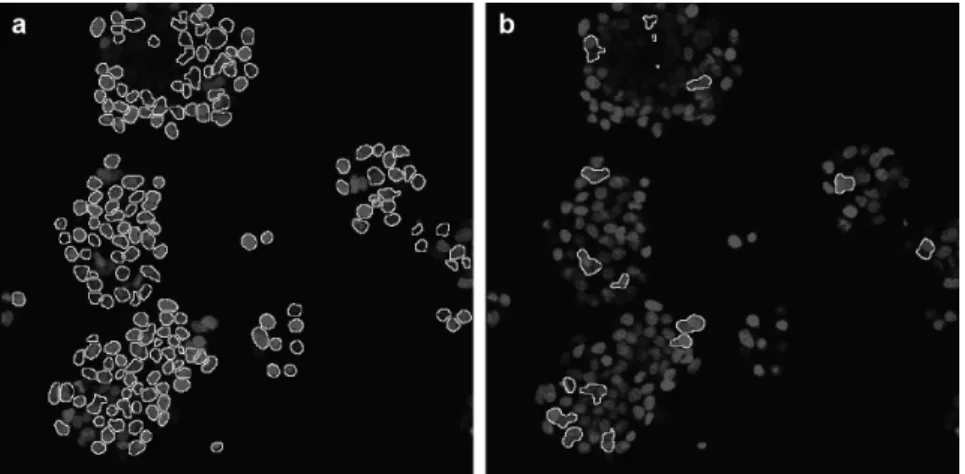
We validated our quantification method in a three step process using five randomly selected time-lapse image series. First, we compared our BEVC method for cell seg-mentation with other segseg-mentation methods that are used to segment touching or overlapping cells. One approach that is often used to define the cytoplasmic topo-logical region is to dilate the corresponding binary nuclear mask by a few iterations. However, the extent of the dilation requires fine-tuning for different cell sizes to avoid overlap between individual cells. Another approach is to define the cell region by only applying the Voronoi diagram. Our method (BEVC) extends the topology in-formation from the Voronoi diagrams with a best-fitting ellipse, which leads to a more stringent definition of the cellular area.
To compare these three methods (Dilation, Voronoi and BEVC), we first generated the binary images using different methods. For Dilation, we used a circular kernel with a radius of three pixels to define cytoplasmic regions, based on the general cell size in our images. Next, we assessed each segmentation result by comparing with human perception. For this, five test frames from different image series were used with a total of 1116 nuclei. For each frame f, a score named “error rate” ∂f was
calculated to measure the segmentation accuracy:
∂f =
i=1B(bcelli ) Df
×100% (2.4)
whereB(bcelli ) is a binary indicator that B(bcelli ) =
(
1, if bcelli ∈bcell,Originali 0, if bcelli ∈/ bcell,Originali . b
cell i
cellular mask of i0th cell obtained by human perception. Df is the total number
of cells in the image frame f, detected by one of three methods. The use of the
Voronoi combined with best fit ellipse (BEVC) yielded the smallest error rate for cytoplasmic area definition (10.3%±2.2%), compared to a Dilation or Voronoi method
(14.5%±3.2%and11.8%±1.4%respectively) (Figure 2.4a).
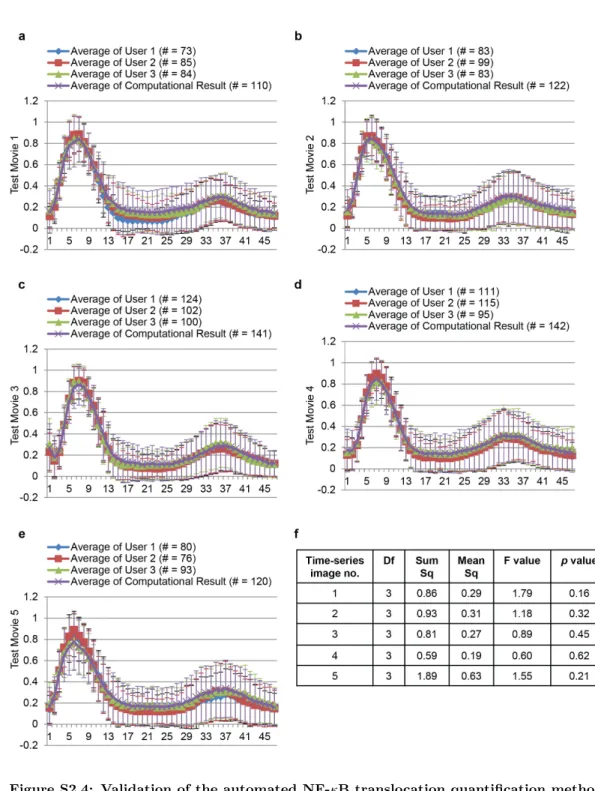
Next, we validated our NF-κB translocation quantification method by
compar-ing automatically generated translocation profiles with benchmark profiles that were produced from cells with validated segmentation and tracking profiles by human per-ception. Five randomly selected time-lapse image series each with 47 frames were used in this test. From each test image series, three benchmarks were generated sep-arately by three independent individuals (Figure S2.4a-e), in order to compensate for possible human bias. Subsequently, a split-plot ANOVA [28] was applied (by Statis-tical Computing Seminars Repeated Measures Analysis with R) to test the difference between the benchmark profiles generated by three test persons and the computa-tional result, in total four groups. The metric is the NF-κB Nuclear/Cytoplasmic
intensity ratio, and two independent factors are time and group. The statistical tests indicate that the variation between the three benchmarks is not significant; moreover there are no significant differences between the benchmarks and the computational result (Figure S2.4f). This indicates that the designed algorithm provides an accurate estimation of NF-κB translocation profiles.
2.2.8 Computational efficiency of the algorithm
We tested computational efficiency of the algorithm on the dataset obtained from HepG2/GFP-p65 cells (see Methods for details). The computational complexity of this algorithm is O(nlogn). We analyzed six sets of 60 time-lapse image series (six
times 3.51 GB). Each series contains two channels, and each channel consists of 60 frames. On average, 250 cells were analyzed per movie. The analysis of this dataset was completed in83±2minutes on a desktop PC (Intel Core i7-3770, 3.40 GHz with 8
GB of RAM and Microsoft Windows 7 Professional, SP1). The most computationally intensive part is the background subtraction on the nuclear channel followed by the segmentation of the nuclei by WMC. This takes ~64 seconds per series. Tracking of the nuclei is done in 6 to 7 seconds.
2.2.9 Identification of heterogenous cell populations
One of the main purposes to quantify single-cell NF-κB nuclear translocation
Figure 2.4: Statistical validation of the automated image segmentation and NF-κB translocation quantification. (a) Comparison of 3 cytoplasmic segmentation methods based on the criterion of error rate (Equation 2.4). The error rate of the Dilation method is14.5%±3.2%; of Voronoi it is11.8%±1.4%; and of BEVC it is10.3%±2.2%.*p−value <0.05; **p−value <0.005; Paired t-test (b) Example translocation profiles of (i) cells without translocation and cells with translocation, (ii) cells with and without a synchronized first round of NF-κB translocation, (iii) cells with NF-κB translocation occurring only once and cells with more than one NF-κB translocation event. (c) Bias assessment of our quantification method by comparison of the computational results with the benchmark for different subpopulations. No significant differences (p−value >0.1) were found between the computational results and the benchmark for different cell subpopulations within a 6 hour imaging time frame.
results with the benchmark. In each test, cells were clustered into two complemen-tary categories. In the first test, cells were clustered in cells without translocation response versus cells with translocation response (Figure 2.4b(i)). In the second test, we distinguished cells with a synchronized first peak of NF-κB translocation, from
non-synchronized responders (Figure 2.4b(ii)). In this category, synchronization was defined as the first NF-κB translocation peak occurring within three frames from
the first peak of population averaged profile. The third test clustered cells into (a) cells with no or only one (prolonged) NF-κB translocation event, and (b) cells with
more than one NF-κB translocation event (Figure 2.4b(iii)). The reason for defining
these three tests is their simplicity for human counting. For all three tests, we ob-tained p−values greater than 0.1, indicating that there is no significant difference
translocation profiles.
2.2.10 Biological validation of the NF-κB quantification method
In order to validate the sensitivity of our algorithm for perturbation of the biological system, a pilot experiment was performed by pre-exposing the HepG2/GFP-p65 cells for 2 hours with increasing concentrations of an IKK-inhibitor, BMS-345541 (0.5, 2.0 and 4.0µM) before TNFα stimulation. Inhibition of IKK prevents NF-κB nuclear
translocation (Figure 2.1). The experiment was performed in 96-well plates on two different days, with two replicates per plate. In the first analysis step, the average GFP-p65 nuclear/cytoplasmic ratio profile over whole cell population of each image series were generated from our quantification method. Already at very low inhibitor concentration (0.5µM), the second and third NF-κB nuclear translocation peaks were
delayed and the amplitude of the first peak was decreased. Increasing the concentra-tion of BMS-345541 to 2.0µM and 4.0µM prolonged the first nuclear translocation
event. Without TNFα stimulation, no NF-κB oscillation was observed (Figure 2.5a).
Next, the individual GFP-p65 nuclear translocation profiles were analyzed for the number of translocation events within the 6 hours imaging period after TNFα
stimula-tion. In non-stimulated cells, 5% of the cells show spontaneous nuclear translocation, which is non-synchronous (Figure 2.5b). After TNFα stimulation, there is nuclear
translocation with either one, two or three peaks, in 90% of the cells (Figure 2.5b). The average nuclear translocation profiles for cell subpopulations with either one, two or three peaks, clearly show that the percentage of cells with only one translocation peak increases with the concentration of BMS-345541, and that the percentage of cells with 3 translocation peaks decreases. In addition, we compared the time distri-bution of each translocation peak between the control (TNFα stimulated cells) and
BMS-345541 pre-treatment. The result indicated that already at a low concentration (0.5µM) a significant delay occurred for the second and third translocation peaks
(Figure 2.5c). In conclusion, all these data indicate that the quantification method can be used to perform cell-population studies, to identify rare events, and to study drug-dependent effects, even at low concentrations.
2.2.11 Application of the NF-κB quantification method in
high-throughput screening assays
Having validated our NF-κB translocation quantification approach for segmentation
Figure 2.5: Population analysis of NF-κB nuclear translocation perturbation by the IKKβ inhibitor BMS-345541. Cells were pre-treated for 2 hours with increasing concentrations of BMS-345541 before TNFα stimulation. (a) Average nuclear translocation profiles over whole cell population of image series. (b) Average nuclear translocation profiles with standard error bars for cells with one, two or three translocation peaks. The total number of cells, the number (N) and percentage of cells which show responding number of peaks are presented. (c) Analysis of the time distribution of the 1st, 2nd and 3rd nuclear translocation peak in TNFαstimulated and TNFα
stimulated plus 0.5µM BMS pre-treated cells. ns: No significant difference; ***p−value <0.001; ****p−value <0.0001.
8, which is a downstream effector of the TNFR, but does not affect the NF-κB
acti-vation; and siRNA control #1 (targeting luciferase) which also should not affect the NF-κB activation. These siRNAs were tested in 12 different 96-well plates (2
repli-cates per plate) on 4 different days, allowing an accurate analysis of the robustness of the assay.
yet surprisingly, siCntrl#1 slightly decreased the peak amplitude. IκBα knockdown
however, strongly impaired NF-κB oscillation as expected.
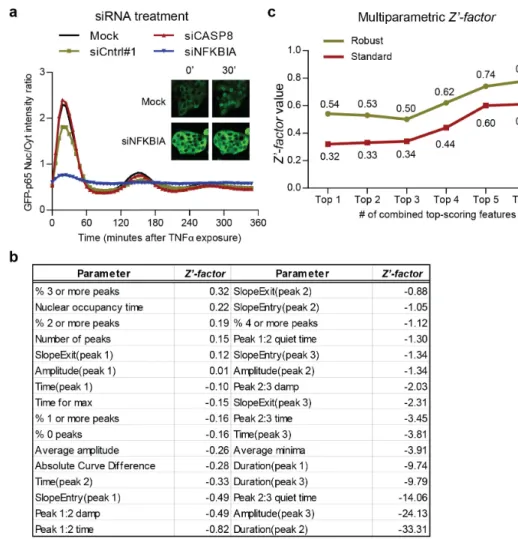
Next, for each well, we calculated the average for each of the 26 analogue pa-rameters (Table S2.2) over the cell population and derived further subpopulation information including the percentage of cells (%) showing 0 to 4 translocation peaks: in total 32 parameters (Figure 2.6b). In order to remove the cross-plate variance, a robustz−score[29] was calculated to normalize each of the 32 parameters for each
well.
To validate the reproducibility of controls and the quality of assay, we first calcu-lated the standardZ0−f actorfor each individual parameter (Figure 2.6b) to quantify
the stability of both positive and negative controls, as well as the difference between positive and negative controls [30]. However, this conventional method of quality con-trol is developed for assays with only a single readout and our quantification method provides readouts with multiple parameters. To enable the comparison of our assay with assays using only a single readout, we integrated multiple parameters into one value by Fisher’s linear discriminant [31, 32] as suggested recently for integration of multiple readouts for quality control in high-content screening [33]. A direction ω
was first identified to maximize the separation between positive control and negative control:
ω = (Spositive+Snegative)−1(µpositive−µnegative) (2.5)
whereµpositive,µnegative,Spositive andSnegative is the mean vector of positive control,
mean vector of negative control, covariance matrix of positive control and negative control, respectively. They were derived from the z−score vector [z−score1, z−
score2, ... , z −scoreN] of each well, where N is the number of parameters used
for the calculation of multi-parametric Z0 −f actor and N 6 32 . The z−scores
were then linearly projected onto this dimension ω according to Equation 2.6 and a
multi-parametric Z0−f actor (Equation 2.7) can be calculated from the projected
values.
Pi =ω·z−scorei (2.6)
Z0−f actor= 1− 3(Std(Ppositive) +Std(Pnegative))
|M ean(Ppositive)−M ean(Pnegative)| (2.7) where z −scorei is the z −score vector of well i. We measured both standard Z0−f actor(Equation 2.7) and robustZ0−f actor(Equation 2.8) by calculating the
mean and standard deviation (Std), and the median and median absolute deviation
(M AD), respectively:
robustZ0−f actor= 1− 3(M AD(Ppositive) +M AD(Pnegative))
Figure 2.6b shows univariate standard Z0−f actors for all 32 parameters. The
highest value was 0.32 and the highest robust Z0 −f actor was 0.54, both for the
parameter “% 3 or more peaks” in concordance with the strong reduction of the number of oscillations upon IκBα knockdown. According to an established criteria
[30], aZ0−f actor >0.5 indicates an assay suitable for HTS. The high value of the
robustZ0−f actortherefore may validate our method for HTS. When we integrated
the parameters with univariate Z0 −f actor > 0, in this case 6 parameters (Figure
2.6b), to calculate multi-parametricZ0−f actor, a higher value of 0.61 for standard Z0−f actorand a very good robust Z0−f actorof 0.78 were obtained which further
validates our assay for HTS (Figure 2.6c).
2.3
Discussion and conclusions
Controlling cellular fate in response to external stimuli is an important event in many physiological and pathological processes and in the action pharmacologically active compounds. Signaling routes that are involved herein frequently modulate gene-transcription by activation of nuclear transcription factors, such as NF-κB. In
order to obtain a better insight in underlying processes that lead to the activation of these transcription factors, their subsequent translocation to the nucleus, and in the downstream events that follow their activation, methods need to be developed that enable the study of such events at the individual cell level and in high throughput fashion. In this study, we successfully developed such a methodology based on a novel method for cytoplasm definition (BEVC) and nuclei segmentation (WMC). Our method can easily be adapted to study the activation and nuclear cycling of other nuclear transcription factors as well.
The cell line used in this study (HepG2) is an epithelial-like hepatoma cell line, showing clustered and stacked cell growth. This influences the readout for GFP-p65 translocation by epifluorescence microscopy: superimposed, yet out of focus nuclei decrease the accuracy of single cell tracking and measurements. By adopting confocal microscopy in this study, the resolution and accuracy of single cell measurements are increased. Furthermore, we introduced the BEVC algorithm for accurate cytoplasm definition based on cell topology. Combined with WMC segmentation for the nuclear mask, and a series of quantification processes such as linear interpolation, the NF-κB
translocation profile of each individual cell can be constructed. In order to validate our method, three sets of tests were applied on five time-lapse image series. These tests evaluated the proposed quantification method from three different perspectives, i.e. (1) accuracy of BEVC algorithm, (2) accuracy of calculated NF-κB translocation
Figure 2.6: Application of the NF-κB nuclear translocation analysis method in siRNA screening assays. (a) The population average of GFP-p65 nuclear/cytoplasmic ratio profiles for negative control siCASP8, siCntrl#1, transfection reagent without siRNA (mock), and positive control siNFKBIA. Inset: representative images of mock and siNFKBIA treated GFP-p65 cells, at 0 and 30 minutes after TNFαstimulation (b) Table showing the ordered univariate Z0−f actors
for all 32 individual parameters. The definitions of 26 analogue parameters are given in Table S2.2. Absolute Curve Difference indicates the absolute point-by-point difference between average profiles of control and treatment. (c) Multi-parametric Z0−f actors calculated based on the top-scoring univariateZ0−f actors. Both the standard as well as robust multi-parametricZ0−f actorsexceed the confidence threshold of 0.5 by combining more than 5 top-scoring univariateZ0−f actorswith linear projection.
Other algorithms, such as contours derived from an active shape model [34], would possibly define a more precise cell edge, yet at the cost of analysis speed. Moreover, due to the uniform distribution of GFP-p65 in the cytoplasm, exact detection of cell boundaries is considered less relevant.
NF-κB translocation profiles and the accuracy of cell subpopulation identification
respectively. Our results indicate no significant differences between human generated benchmarks and the results obtained from the automated computational procedures, thereby validating our methods for studying NF-κB translocation, not only in the
context of overall effects on the translocation response, but more importantly, also at the individual cell level.
In order to establish the sensitivity of our algorithm for perturbation of the bio-logical system, an experiment was performed by pre-exposing the HepG2/GFP-p65 cells for 2 hours with an IKK-inhibitor, BMS-345541 before TNFα stimulation. The
results show that already at the lowest concentration of BMS-345541, perturbation of NF-κB translocation was observed, thus validating our method for studying
fac-tors that affect this translocation. We also validated that our quantification method can successfully be applied in the context of high-throughput functional genomics screening. For this screening, the approach of gene silencing by transient transfection of siRNAs was applied. Based on calculation of multi-parametric Z0−f actors, we
demonstrated that our NF-κB quantification method can be used in HTS assays to
identify genetic players that interfere with the nuclear translocation of NF-κB.
In this study we demonstrated the effect of IκBα silencing by siNFKBIA
treat-ment on NF-κB oscillation. Theoretically the expected effect of IκBα loss would
be persistent nuclear presence of NF-κB, however, this is not observed. The 3-day
siRNA treatment instead led to an increased expression of the GFP-p65 construct, which was strongly retained in the cytoplasm, even upon TNFα stimulation (Figure
2.6a). Western-blot analyses showed that the loss of IκBα had resulted in a basic
up-regulation of NF-κB target genes, including A20 and IκBαitself (data not shown),
indicating that upon siNFKBIA treatment, the reporter cells had undergone multiple rounds of NF-κB translocation that most likely prevented further activation at the
time of imaging.
NF-κB signaling is a complex process, and the balance of cytokine production
and intracellular signaling transduction controls cellular fate in innate immunity and inflammation responses [14, 35]. It has been established by several groups that the individual cell response to cytokines may be very heterogeneous and is character-ized by a full response of a few cells at low TNFα concentrations, and a similar
response, but now for almost all cells at high concentrations, thereby creating dis-tinct subpopulations of cells [10,14,15]. We show that for the HepG2 cells 5% of the cells oscillate spontaneously when no stimulation was applied. Spontaneous nuclear translocation has also been reported in neuroblastoma cells, although at a slightly higher level (18%) [15]. It is thought that this cellular variation serves biological important goals such as stability in acute tissue responses that are made up from highly heterogeneous individual oscillatory cell responses [14]. Therefore, it is an im-portant goal and a major challenge to quantify cell subpopulations within the NF-κB
of a methodology suitable for HTS in the context of NF-κB signaling as presented in
this study, whereby time courses of NF-κB translocation can be recorded in hundreds
of individual cells over a period of many hours, presents a major breakthrough in this field. It now becomes possible to identify factors that govern NF-κB signaling at a
genome wide scale. We are currently performing siRNA screening using this model to identify novel kinases and ubiquitinases that affect TNF-induced NF-κB nuclear
shuttling.
Finally, the analogue parameters that we acquire from all the individual translo-cation profiles can be used as variables to model the sinusoidal oscillation of NF-κB
translocation by systems biology approaches [14,15,36].
2.4
Methods
2.4.1 Cell line and cell culture
HepG2 cells stably expressing N-terminally GFP-tagged p65 (GFP-p65) [37] were maintained in Dulbecco’s modified Eagle’s medium (DMEM) with high glucose, 10% (v/v) FBS and 25µg/mL penicillin/25µg/mL streptomycin. HepG2/GFP-p65 cells
were seeded on Greiner micro-clear 96well black plates (20,000 cells/well) and grown at 37◦C, 5% CO2 for 2-3 days.
2.4.2 Treatment of cells
The human cytokine TNFα(R&D Systems) was used in all experiments at 10ng/mL.
The IKK-inhibitor BMS-345541 was from Sigma-Aldrich. Transient knockdown of NFKBIA was achieved using siGENOME NFKBIA SMARTpool siRNA (50nM; Dhar-macon Thermo Fisher Scientific, Landsmeer, the Netherlands) and transfected into the HepG2 cells 3 days before imaging with INTERFERin (Polyplus transfection, Leusden, the Netherlands). Transfections with siGENOME SMARTpool CASP8 siRNA were used as negative controls in these experiments. Prior to imaging, nuclei were labelled with 100ng/ml Hoechst 33342 in culture medium for 45 minutes. For confocal fluorescence microscopy, upon recording the first frame of the time-series, TNFα was added as 10µL to each well containing 190µL medium.
2.4.3 Fluorescence microscope
The NF-κB nuclear translocation in the HepG2/GFP-p65 cells was imaged using
a Nikon TiE2000 microscope equipped with a Perfect Focus System at 37◦C with
5% CO2 delivery to the sample plate location. Both the Hoechst-nuclear channel