The Built Environment, Activity Space, and Time Allocation
An activity-based framework for modeling the land use and travel connection
Yingling Fan
A dissertation submitted to the faculty of the University of North Carolina at Chapel Hill in partial fulfillment of requirements for the degree of Doctor of Philosophy in the Department of City and Regional Planning
Chapel Hill 2007
Approved by
Asad J. Khattak
Philip R. Berke
Mai T. Nguyen
Yan Song
© 2007 Yingling Fan
ABSTRACT
Yingling Fan
The built environment, activity space, and time allocation: An activity-based framework for modeling the land use and travel connection
(Under the direction of Asad J. Khattak)
Cities and metropolitan regions face several challenges including rising urban
populations, sprawled land use patterns, and related auto dependence, energy consumption,
greenhouse emissions, and human health effects. An important aspect of addressing these
challenges involves understanding the connection between urban environments and spatial
and temporal characteristics of individual activity-travel behavior. Advances in the research
arena can inform the development of land use and transportation policies that facilitate access
to local opportunities, reduce auto dependence, promote healthy travel behavior such as
walking and bicycling, and generate travel time savings. Further, research efforts on this
subject can help to measure the successes of existing transportation and land use planning
tools in terms of their “secondary” effects on individuals’ spatial accessibility, time
allocation, and quality of life.
My dissertation systematically tests the connection between land use and
activity-travel behavior by presenting three perspectives: one that focuses on the census block group
level; another that focuses on the individual level; and one that focuses on the trip level. The
analysis at the census block group level, named as the census block group level activity
is associated with the aggregated distribution of activities and trips occurring within the
census block-group. The individual-level analysis, named as the individual activity space and
time allocation analysis, links individuals’ spatial and temporal footprints to the built
environment at the home location, traffic conditions at the home location, weather
conditions, and individual/household characteristics. The trip-level analysis, named as the
trip distance and duration analysis, demonstrates how environmental factors at the trip origin
and destination and activity/trip characteristics are associated with the distance and duration
of each trip.
The census block group level activity pattern analysis indicates that dense
developments are not necessarily positively associated with diversity in activity categories or
demographic diversity of the individuals who were involved with activities in the area.
Greater land use diversity is associated with higher activity density and greater activity
diversity but lower alternative mode share. Grid street patterns and the presence of sidewalks
are both associated with higher activity density and more alternative mode share.
The individual activity space and time allocation analysis shows that small activity
area size—less spatially dispersed daily activity locations—are related to dense
developments, more retail stores, the presence of sidewalks, and the presence of heavy traffic
in the residential neighborhood and are related to cold weather and precipitation. Most of the
built environment factors show no association with time allocations to out-of-home activities
or leisure activities, while they do show various associations with travel time allocations
depending on the travel mode. Besides the built environment at the home location, weather
conditions and traffic conditions also play an important role in both the individual spatial
The trip distance and duration analysis suggests that shorter distance of non-work
related trips is related to more retail stores, fewer industrial firms, and heavy traffic near the
trip origin. After controlling for trip distance, the duration of driving trips is positively related
to street grids, the presence of sidewalks, and dense developments at the trip origin and/or
destination while the duration of walking trips is not. The analysis also suggests different
activity/travel categories show dramatic differences in the sensitivity to environmental
factors such as the built environment, traffic conditions, and weather. Not only do trips with
different modes respond to these environmental factors in different ways, but trips related to
different activity categories also show differences in the environmental sensitivity. Walking
trips are more vulnerable to weather conditions than are driving trips.
This research took an activity-based and time use approach to study the land
use-travel connection, which fills the gap between activity modeling and land use-use-travel
modeling in the existing literature. Evidence found in this research supports the notion that
transportation problems can be ameliorated through the use of land use strategies. The
research also points out that the strength of the land use-travel connection is conditional on
other environmental factors such as traffic and weather conditions, as well as activity context
ACKNOWLEDGMENTS
I am indebted to the many people with whom I had the honor of working and without
whom the completion of this dissertation project would have been much more difficult. I am
thankful to all the members in my qualifying examination and dissertation committees—
Professors Berke, Burby, Khattak, Nguyen, Rodríguez, and Song who helped me to bring this
work to fruition. Comments and advices that come from Professor Daniel Rodriguez have
been incredibly detailed, informative, and helpful. Professor Yan Song has provided me
tremendous mental support and has given me directions about my research as well as my life.
My deepest thanks go to my advisor and my mentor—Professor Asad J. Khattak. He is the
person that has been supporting my study and work, showing me the ropes in the academia,
and helping me become an independent researcher.
I want to thank my peers in the doctoral program, Tab, Alyssa, Mark, and especially
Beth for providing me endless help and encouragement. I am grateful to my parents, my
sister, and my husband, as well as the larger DCRP family of faculty and staff, for their
support and love during my doctoral study.
The data utilized in this dissertation was graciously provided by Institute for
Transportation Research and Education (ITRE) and the Triangle Council J. I want to thank
TABLE OF CONTENTS
LIST OF TABLES
LIST OF FIGURES
CHAPTER I: Introduction ... 1
Problem Definition... 1
Research Objectives... 4
Three Analyses... 4
Contribution ... 6
Chapter Structure ... 10
CHAPTER II: Review of Relevant Literature ... 12
Activity-Travel Pattern Studies... 12
The Built Environment and Travel Behavior... 17
Summary ... 23
CHAPTER III: Conceptual Framework ... 26
A General Environment-Behavior Model... 26
The Theory of Demand ... 28
How the Built Environment May Influence Activity Engagement and Travel ... 31
CHAPTER IV. Research Design and Methods... 43
Measuring the Built Environment... 46
Measuring Human Activity Patterns... 48
Measuring Individual Activity-Travel Behavior ... 53
Variables and Models ... 54
Threats to Validity ... 66
CHAPTER V: Census Block Group Level Activity Pattern Analysis ... 71
Descriptive analysis ... 72
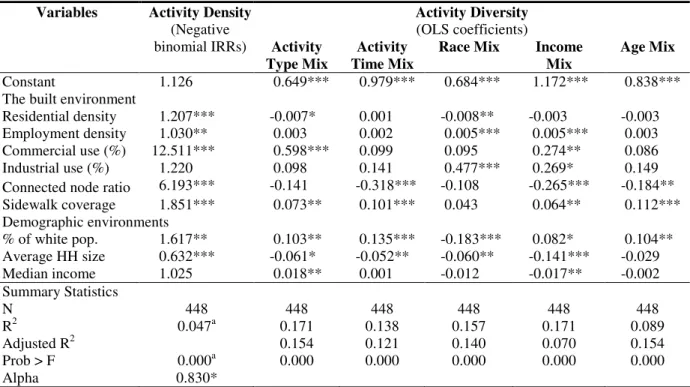
Activity Pattern Models ... 74
Travel Pattern Models... 80
Key Findings and Limitations... 83
CHAPTER VI: Individual Activity Space and Time Allocation Analysis ... 86
Descriptive Analysis ... 87
Activity Space Models... 92
Activity Time Allocation Models ... 98
Travel Time Allocation Models... 106
Key Findings and Limitations... 115
CHAPTER VII: Neighborhood Clusters, Activity Space, and Time Allocation... 119
Identification of Neighborhood Clusters ... 119
Mean Comparison... 123
Neighborhood Cluster Models... 128
Key Findings and Limitations... 138
Descriptive analysis ... 141
Activity-Specific Distance Models ... 143
Mode-Specific Duration Models... 148
Key Findings and Limitations... 155
CHAPTER IX: Summary, Discussion, and Conclusions ... 158
Summary of Findings... 159
Discussion ... 167
Conclusions... 175
Limitations and Future Directions ... 180
LIST OF TABLES
Table 3-1 Hypotheses in the census block group level activity pattern analysis... 34
Table 3-2 Hypotheses in the individual activity space and time allocation analysis... 37
Table 3-3 Hypotheses in the trip distance and duration analysis... 41
Table 4-1 Variables used in the census block group level activity pattern analysis... 55
Table 4-2 Variables used in the individual time allocation analysis ... 57
Table 4-3 Variables used in the trip distance and duration analysis... 63
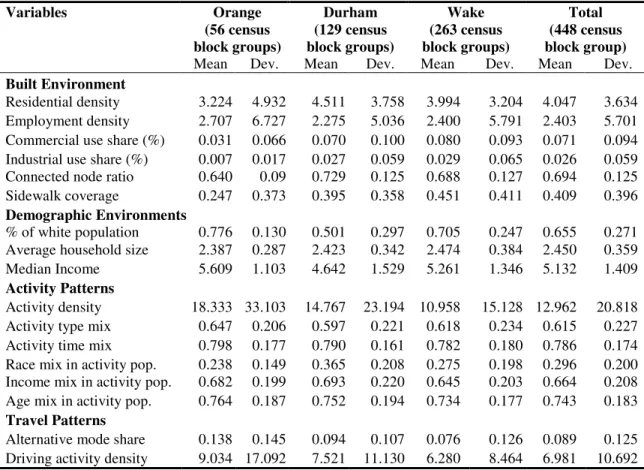
Table 5-1 Descriptive statistics of the built environment, demographic environments, and human activity patterns in the Triangle area... 73
Table 5-2 Negative binomial regression and OLS regression results of activity patterns... 75
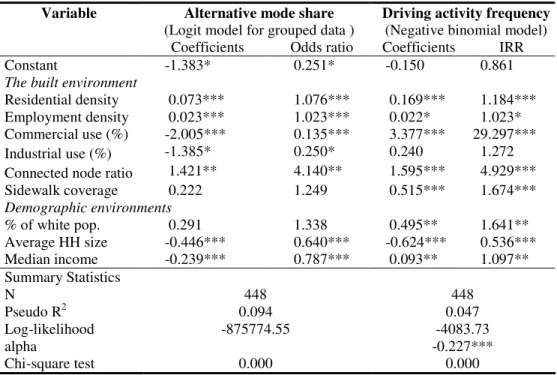
Table 5-3 Regression results on alternative mode share and driving activity frequency ... 81
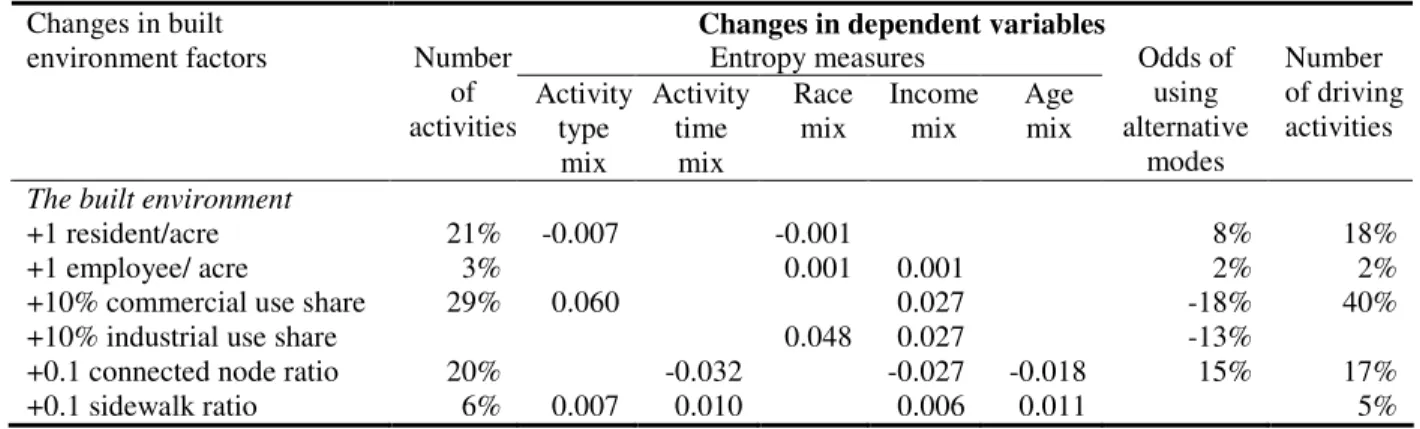
Table 5-4 Evidence found in the census block group level activity pattern analysis ... 84
Table 6-1 Descriptive statistics of activity space and time allocation indicators (N=7,422) . 88 Table 6-2 Descriptive statistics of environment factors and control factors (N = 7,422)... 90
Table 6-3 Modeling results on individual daily activity space ... 95
Table 6-4 Modeling results on daily miles traveled... 96
Table 6-5 Activity time allocation models using the Tobit model ... 100
Table 6-6 Out-of-home activity time allocation models using the Heckman selection model with OLS ... 103
Table 6-7 Leisure activity time allocation models using the Heckman selection with OLS model... 104
Table 6-8 Drive and walk time allocation models using the Tobit model... 107
Table 6-9 Transit and bicycle time allocation models using the Tobit model... 108
Table 6-10 Drive time allocation models using the Heckman selection model with OLS... 110
Table 6-11 Walk time allocation models using the Heckman selection model with OLS ... 111
Table 6-13 Evidence found in the individual activity space and time allocation analysis
(direct measure models) ... 116
Table 7-1 Socio-demographic mean comparison by neighborhood type ... 123
Table 7-2 Modeling results on daily activity space and neighborhood clusters ... 129
Table 7-3 Modeling results on daily miles traveled and neighborhood clusters ... 132
Table 7-4 Drive time allocation models using the Heckman selection model with OLS... 134
Table 7-5 Walk time allocation models using the Heckman selection model with OLS ... 135
Table 7-6 Transit time allocation models using the Heckman selection model with OLS... 137
Table 7-7 Evidence found in the individual activity space and time allocation analysis (neighborhood cluster models) ... 138
Table 8-1 Descriptive statistics for measures of trip characteristics... 142
Table 8-2 Semi-log transformed regression results on trip distance of non-work travel... 145
Table 8-3 Untransformed OLS regression results on trip distance of non-work travel... 148
Table 8-4 Semi-log transformed regression results on mode-specific duration models... 151
Table 8-5 Untransformed OLS regression results on mode-specific duration models... 154
LIST OF FIGURES
Figure 3-1 A general environment-behavior model... 28
Figure 3-2 Changes in travel distance by land use patterns... 29
Figure 3-3 Changes in driving and walking trip cost by land use patterns... 30
Figure 3-4 How the built environment may influence activity engagement and travel... 31
Figure 4-1 Study area (Orange, Durham, and Wake Counties, NC) ... 45
Figure 4-2 Driving destination density in the Triangle region ... 50
Figure 4-3 Two individuals’ daily activity spaces ... 54
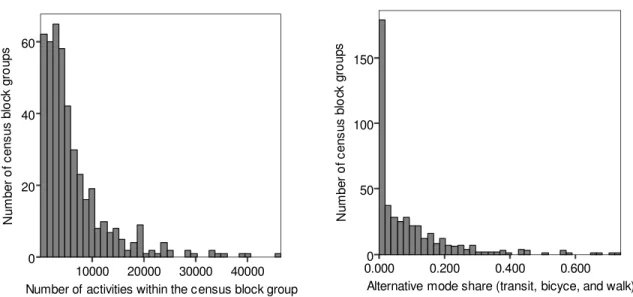
Figure 5-1 Distributions of activity frequency and alternative mode share at the census block group level ... 74
Figure 6-1 Individual activity spaces and home locations... 88
Figure 6-2 Frequency distribution of spatial activity-travel indicators ... 93
Figure 6-3 Frequency distributions of the activity time allocation variables ... 98
Figure 6-4 Frequency distributions of the travel time allocation variables ... 107
Figure 7-1 Identified clusters of survey households ... 121
Figure 7-2 Spatial measures of individual activity-travel behavior by neighborhood type.. 125
Figure 7-3 Activity time allocations by neighborhood type ... 126
Figure 7-4 Travel time allocations by neighborhood type... 128
Figure 8-1 Walking trip paths in the Triangle area... 143
Figure 8-2 Driving trip paths in the Triangle area ... 143
Figure 8-3 Frequency distributions of distances of shopping, leisure, and other trips ... 144
Figure 8-4 Frequency distributions of driving trip duration and walking trip duration... 150
Figure 9-1 Summary of findings in the research ... 160
Figure 9-2 Standardized coefficients of the urban form factors ... 168
Figure 9-4 Probability of driving/walking by connected node ratio... 172
CHAPTER I: Introduction
Problem Definition
Over the past two decades, land development and energy consumption in the United
States have been rising entirely out of scale with population growth. The amount of
developed land increased 47% from 1980 to 2000—twice as much as the population growth
rate (24%). In the same period, household annual vehicle miles traveled (VMT) increased
108% and average time spent in traffic increased about 238% (Bureau of Transportation
Statistics 2001). The recent trends not only place mounting pressures on natural resources,
the environment and the climate but also have the potential to impact on the social
environment and human well-being in a variety of negative ways (Song, Gee et al. 2007).
Environmental, health and social problems arise from complex processes involving
many factors such as planning and zoning practices, technology developments, governmental
interventions, etc. However, the extensive use of automobiles has played a critical, if not the
most important, role in recent trends.
On the one hand, on-road motor vehicles account for a significant proportion of air
pollution and energy use. On the other hand, with the close connection between
transportation and land use, extensive auto usage results in more auto-oriented land
development patterns which in turn present significant obstacles to alternative transportation
modes and physical activity. In addition, although advanced technology development has
improvements do not necessarily mean less traffic congestion, better accessibility to places
and more time savings. In 2003, Americans on average spent about 70 minutes per capita on
driving every day (Fan and Khattak 2006), which is about twice as much as twenty years ago.
The increased time spent in traffic has negative impacts on economic productivity and
overall quality of life. Therefore, given the harmful effects of auto travel on the environment,
public health, and economy, it is essential for us to seek policy and planning solutions that
are able to reduce driving time.
In recent years, one of the most popular planning ideas has been the use of urban
design to solve traffic and social problems. The presumption that auto travel will decrease in
more compact and gridlike land-use development is so appealing that it has been reported as
a virtual fact on this subject (Boarnet and Crane 2001). Notions like active living by design
and place-making have been gaining currency in both academic and public discourses.
Researchers in relevant fields have made substantial progress in exploring land use and travel
interactions. Much existing research has documented the negative correlation between
compact development patterns and car travel. However, simple correlation cannot confirm a
real connection, establish the casual theory, or provide sufficient robustness for policy
development. For instance, the negative relationship between density and auto use might be
due to heavy traffic and lower speed limits associated with dense developments, high levels
of land use mix associated with high building density, and/or the fact that density shortens
travel distance. Without knowing the underlying mechanisms explaining the land use and
travel connection, we cannot safely propose any urban design solutions to achieve
The challenge lies in the complexity of decision-making and the enormous
interactions between urban form and travel. Travelers in urban environments make numerous
daily decisions including what activities to pursue, how much time to allocate to each
activity, when, where and with whom to participate in the activities, how to travel to the
selected activity locations, and so on. Interactions exist within these daily decisions and
further contribute to the intricate maze of human decision-making. As cities, transportation
networks, and communication systems exist to alter space and time (Miller 2004),
individuals’ daily decisions are influenced by urban environments in many ways at various
spatial-temporal scales. The relationship between urban planning and activity patterns is
especially relevant in the context of processes such as urban sprawl and the decentralization
of economic activities, which impact individuals’ option for activities and trip-making. With
the assumption that urban planning can allow individuals to engage in all their required
activities with shorter travel distances and possibly by non-motorized modes, a better
understanding of the relationship between the built environment and activity and travel
patterns can help to propose the solutions to global warming, climate change, and peak oil.
In addition, urban planning and human activity and travel patterns are mutually
related phenomena. As Chapin (1974) pointed out, studying aggregate distributions of
activities in time and space sheds light on the impacts of different policy scenarios.
Examining the spatial and temporal characteristics of daily individual activity-travel behavior
can demonstrate the kind of environment that concentrates individuals’ activities within and
around highly accessible mixed-use centers and hold important implications for
Therefore, it is essential to sketch out an activity-based framework about how the
built environment may influence the spatial and temporal patterns of travel and
systematically empirically test the mechanisms behind the land use and travel connection.
This dissertation research makes a significant step towards that aim.
Research Objectives
The main research question to be examined in this research is: How are built
environment factors, including land use patterns, street patterns, and pedestrian facilities,
associated with individuals’ space and time use?
The subsequent question is: If compact development patterns in the built environment
(e.g., high land use density, mixed land uses, street grids, and presence of sidewalks) are
associated with less spatially dispersed activity patterns and less daily time spent on car
travel, what are the underlying mechanisms?
Specifically, this research tests the following two sets of mechanisms:
Dense developments, street grids, and mixed land uses are associated with shorter distance of non-work travel.
After controlling for trip distance, land use density, street patterns, and sidewalks are associated with driving trip duration and walking trip duration
with different significance, magnitude, and directions.
Three Analyses
To investigate how land use patterns relate to space and time use, the research
group, the individual, and the trip.
At the census block group level, the research links built environment factors to human activity and travel patterns. The census block group level analysis
explains the aggregate distributions of activities in time and space.
The individual-level analysis examines how the built environment at individuals’ residences relate to individuals’ daily activity spaces and daily
time allocations to various activities and travel modes. This space and time
use approach at the individual level not only can incorporate the fullness of
the space and time dimensions but also can further address the complexity of
daily decision-making. In addition to built environment factors, traffic and
weather conditions were included as another important set of environmental
factors in this analysis.
The trip-level analysis takes a closer look at how the built environment at the trip origin and/or the destination may influence the distance and duration of
each trip. In addition to controlling for household factors, personal
socio-demographics, and individual attitudes and preference, the analysis further
incorporates activity characteristics (such as activity type and activity time of
day) and trip characteristics (such as mode, distance, and home-based
indicator) into modeling the connection between the built environment and
trip distance and duration. By disaggregating the elements of travel such as
this trip-level analysis is dedicated to testing the mechanisms underlying the
land use and travel connection.
Contribution
When compared with similar literature, this study is unique in several ways. In terms
of theoretical contributions, this research explicitly derives a theoretical model of land use
and travel connection from the economic theory of demand and the psychological theory of
environment-behavior interactions. The theoretical framework provides mechanisms by
which land use influences aggregate urban traffic and individual travel behavior. A key
modeling strategy is to treat trip distance and duration as choice variables rather than
parameters of mode choice.
In terms of empirical contributions, this research systematically tests the connection
between land use and activity-travel behavior from three angles—the block group, the
individual, and the trip. It echoes three different film-making styles: one focuses on a
physical space, one focuses on an actor—the individual, while yet another focuses on a
journey. The census block group level activity and travel pattern analysis examines how the
built environment of a census block group is associated with the aggregated distribution of
activities and trips occurring within the census block group. The individual activity space and
time allocation analysis links individuals’ spatial and temporal footprints to the built
environment at the home location, traffic conditions at the home location, weather
conditions, and individual/household characteristics. The trip-level distance and duration
To the author’s knowledge, this is the first activity-based study that investigates the
land use and travel connection using three analysis units from both the spatial and temporal
perspectives. By offering activity and travel analyses at the aggregate level and disaggregate
levels, this dissertation is able to give more explicit and more meaningful attention to
environmental contingencies as well as to provide insights into the environment effects on
activity and travel decision-making.
The treatment of urban form and land use in this research is extensive, incorporating
the following measures for the Triangle area in North Carolina: residential density,
employment density, accessibility to commercial uses or retail stores, presence of industrial
uses or companies, connected node ratio, and presence of sidewalks. In addition to these
direct measures, a transect—a typology of neighborhood types—was developed and used to
analyze how individual activity spaces and time allocations vary across neighborhood types.
The use of direct measures improves the transferability of the results to other regions and
helps to make more practical and more specific planning recommendations. The use of
neighborhood clusters provides an intuitive spatial representation of urban environments and
captures the collective and interactive effects involving multiple environmental features on
activities and travel. In addition, the geo-coded behavior data in the Triangle survey make it
possible to generate and focus on measures not only at the home locations but also at the trip
origins and destinations.
In addition to built environment factors at the home location and the trip origin and
destination, the research considered traffic conditions and weather conditions as another
the estimates of built environment factors, but also helps us propose more practical policy
implications.
Activity-travel pattern measurement includes approaches drawn from spatial statistics
and computational geometry. Kernel density estimation was used to generalize driving
destinations to the entire study area and generate driving destination density—a proxy
measure of urban traffic conditions. Individual activity space, defined as the minimum
convex polygon containing an individual’s activity locations, was developed to describe the
spatial activity patterns at the individual level. The research also develops entropy measures
to describe diversity in the types and the times of activities occurring within the census block
group, and the race, income, and age mix in the individuals who accomplished activities
within the census block group.
Furthermore, while considerable evidence has suggested that compact development
patterns are associated with auto travel reduction, little existing research explains the
mechanisms by which compact land use patterns achieve this reduction. By disaggregating
the elements of travel such as distance and duration and specifying the travel mode and the
activity context, the research disentangles the land use and travel connection into several
testable hypotheses and examines them systematically. Thus, the research proposes, isolates
and separately tests potential channels through which the built environment may influence
travel. This goes beyond the conventional individual-level cross-sectional studies in the field.
Research investigating the land use-travel connection rarely focuses on the time
dimension. Very little is known regarding how the built environment relates to activity and
travel time use. This research focuses on daily activity and travel time allocations that
the time cost of traveling. With the individual-level time allocation models, this research
provides insights into how time allocations to various activities and travel modes change with
built environment factors at individuals’ residences. With the trip-level duration models, the
research findings help us better understand to what degree the built environment changes the
time cost of travel.
Earlier studies largely examined the land use-travel connection outside of the activity
contexts, which may generate inconsistent estimates. Trips of different types may respond
differently to environmental factors (Meurs and Haaijer 2001). This research incorporates
activity contexts (activity type and time of day) and trip characteristics (home-based indicator
and travel mode) into the models of the built environment and trip distance and duration. By
developing activity-specific models and mode-specific models of the built environment and
travel behavior, this research predicts travel behavior more accurately. Further, time use and
activity-based approaches are theoretically appealing and make it possible to account for the
interconnectivity among trips, the interplay between activity and travel, and the role of the
time-space continuum in modeling travel demand (Pendyala and Goulias 2002).
In terms of contributions to policy and practice, the research findings contribute to
such emerging movements as active living by design and place-making. As the research
findings are intended to disentangle the mechanisms behind the land use-travel connection,
the results will help policy-makers make more informed and more specific decisions to create
supportive places that encourage healthy travel behavior and improve individual quality of
life.
The research findings also contribute to the ongoing policy debates regarding travel
environment on trip distance and duration that closely relate to trip price/cost, the research
findings are comparable to the earlier findings about transportation pricing policies. Findings
from this travel time research can be used to shed light on how well direct regulatory policies
such as pricing compare with more indirect planning interventions such as urban design. In
addition, the research findings enable travelers to make more informed decisions regarding
which transportation mode can free up more time resources.
Chapter Structure
Chapter II presents a synthesis of the literature relevant to activity engagement and
travel decision-making in urban environments. Two key areas are identified: activity studies,
and studies about the built environment and activity/travel decision making.
In Chapter III, I first discuss the theoretical foundations for this work drawing on the
environment-behavior model in social physiology and the theory of demand in
microeconomics. Based on the theoretical foundations, I further provide a framework for
how factors in urban environments including the built environment, urban activity patterns,
and weather conditions may influence activity engagement and travel behavior.
Chapter IV describes the research design and methodology used in this study. The
chapter details the study site, data collection and manipulation, and models.
In Chapter V, I analyze how built environment factors relate to activity/travel patterns
at the census block group level. Activity patterns were measured using density and diversity
indicators. Alternative mode share in all the trips attracted to each block group is used to
activity types and population groups (e.g., race, income, and age). This chapter also tests
whether grid street patterns and pedestrian facilities attract more trips using alternative
transportation modes.
In Chapter VI, I analyze how built environment factors at the home location
combined with traffic and weather conditions relate to individual daily activity space and
time allocation. The analysis controls for individual/household socio-demographics, location
choice factors, and traffic information usage.
In Chapter VII, I develop a neighborhood typology in the study area and identify six
neighborhood clusters. A mean comparison analysis was conducted to describe how
individuals’ daily activity spaces and activity/travel time allocations differ across the six
neighborhood clusters. The neighborhood clusters were further used to model the collective
effects involving multiple environmental features on individual daily activity space and time
allocation.
In Chapter VIII, I analyze how the environmental factors at the trip origin and
destination are associated with the distance of non-work trips, and how theses factors are
further associated with trip duration. The analysis was carried out at the single activity/trip
level. Activity-specific distance models and mode-specific duration models were developed
to understand how the direction and/or strength of the relationship between the built
environment and travel vary by activity type and travel mode.
The findings were reviewed in Chapter IX as they relate to the hypotheses and a
priori expectations. Based on the findings, I further draw conclusions from the findings,
CHAPTER II: Review of Relevant Literature
As this dissertation aims at developing an integrated activity-based land use-travel
modeling system, the purpose of this literature review is mainly to analyze and synthesize
what past research can tell us about the interrelationships among the built environment,
activity engagement, and travel behavior. This review identifies the remaining gaps between
activity-based modeling and the modeling of land use and travel demand. I also explain gaps
within those two areas, the reasons why studies in each area did not reach consistent results,
and future directions suggested by the existing work.
The first section in this chapter focuses on studies along the line of an activity-based
framework and discusses the concept development in spatially and/or temporally describing
activity-travel patterns. The second section reviews studies on the connection between land
use and travel. In the summary section, I identify the remaining gaps and disagreements in
those two areas and discuss the synergy potential of these two areas.
Activity-Travel Pattern Studies
According to Chapin (1974), urban planning should be based on the study of
individuals’ needs for activity engagement. Since the early 1970s, researchers on the subject
have been seeking comprehensive treatments of the space and time dimensions in studying
Hägerstrand (1970) first formulated a time-geographic framework to describe how
urban activity systems set limitations on individuals’ options for being engaged in activities.
He modeled individuals as paths or trajectories in time-space, experiencing capability
constraints, coupling constraints, and authority constraints. The time-geographic model takes
a disaggregate view of human activity and provides a complete contextual base for
interpreting individual activities and travel in urban environments. The usefulness of the time
geography approach was soon recognized in many fields (Pred 1977). Such fields include
historical geography (Hagerstand 1978), social equity (Palm and Pred 1978), urban
transportation (Lenntorp 1978), and regional differences (Martensson 1978).
To date, multiple spatial concepts have been developed based on the time-geographic
approach to describe the actual and potential individual activity engagement. Example
concepts include space-time path/prism (Burns 1979 ; Kim and Kwan 2003), potential path
area (Miller 1991; Kwan 1999), travel probability fields (Beckmann, Golob et al. 1983),
action/activity standard ellipse/circle (Zahavi 1979; Schonfelder and Axhausen 2003), and
minimum convex polygon containing activity locations (Buliung and Kanaroglou 2006;
Buliung and Kanaroglou 2006).
Another important research theme in activity studies is synoptic studies at the
spatially aggregate level. As Chapin (1974) argued, studying aggregate distributions of
activities in time and space can shed light on the impacts of different policy scenarios, as it is
the users of space that the planning and policy decisions intend to serve. With the explicit
recognition of cities as places or spatial events (Lynch 1976; Goodchild and Janelle 1984;
Batty 2003), researchers in the planning field have been increasingly considering the
than documenting all the individual interactions in time-space, the synoptic analysis of
spatiotemporal activity patterns uses a ‘census-like’ methodology (measures of central
tendency, frequency distribution, etc.) to describe population activity patterns at any time of
day at any level of spatial aggregation.
Chapin (1974) began with the individual-level choice model to study the human
activity patterns of the population aggregates, including the patterns of activity choice (what
kind of activities), the temporal patterns (when these activities take place), and the spatial
patterns (where these activities take place). Temporal patterns were examined using the
percentage of people engaging in each activity category by hour of the day. Spatial patterns
were examined using “mean locus,” which was defined as the sum of the linear distances
from a person’s home to every out-of-home activity location visited during a 24-hour period.
Many early studies (Hemmens 1970; Cullen 1975; Shapcott and Steadman 1978; Hanson and
Hanson 1980; Hanson and Hanson 1981) used similar methods to explore the temporal and
spatial patterns of daily activities and travel behavior. However, this early generation of
activity pattern analysis uses simple distance and duration measure that can not really capture
or visualize the complexity of human activity patterns in cities.
An important breakthrough in the synoptic analysis of spatiotemporal time activity
patterns was achieved by Taylor and Parkes (1975) who proposed a factorial-ecology
experiment using space-time units (STUs). They artificially created the activity location and
timing data of a typical working day in summer in a medium-sized British city. In terms of
activity space, the city was divided into ten districts based on the locational and
socio-economic variations. The 24 hours of the typical working day were divided up into eight
time, lunch time, and so on. Each of the ten geographic units was treated separated through
each of the eight periods, yielding a total of eighty STUs. A total of 22 census-like variables
were used to describe the urban ecology in each STU, including land use variables, social
and demographic characteristics of the population, and count measures of travel behavior in
each STU. Common factor analysis reduced the 22 variables to seven factors. The factor
scores of those seven factors in 80 STUs were then interpreted to better understand the
dynamic social geography in the hypothetical city through the day.
Taylor and Parkes’ hypothetical experiment has strongly motivated the subsequent
research design and empirical documentation of urban activity patterns using factorial
analysis. Goodchild and Janelle (1984) replicated and extended the factorial-ecology
experiment using the actual data based on the daily activity space-time survey in the
metropolitan area of Halifax, Canada. Besides using the factorial-ecology method to explore
the Halifax data, Janelle and Goodchild (1983) conducted another study which incorporated
the temporal dimension into simple spatial statistics. They calculated the location quotient,
the index of dissimilarity and the density gradient to monitor the geographical concentration,
segregation, and mobility for selected subpopulations and role groups in each spatial unit at
different times of the day.
Using advanced geo-visualization and geo-computation techniques, Kwan and Lee
(2004) explored the use of 3D activity density surfaces for representing and comparing
activity patterns of different population groups in the Portland metropolitan region. The
three dimensions of activity density surfaces are the time of day (X-axis), the distance of an
activity from home (Y-axis), and the activity density value (Z-axis). Activity density values
intensity of activities in space and time simultaneously, which facilitates the analysis of
space-time interactions. It also avoids the interpretative difficulties of conventional
quantitative methods in synoptically describing the spatiotemporal activity patterns.
The approach offered by the time-geographic model—coupled with recent advances
in GIS technologies and the available micro-level data, makes it more feasible than eve to
measure human activity patterns in space and time at both the individual level and the
aggregate levels. However, very few studies have incorporated activity patterns in examining
the land use effects on travel demand.
Early contributors in studying urban activity patterns (Chapin 1974) made limited
implications about the environment effects on human activity patterns by linking census
characteristics of sub-metropolitan communities with surveyed activity patterns in those
communities. The spatial factors included in recent activity studies are often simple measures
such as population/job density, metropolitan status, distance to CBD, number of shores
within certain distance (Bhat and Misra 1999; Yamamoto and Kitamura 1999; Ettema 2005;
Fan and Khattak 2006; Ye and Ram M. Pendyala 2006). At the individual level, the role of
the built environment in activity engagement has rarely been examined in a systematic way
and from both the spatial and temporal perspectives. In addition, recent advances in synoptic
activity pattern analysis have been focusing on visually presenting urban activity systems and
generalizing a totalizing master vision. At the spatially aggregate levels, few studies have
explored the linkages between the physical urban systems and the human activity systems.
This dissertation investigates the connection between the built environment and
activity patterns at both the spatially aggregate level and the individual level. Several
spatially aggregate level and the daily activity space measurement at the individual level.
New concepts of activity patterns were developed as well, including entropy measures of
diversity in activity types and activity population. To the author’s knowledge, the diversity
concepts in activity population have rarely been measured using entropy measures. However,
entropy measures are commonly used in many similar concept measurements (e.g. land use
diversity) (Cervero 2002; Song and Knaap 2004), which ensures the robustness of the
diversity measures of human activity patterns.
The Built Environment and Travel Behavior
Extensive research has demonstrated an association between the built environment
and travel behavior. However, very little is known regarding the causal links between the
built environment and travel behavior, and there is little agreement on how to reliably learn
more (Boarnet and Crane 2001). The remaining challenges involve the lack of a coherent
environment-behavior theory, the difficulty in measuring the built environment, and data and
methodology issues in modeling the linked choices such as where to live, where to travel,
when to travel, and how to travel. This section introduces supportive theories of the built
environment and travel connection, and provides a summary of the existing empirical
evidence.
Theoretical foundations
The theoretical bases of the environment-behavior interactions come from a variety of
theory of demand, expected utility theory, prospect theory, and the theory of planned
behavior.
The spatial interaction theory (Lakshmanan and Hansen 1965), mostly developed
based on ‘law of gravitation,’ explains the spatial interaction between two locations by the
attractiveness of those two locations and the distance between them. The theory indicates that
the choice of visiting a particular shopping center is determined by travel distance and the
attractiveness of the shopping center, which suggests a connection between urban
environments and activity engagement.
The theory of demand assumes that individuals make choices based on their
preferences over the goods in the consumption set, the relative costs of those goods and
available resources (Parkin 2004). As the travel cost of a certain mode decreases, the demand
for the mode will increase. As Boarnet and Crane (2001) argued, street grids, mixed land
uses, and inviting pedestrian neighborhoods are intended to change either the time cost of
traveling (e.g., by placing origins and destinations in more direct proximity) or the relative
cost across modes (e.g., by slowing auto travel and facilitating non-automobile alternatives).
Thus, the theory of demand suggests a connection between land use and travel.
Expected utility theory takes a different view from the theory of demand and suggests
that each choice offers a certain “utility” or value to the individual who seeks to maximize
his/her utility (Baron 2000). Anything that increases or decreases the utility of trip-making
will have impacts on travel behavior. For example, attractive neighborhood design and better
transit accessibility can increase the utility of walking and taking local bus.
At an operational level, discrete choice models (Domencich and McFadden 1976;
maximization framework to model travel behavior. However, there are limitations in using
utility maximization to represent underlying behavior processes that shape travel behavior
(Garling 1998). Utility maximization is concerned with identifying the best decision to take,
assuming a rational decision taker who is fully informed and able to compute with perfect
accuracy. In reality such ideal situations assumed by this model do not exist. People may use
principles other than utilities, and may use different principles in different circumstances.
Furthermore, personal values and preferences may changes over time and across different
situations. Recent research projects have seen more diversity in identifying decision making
factors. Examples include personal habits, preferences, neighborhood norms, etc.
While the models in economics are often normative models suggesting certain
similarity and homogeneity in decision making such as utility maximization, models in
psychology emphasize individual differences and behavior changes. For example, the theory
of planned behavior, developed by Icek Ajzen (1991) based on the traditional mainline of
social psychology, suggests three determinant factors of behavior as attitudes, subjective
norms, and perceived behavioral controls. Individual behavior tends to be consistent with
individual attitudes. Better perceived behavior control leads to higher behavioral performing
rate. The notion of “perceived control” is defined as “one’s perception of how easy or
difficult it is to perform their behavior” (Eagly and Chaiken 1993). This variable is
determined by personal beliefs about the likelihood that one has the necessary resources and
opportunities to perform his/her behavior. The inclusion of the perceived control in this
behavior model suggests the linkage between urban environments and individual travel
decisions. For example, pedestrian-friendly design and places with many pedestrians both
Although theories in psychology explains the role of individual attitudes/values and
social norms in decision-making process, at an operational level, it is difficult to generate
reliable measures for those constructs. Further, the revealed psychological connections are
complex and there has not yet been an operational model that can be implemented by
practicing planners and engineering. This research incorporates both theories in social
psychology and economic theories into developing the conceptual framework for the land use
and travel connection.
Empirical studies
Despite the fact that there has not yet been a coherent theory explaining the
connections between the built environment and travel decision-making, a tremendous amount
of empirical research on the subject has been developed and presented. The most common
means used to examining the land use-travel connections are simulations, descriptions, and
multivariate statistical analysis (Boarnet and Crane 2001). Several extensive literature
surveys are already available in the field of the built environment and travel behavior (Crane
1999; Badoe and Miller 2000; Ewing and Cervero 2001) as well as in the field of the built
environment and physical activity (Frank and Engelke 2001; Handy, Boarnet et al. 2002).
Four key dimensions can be derived from the existing research evidence and studies,
including transportation systems, land development patterns, micro-scale urban design and
regional structure.
In terms of transportation systems, gridlike and well-connected street networks with
smaller blocks and more intersections were found to be associated with decreased trip length,
Cervero 2001; Handy, Boarnet et al. 2002; Handy 2005). Sample measures of transportation
infrastructure include street connectivity (ratio of intersections or cul-de-sacs), directness of
routing, block size, transit performance, transit accessibility, and sidewalk continuity (Ewing
and Cervero 2001; Handy, Boarnet et al. 2002). Non-motorized travel and auto travel were
found to be related to different sets of environmental attributes. Street patterns have more
impacts on auto travel than alternative modes, while street design features such as block size,
intersection density, and street width have more effects on alternative mode travel such as
walking and biking.
In terms of land patterns, compact developments and mixed land use were found to be
associated with high walking and transit trip rates (Cervero and Radisch 1996; Handy and
Clifton 2001; Krizek 2003; Shay, Fan et al. 2006; Shay and Khattak 2007). Several studies
also show that the relationship between land use and mode choice may be non-linear (Frank
and Pivo 1994) and different land use elements have different effect size. Cervero (1996)
found that commercial services within neighborhoods better predict non-motorized trips than
residential uses.
Trip length (e.g., time or distance) is generally shorter at locations that are more
accessible, have higher densities, and have mixed land uses (Cervero and Wu 1997; Cervero
and Wu 1998). Existing evidence also shows that land use patterns, especially accessibilities
to activity centers, are significantly associated with mode choice and trip frequency (Ewing
and Cervero 2001; Shay, Fan et al. 2006; Khattak and Rodriguez 2005). Sample measures of
land use patterns include residential density, employment density, land use mix, accessibility
In terms of micro-scale urban design variables, pedestrian amenities such as
sidewalks, street trees, lightings, and benches in the neighborhood were found to promote
walking behavior (Handy, Boarnet et al. 2002). Parking spaces were found to create access
problems for pedestrians and transit users. In general, pedestrians and bicyclists are more
sensitive to micro-scale urban design features than are motorists.
Regional structure variables describe the overall structure of the metropolitan area,
such as centralization vs. decentralization and monocentric vs. polycentric. This regional
structure dimension closely relates to vehicle miles traveled (VMT), while it is much less
sensitive to walking and biking (Handy 1993; Ewing, Haliyur et al. 1994).
In terms of measurement techniques, recent research has been making progress in
applying statistical methods to describing the built environment, especially factor analysis
and cluster analysis. Factor analysis is increasingly used to combine all the underlying
environmental features into composite measures (Srinisvasan and Ferreira 1999; Rodriguez,
Young et al. 2006). Cluster analysis is able to reduce the multiple quantitative measures into
a neighborhood typology (Song and Knaap 2006). The distinctive neighborhood types
identified using cluster analysis can be used to examine the neighborhood effects on daily
activities and travel. The downside of factor analysis and cluster analysis is that the derived
factor scores and neighborhood clusters are much more difficult to interpret than direct
measures, which creates more difficulties in producing practical policy implications.
Both direct measures and composite measures of the built environment were used in
this dissertation. Direct measures include measures on the dimensions of land use density,
land use diversity, street patterns, and pedestrian facilities. Results on direct measures help
supportive places that encourage sustainable behavior. Composite measures were a set of
neighborhood cluster variables, which captures the collective effects involving multiple
environmental features on activities and travel.
Literature review also shows that few studies have taken an activity-based approach
to study the land use-travel connection. Most research did not distinguish trips of different
types or only focused on the journey to work. As commuting trips and non-work related trips
may respond differently to environmental factors (Frank and Pivo 1994; Meurs and Haaijer
2001), this dissertation incorporates the activity/trip context into modeling the land use and
travel connection and develops activity-specific models as well as mode-specific models
Summary
Large gap between activity modeling and land use-travel modeling
My review of the literature in activity pattern research and travel behavior research
shows a large gap between the activity modeling and the land use-travel modeling, which
suggests a justification for developing an activity-based framework in modeling the land
use-travel connection and linking systematic environmental measures to activity pattern measures
at both the census block group level and the 0.25-mile buffer area level at the home location.
Activity pattern measures include census block-level activity density and diversity measures
and individual-level daily activity space and daily time allocation.
Inconsistent environmental measures and limited geographic detail
There is little consensus in the operational definitions of the environmental concepts
(density, land use mix, etc), which make it difficult to generalize consistent results about the
alternative mode travel promoted by mixed uses, street grids, and compact developments
complement or substitute for existing trip that rely on motorized modes (Ewing and Cervero,
2001; Handy, 2006). On one hand, compact development patterns shorten trip distance and
make walking trips more appealing. On the other hand, compact development patterns may
increase auto mobility as well by providing better connected street systems.
In measuring the built environment and travel connection, scale does matter. Each
environmental feature can be measured in different ways at different scales. The same
environmental measure may generate different magnitudes of environment effects. Further,
most travel diary data are limited in their geographic detail and have no information on the
exact locations of trip destinations. The limited geographic information has restricted most
research from investigating the impact of land use patterns near trip origins and destinations.
The existing literature on land use and travel lays stress on residential environments. Those
issues above suggest that further research on the relationship between the built environment
and travel behavior is needed.
Few studies on other factors in urban environments than the built environment
Urban environments contain much more than the built environment. Many other
environmental elements relate to activity and travel decision making. Rodriguez and Joo
(2004) found local topography to be significantly associated with the attractiveness of
non-motorized modes. Theoretically, traffic congestion and adverse weather conditions suppress
travel demand. However, those environmental factors were rarely explored in the context of
land use and travel. This research incorporates variables of traffic conditions and weather
density was used as the proxy measure of traffic conditions. Indicators of weather conditions
CHAPTER III: Conceptual Framework
This chapter presents a conceptual framework for understanding how factors in urban
environments including the built environment may influence activity engagement and travel.
The conceptual framework is derived from two branches of theory: the body of literature on
environment-behavior interactions and the body of literature on individual decision-making.
The first section introduces a general environment-behavior model, which outlines possible
effects of urban environments on daily activity/travel decision making. The first section picks
the environment end of the interactions and detects all the possible decisions with which
urban environments can interfere. The second section takes a different perspective. It begins
with a subject-specific level and applies the theory of demand to investigate the built
environment-travel connection within a consumer demand framework. Built upon the
discussion in the previous sections, the final section offers a detailed conceptual framework
about how the built environment may influence travel. The final section also details the
hypotheses to be tested in the research and the expected results.
A General Environment-Behavior Model
In urban environments, places and people are two sides of the same coin: people
create, select, and transform places to perform their various activities, and at the same time
urban environments and human behavior includes both micro-level decision-making theories
and ecological models.
Figure 3-1 is a representation of the interplay between the urban environments and
human behavior. This model was developed based on Ajzen’s theory of planned behavior
(1991) and Chapin’s activity choice model in urban environments (1977). The individual
decision-making process positioned in the circle in Figure 3-1 is embedded within the
macro-level ecological model of environmental impacts.
Individuals make a series of decisions at different temporal scales, which are
categorized into three levels: strategic decisions, tactical decisions and routine decisions.
Strategic decisions are decisions that are most influential and important to an individual’s
life, and often come with radical changes such as job changing, family restructuring and
pursuit of education or training. Tactical decisions are the set of decisions subsequent to
strategic decisions. They are more frequent than strategic decisions and are directly
influenced by them. Examples of tactical decisions include changing home location, buying a
car, installing phone services, joining a club or group, etc. The purpose of tactical decisions
often involves facilitating daily living functions. The lowest level of individual decisions is
routine decisions such as shopping, commuting, meeting with friends, and so on. While
decisions at higher levels constrain decisions at lower levels, lower-level decisions may
affect higher-level decisions as well, but to a relatively small degree. Individual decisions at
all levels create the traffic flow and drive urban growth, which in turn have direct impacts on
both the built and social dimensions in urban environments.
In this general ecological model, variables of the built and other environments
constraints for individuals to perform their activity decisions. Traffic conditions and natural
environments act as another set of environmental constraints. Demographic and social
environments facilitate human interactions, as people gather, request, receive and exchange
information, which not only affects the human knowledge about choice sets but also shape
individual attitudes and preferences. Demographic and social environments impacts
individual decisions at multiple levels, including individual, interpersonal and community.
Interactions exist between the built environment and other environments.
Figure 3-1 A general environment-behavior model
The Theory of Demand
Boarnet and Crane (2001) presented a theory of consumer demand for travel
behavior. It holds that urban design strategies can change the absolute cost of trips as well as
the relative cost of traveling on different modes. Figure 3-2 illustrates how travel distance—a
determinant of the absolute trip cost—changes as land use patterns become more compact.
Geography Buildings Land use
Transportation system
Traffic conditions Natural environments Demographic environments Social environments Family, Education, Job
Location, mobility
Group bonding
Destinations, modes, routes
Social activities
BUILT ENVIRONMENT
OTHER ENVIRONMENTS INDIVIDUAL
Decision-Making
Urban Problems
Strategic
connectivity and fewer cul-de-sacs. By putting uses in close proximity to one another and
creating better street connectivity, compact development patterns shrink the distances
between potential trip origins and destinations. The relationship is often non-linear as the
amount of decrease in trip distance decreases as the travel environment becomes more
compact.
Figure 3-2 Changes in travel distance by land use patterns
As discussed by Boarnet and Crane (2001), urban design not only may reduce the
distance of traveling by all modes, but also may change the relative cost of traveling across
modes. For example, while heavy traffic, low speed limits, and more intersections associated
with compact development patterns often have strongly negative impact on auto travel speed,
travel speeds of alternative transportation modes such as walking, bicycling, and transit may
not change much across different land use patterns. In addition to influencing the time cost of
traveling differently depending on the travel mode, land use patterns can also alter the
relative psychological cost of travel. With more aesthetically oriented design elements, such
as plazas and streetscapes, compact development pattern can make walking trips more
pleasing.
Travel Distance
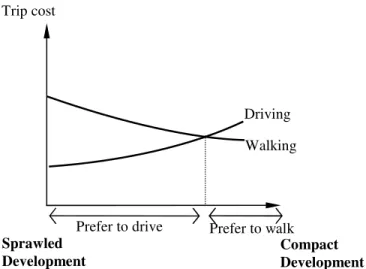
Thus, if we hold travel distance constant, we would expect that trip cost changes with
the built environment. Compact development patterns are expected to lower walking trip
cost, and to increase driving trip cost. Figure 3-3 illustrates when trip distance is held
constant, how land use patterns can change the relative attractiveness of driving versus
walking by influencing trip cost.
Figure 3-3 Changes in driving and walking trip cost by land use patterns
Based on the discussion above, two mechanisms underlying the land use-travel
connection can be identified. One is that compact development patterns that incorporate
dense developments, mixed land uses, and street grids may shorten the distance of non-work
related trips. Another is that compact development may decrease the cost of walking trips but
may increase the cost of driving trips after controlling for trip distance. Among the many
elements of travel cost, this dissertation places emphasis on the time cost of travel. Travel
distance and duration are outcome variables in this dissertation.
Driving
Walking Trip cost
Sprawled Development
Compact Development
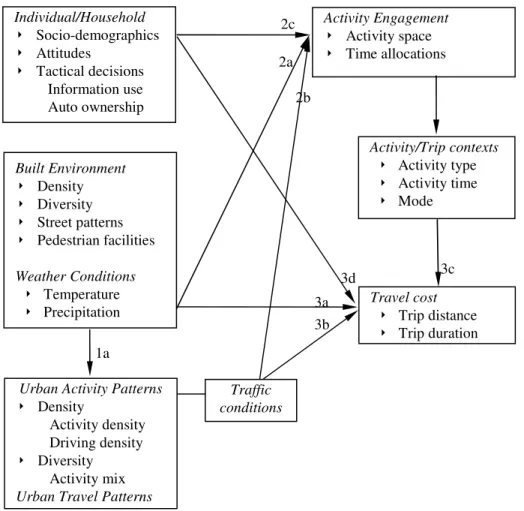
How the Built Environment May Influence Activity Engagement and Travel
Based on the theoretical bases offered by the previous two sections, Figure 3-4
portrays how the built environment can influence human activity patterns in urban spaces
(Link 1a), how factors in urban environments including the built environment, weather
conditions, and traffic conditions influence activity engagement and travel at the individual
level (Links 2a and 2b), and how factors in urban environments coupled with activity
contexts influence trip distance and duration at the trip level (Links 2a, 2b, and 2c).
Figure 3-4 How the built environment may influence activity engagement and travel Activity Engagement Activity space Time allocations Individual/Household Socio-demographics Attitudes Tactical decisions Information use Auto ownership
Urban Activity Patterns
Density
Activity density Driving density
Diversity Activity mix Urban Travel Patterns
3a Travel cost
Trip distance Trip duration Built Environment Density Diversity Street patterns Pedestrian facilities Weather Conditions Temperature Precipitation Activity/Trip contexts Activity type Activity time Mode 1a 2a 2c
3d 3c
3b 2b
Links 1a in the Figure 3-4 shows that the built environment may influence human
activity patterns at the spatially aggregate level. This link was examined by the census block
group level activity pattern analysis in Chapter V.
Links 2a, 2b, and 2c in Figure 3-4 display the personal and situational factors of daily
activity engagement at the individual level. Links 2a and 2b show that the built environment,
urban activity patterns, and weather conditions may have effects on daily activity
engagement, as those environments form a backcloth against which people live their daily
lives and make various activity decisions. For link 2b, driving activity density, an activity
pattern indicator, captures the effect of traffic conditions on daily activity and travel time
allocations. Link 2c indicates that daily activity engagement is influence by individual and
household socio-demographics, attitudes and values, and tactical decisions that the individual
made to facilitate his/her daily living functions. This research utilizes the socio-demographic
factors (gender, income, household size, etc.) as proxy variables of individual biological
needs. Mobility tools such as auto ownership and information access were included to
represent individuals’ tactical decisions. Factors considered in individuals’ home location
choices (such as length of commute and access to transit) were used as the proxy variables of
travel preferences and attitudes. Links 2a, 2b, and 2c were examined by the individual-level
activity space and time allocation analysis in Chapter VI.
Links 3a, 3b, 3c, and 3d respectively show that the four explanatory factors of trip
distance and duration in this research are the built environment at the trip origin and
destination, urban activity patterns (mainly traffic conditions measured by driving activity
density), activity/trip characteristics, and individual/household factors. Through link 3c, this
decisions include in what activities to engage, when to participate, and how to travel. The
strength of the environment effects on trip distance and duration may vary by activity and
trip characteristics. This research will investigate links 3a-3d at the trip level in Chapter VII.
The discussion above suggests three sets of key hypotheses to be tested at different
geographic levels using different units of analysis. The first set of hypotheses is about the
relationship between the built environment and human activity patterns at the census block
group level. The second set of hypotheses is about how environmental factors including the
built environment near the residential location, traffic conditions near the residential location,
and weather conditions are associated with daily activity engagement at the individual level.
The third set of hypotheses is about how environmental factors at the trip origin and/or the
destination are associated with trip distance and duration at the trip level. In the following
text, I detail each set of hypotheses to be tested in this research.
Hypothesis set # 1(shown in Table 3-1)
At the block group level, built environment factors are significantly associated with
human activity patterns in urban spaces. The planning and design of the built environment
are concerned with organizing people in space by making physical representations of social
relations (Herbert and Thomas 1997). The concept of urban planning itself, with its concerns
about the production of urban places and the reflection of social values, offers a link between
the built environment and the patterns of urban activity systems. In addition, spatial models
of human behavior provide additional theoretical foundations to the relationship between the
systems of urban services and the spatial patterns of human behavior. For example, central