Portable Calorimeter for Fire Experiments
FDR Report
Presented by:
Kara Hewson: [email protected] Chris Chen: [email protected] Kayla Collins: [email protected]
Joel Keddie: [email protected]
Mechanical Engineering Department California Polytechnic State University
San Luis Obispo Spring 2020
Prepared For:
Professor Richard Emberley California Polytechnic State University
1
Statement of Disclaimer
2
Executive Summary
An oxygen consumption calorimeter works by measuring the heat release rate of a burning substance. This value is calculated by measuring the oxygen and byproducts in smoke from a fire. In order to get these values two types of sensors were used. A non-dispersive infrared sensor (NDIR) that measured CO and CO2 and a zirconium O2 sensor were used to find their
respective gas concentrations. The design to calculate the heat release rate is focused on
maximizing sensor accuracy and portability while simplifying the manufacturing by using off the shelf components. The goal included making the system simple to recreate and package in a portable system.
Multiple designs were considered to ensure that the system would be portable. The final design is focused on working around the Crestline 7911 NDIR sensor and AO2 Citacel sensor. The other key components include the microcontroller, pump, power supply, air filter, and mounting platform, which were designed around these two sensors. These components are packaged together in a briefcase that will house the components and protect them during transportation and usage. This flexibility for transportation allows the system to be used in different locations. The oxygen consumption calorimeter also has several specific design specifications that it will meet. These fall under three categories: safety, usability, and data acquisition. Safety
considerations involve ensuring that the system is not exposed to excessive heat, well insulated, does not deflect or fracture, etc. To ensure the usability of the device, the engineering team will record issues and the appropriate solutions for hardware and software issues to establish a working guideline for future users. Another key specification category is data acquisition. It is important for the system accurately acquire data and that the system is calibrated properly. This document will serve as the scope of work and as a design report for the mechanical engineering team working on the Portable Calorimeter for Fire Experiments project. The
3
Table of Contents
1. Introduction ... 5
2. Background ... 6
2.1 Overview and Types of Calorimeters ... 6
2.2 Patents ... 7
2.3 Sensors ... 8
2.4 Calculating Heat Release Rate ... 9
3. Objectives ... 10
3.1 Problem Statement ... 10
3.2 Needs and Wants... 10
3.3 Boundary Diagram ... 10
3.4 Quality Function Deployment (QFD) ... 11
3.5 Risk Assessment ... 13
3.6 Stretch Goal ... 13
4. Concept Design ... 15
4.1 Decision Process ... 15
4.2 Selected Concept ... 16
4.3 Pump Analysis ... 17
4.4 Sensor Comparison ... 18
4.5 Current Risks ... 19
5. Final Design ... 20
5.1 Final Selected Design ... 20
5.2 Material and Part Selection Justification ... 23
5.3 Safety, Maintenance, and Repair Considerations ... 26
5.4 Cost Analysis Summary ... 27
6. Manufacturing ... 28
6.1 Material Procurement... 28
6.2 Mounting Platform ... 28
6.3 Tubing Network ... 30
6.4 Fume hood Duct Fittings ... 32
6.5 Wiring the System... 32
6.6 Assembly Plan ... 34
6.7 Coding Plan ... 34
4
7.1 Safety: ... 37
7.2 Usability: ... 38
7.3 Data Acquisition: ... 38
7.4 Results: ... 39
7.5 Future Tests ... 40
8. Project Management ... 41
8.1 The Design Process and Deadlines ... 41
8.2 Special Techniques for Solving the Problem ... 42
9. Conclusion ... 43
9.1 Next Steps ... 43
9.2 Project Summary and Reflection ... 44
References ... 45
Appendices
5
1. Introduction
The purpose of this project is to build a portable oxygen consumption calorimeter that can be used on any smoke collection system to analyze the oxygen consumption in order to calculate the heat release rate of the substance being burned. This project is sponsored by Professor Richard Emberley and will be mainly used in the Cal Poly Combustion Lab. The team working on this project consists of Kayla Collins, Joel Keddie, Christopher Chen, and Kara Hewson. This document will cover the design process from the background research to the implementation of the solution.
6
2. Background
In order to understand the project goals, background research was conducted to fully understand the scope of the project. A meeting was conducted with the entire team and Dr. Richard Emberley to discuss the scope of the project. The team then investigated similar existing products, patents, standards, journal articles, case studies, and reports to give the team a basic foundational knowledge and ultimately guide the design of the product.
2.1 Overview and Types of Calorimeters
Calorimetry is the measurement of heat transfer either in or out of a system (Redfern). In the case of fire testing, there are multiple types of calorimeters that are used. The two most common calorimeters are cone calorimeters and bomb calorimeters. Cone calorimeters use used by putting a small sample in the cone of the calorimeter and putting it under a constant heat flux. This induces a fire in the sample from which it is possible to collect soot and measure the gases that are released during combustion. These gases can be used to determine the heat transfer rate of the combustion reaction (Redfern). Bomb calorimeters are a constant volume device. The calorimeters take small samples to be burned. Because of the constant volume property, the sample that is burned releases its energy in heat and not as work (Lyon). A thermometer is used to measure the change in temperature in the water; and with the bomb factor rating of the calorimeter the heating release rate can be determined. Both calorimeters can find the heat transfer rate of a sample; however, their limitation is that the samples they can test are too small for practical fire testing.
Another type of calorimeter, which is less commonly known, is the oxygen consumption calorimeter. This is what the team will be focusing on designing for this project. The oxygen
Figure 2: Bomb Calorimeter (Orbit Technologies)
7
consumption calorimeter was developed in that late 1970’s and was refined over the years by several people. Notable researchers were Dr. William Parker and the late Dr Clayton Huggett (Beyler). This type of calorimeter was designed to be able to measure the rate of heat release of a system through oxygen consumption (Beyler). The instrument can measure the amount of oxygen combusted by taking in the by-products of the combustion. By measuring the percentage of the other molecular groups in the smoke using Non-Dispersive Infrared Ray (NDIR) sensors it is possible to get the amount of oxygen consumed in the fire (Seitz). Because the amount of energy that oxygen releases when it combusts with fuels stays constant under most conditions, the calculated heat release rate is constant based on the fuel. This information has had a large impact on public safety. The data obtained from oxygen consumption calorimeters allowed researches to have a more accurate method of determining the heat released in a fire (Beyler). The oxygen consumption calorimeter became widely used for fire testing, research, and was used to help create standardized fire test methods.
The oxygen consumption calorimeter is made up of several components that must be integrated together with software for it work properly. There are several types of sensors that are involved in its construction. These sensors include the NDIR sensor that will monitor both CO2 and CO and
an O2 analyzer. These sensors output their data to a Data Acquisition System (DAQ) that will
collect and store the data. A micro controller that has been coded to calculate the heat transfer rate will take the data from the DAQ and plot it as a function of time. The graph is then output to a computer so those using the device can see how the heat transfer rate fluctuates over time (Dlugogorski).
2.2 Patents
Though oxygen consumption calorimetry is an established method of calculating the heat release rate of various materials, there aren’t many products that are quite like the device this project requires. There are other types of calorimeters such as bomb calorimeters, cone calorimeters, and fire calorimeters (similar to the device being asked for, but not portable). There are also products that achieve the same goal as the device being asked for but are only for certain materials (like polymers) or for a very specific scale (extremely small or extremely large). Table 1 below summarizes differences between some of these products. The first patent listed is the device that most closely addresses the needs proposed by this project, however it is only meant for
8
Table 1: Summary of Related Patents
Patent Product Strengths Weaknesses Cite
Heat Release Rate for Milligram Samples
Measures heat release rate by oxygen consumption, without
measuring mass loss
• Only for very small samples (~ 10
milligrams) • Sample burned
within a chamber
A1
Method for Measuring Heat Release of Polymeric
Compounds
Similar method to
product #1 Only for polymers
A2
Coal Calorimetry System Utilizes an online interface
Specifically, for combustion of coal
A3
Bomb Type Calorimeter
• Very compact and portable • Accurately measures
heat release rate
Not compatible with fume hood combustion
experiments
A4
Cone Calorimeter
Utilizes same sensors that will be needed for
our product
Not compact/portable A5
2.3 Sensors
There are two types of sensors that are essential for oxygen consumption calorimeter analysis, an oxygen sensor and a carbon dioxide sensor. The oxygen sensor measures the percentage of oxygen gas in the inlet smoke using a variety of methods, including electrochemical, infrared, and laser technology. The most common oxygen sensor uses a zirconia ceramic coated bulb that converts the amount of oxygen in the exhaust of the fire to a voltage output. The voltage can then be sent to the data acquisition device, where it is compared to the percentage of oxygen in the surroundings (Izu). For the zirconia sensor, the output voltage is not linear, meaning that it works best around standard temperature and pressure. The most sensitive probe at low oxygen concentrations is an oxygen optode, which uses an optical tip focused on a piece of chemical film. The sensor analyzes the fluorescent properties of the film in the presence of oxygen and works best at low concentrations of oxygen (Johnson). A laser reader would be more accurate, as it uses a spectrometer to analyze the amount of oxygen, but the oxygen reader is a large economic investment (Hangauer). However, after a discussion with Dr. Emberley, the industry standard for an oxygen sensor appears to be an electrical sensor, which can read oxygen levels throughout the stochiometric spectrum and is affordable.
The carbon dioxide sensor uses a Non-Dispersive Infrared Ray (NDIR) which measures the amount of CO2 in the sample using an infrared gas sensor. The sensor uses a wavelength
spectrometer with the NDIR to measure the amount of CO2 molecules in the system. This is done
using the known absorptivity of the CO2 and spectroscopy to filter the other molecules that are
9
2.4 Calculating Heat Release Rate
Heat release rate evaluation is a major consideration in any fire risk assessment procedure (Parker). The oxygen consumption calorimetry is based on Thornton’s rule that states that the heat release is approximately proportional to oxygen consumption for complete combustion of most liquids and gasses. Hugget proved in 1980 that Thornton’s rule also applies to solids (Brobez).
The equations for measuring the rate of heat release by oxygen consumption are already developed and are accurate to most applications within ±5%. A few key notes are that all of combustion products are collected and removed through an exhaust duct and the composition of the gases are measured once adequate mixing has occurred downstream (Janssens).
There are a few main assumptions that are made in the analysis to get the rate of heat release, 𝑞 ̇. The amount of energy released by complete combustion per unit mass of oxygen consumed is taken as a constant of 13.1 MJ*kg-1 of O2 (Huggett). All gases are considered to behave as ideal
gases, e.g., one mole of any gas is assumed to occupy a constant volume at the same pressure and temperature. Incoming air consists of O2, CO2, H2O, and N2. Lastly, O2, CO2. And CO are
measured on a dry basis, i.e., water vapor is removed from the sample before gas measurements are made (Janssens).
The governing equation for the rate of heat release is given by:
[1] 𝑞 ̇ = [𝐸𝜙 − (𝐸𝐶𝑂 − 𝐸)
1 − 𝜙 2
𝑋𝐶𝑂𝐴 𝑋𝑂𝐴2]
𝑚̇𝑒 1 + 𝜙(𝛼 − 1)
𝑀𝑂2 𝑀𝑜
(1 − 𝑋𝐻𝑂2𝑂)𝑋𝑂𝐴2𝑜 (Janssens)
where,
𝑞 ̇ = Rate of heat release (kW) 𝜙 = Oxygen depletion factor
𝐸𝐶𝑂 = Net heat release per unit of O2 consumed for combustion of CO to CO2
(≈ 17.6 MJ/kg of O2)
𝑋𝐶𝑂𝐴 = Mole fraction of CO in the analyzer 𝑋𝑂𝐴2 = Mole fraction of O2 in the analyzer
𝑚̇𝑒 = Mass flow rate in the duct (kg/s)
𝛼 = Ratio of two aforementioned molar quantities (= 1.105) 𝑀𝑂2 = Molecular weight of oxygen (≈ 32 kg/kmol)
𝑀𝑜 = Molecular weight of the incoming air (kg/kmol) 𝑋𝐻𝑂2𝑂 = Mole fraction of H2O in the incoming air
𝑋𝑂
2
𝐴𝑜
10
3. Objectives
This section will discuss the problem statement, wants and needs of the customer, boundary diagram, Quality Function Deployment, risk assessment, and stretch goal. This section can be used to ensure that the final product achieves the function desired by the client.
3.1 Problem Statement
Dr. Emberley and the students of the fire engineering lab need a portable oxygen consumption calorimeter to measure the heat rate of a burning substance both inside and outside of the fire engineering lab. Currently, oxygen consumption calorimeters are immobile due to their size and very expensive. The samples must be brought into the lab and cannot be conducted out in the field. Dr. Richard Emberley wants to open the market by bringing costs down and by allowing the oxygen consumption calorimeter to be able to be brought out to the field. A stretch goal of the project is to improve the existing fume hood in the lab by constructing a hood with a shape that will allow as much smoke as possible to be collected from samples being burned.
3.2 Needs and Wants
The needs and wants of the customers include a working prototype, a graphical user interface, compatibility with other apparatuses, functionality, thorough documentation, cost under $3000, portability, easy to use, low maintenance, safe, durable, precise, and accurate.
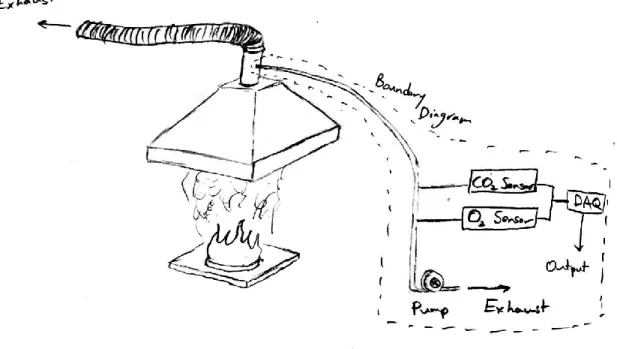
3.3 Boundary Diagram
11
Figure 3: Project Scope Boundary Diagram
3.4 Quality Function Deployment (QFD)
Quality Function Deployment (QFD) is a way to define a problem based on a House of Quality diagram, which is shown in Appendix B. This helps guarantee that the correct problem is being solved and that the specifications are correct. The House of Quality contains a Who, How, Now, What, and How Much sections and the interactions between them. The Who section lists the customers who will benefit from this product: Dr. Richard Emberley, students, and researchers. The What section is a list of the customer wants and needs. The wants and needs of these customers are weighted so that it becomes clear which requirements are most important to the customer. Then, the competitors are listed to better understand the competitive advantage and product improvement the team can make. The How section contains a list of engineering specifications that are measurable and verifiable. The customers need and wants are then related to these engineering specifications based on how strong of a relation they have. The How Much section lists the numbers and units of the engineering specifications.
Table 2 shows our engineering specifications (how), our targets (how much), tolerance of our acceptable variation from the target, risk of how challenging it will be to meet each specification, and compliance of how the team will meet each specification. In the compliance section T refers to Test, A refers to Analysis, I refer to Inspection, and S refers to Similarity.
12 Spec.
#
Specification Description
Requirement or Target (units)
Tolerance Risk Compliance
1
Smoke Extraction System
flowrate between 0.5 liters/min and 1.5 liters/min
Max
M T
2 Dimensions 24 in long by 24 in wide
by 12 in tall Max
L I
3 Heat Release
Values Less than 5% difference Max
H I
4 User Testing
Survey 4 out of 5 Min
L T
5 Thermal Analysis
Calculated results match
experimental +/- 5% Max
M T, I 6 Software Testing Delay of 10 seconds Max H T, I, S 7
Testing with other lab devices or apparatuses
Compatible with other
devices in the lab Pass
M T
8 Travel Testing
Able to withstand
impacts and bumps (from travel)
Pass
M T
9 Structural Integrity Factor
Deflection of 3inches
under 50lbs load Max
L A, I
10 Weight 20 lbs Max L I
11 Electrical Wiring Safety
No shorts, wires are
properly insulated Pass
L I, T
12 Heat Exposure
Tubing is safe to touch, and components are under allowable temperatures
Pass
M I, T
The engineering specifications and how they will be measured are:
1. Flowrate of the extracted smoke will be measured with a flowmeter to ensure the correct flowrate for the CO/CO2 sensor.
2. Dimensions, which will be measured using a tape measurer.
3. The accuracy of the calorimeter will be compared with known heat release values. Specific materials with known heat release values will be burned, the heat release value will be calculated with the team’s device, and then this value will be compared with the known values. This will allow for calibration of the calorimeter and demonstrates what sort of accuracy the calorimeter can achieve.
4. User testing surveys, which will have 2-4 users testing certain aspects of the portable calorimeter to then give feedback on improvements they can make with the user interface, software, operation of the calorimeter, and more.
13
6. Software testing will be verified whether the code does what it is supposed to do or not such as having real-time display, working emergency stop, etc.
7. Testing with other lab devices or apparatuses will be verified whether the calorimeter works with the other equipment in the lab.
8. Weather condition/travel testing of the calorimeter will be tested by comparing the heat release values in various weather conditions such as high humidity, 90°F or above, and 30°F or below, to the calibrated state and then seeing how much it deviates.
9. Structural integrity will be hand calculated to ensure the device can handle impact and vibrational loads.
10. The device’s weight will be measured on a scale.
11. The electrical system will be visually inspected and tested with a multimeter to ensure everything is connected correctly.
12. The temperature of the sensor will be measured with thermocouples to ensure that it is within its acceptable limits.
3.5 Risk Assessment
The software testing is the highest risk specification. First, the team does not have any experience coding in C++. Hence, setting up the drivers for the sensors, collecting the data, and then displaying the code on a Graphical User Interface (GUI) will be challenging, especially when integrating all this together. The second most challenging risk specification is to compare with known heat release rate values in order to calibrate the device. This will be difficult as the values need to be accurate and will take a lot of time to calculate.
3.6 Stretch Goal
If time permits, Dr. Richard Emberley would like a new fume hood for the oxygen consumption calorimeter in the Combustion Lab at Cal Poly, which is shown in Figure 4. The current design does not collect all the CO2, O2, and CO molecules off the burning substance. The fume hood is
14
Figure 4: Oxygen Consumption Calorimeter in the Combustion Lab
15
4. Concept Design
The final concept design was chosen using decision-making tools such as decision matrices. The nature of the project means that the driving factors behind the design are the available sensors and pumps, as well as the need for the calorimeter to be portable. The concept development process is outlined below.
4.1 Decision Process
The first part of the decision process consisted of developing ideas through brainstorming. Three different ideation sessions were held for the functions: user friendly, portable, and air extraction. The ideas generated from these sessions are attached in Appendix D.
For the ‘user friendly’ function, some ideas consisted of: clear code commenting, instructional videos and pictures, list of components and how they interface with one another, a search/help button integrated onto the GUI, datasheets easily accessible, buttons, a nice font, soft colors, and more. Then different ways the oxygen consumption calorimeter could be portable were thought of - including giving it handles, the ability to roll, having the option of being connected to a power supply or an outlet, developing an app that is compatible with a phone, laptop, or tablet, and lots more. The air extraction ideation included using a fan, a pump, increasing the flow of the duct system, and more, which can be found in Appendix D.
After this ideation phase, each component was researched – oxygen sensor, carbon dioxide and carbon monoxide sensor, pumps, and coding languages for developing a GUI - and for each component, a decision matrix was created, which is attached in Appendix E.
An integrated sensor that measures oxygen, carbon dioxide, and carbon monoxide was chosen. However, this option is very expensive so if adequate funding is not achieved, an individual sensor for each molecule will be used. The integrated sensor is further discussed in Section 4.4 Sensor Comparison.
The most inexpensive option for their pump was chosen, since it is also the smallest and lightest, making it extremely portable. If greater funding becomes available, a stronger pump may be considered depending on the required flowrate for the sensors. The second pump will be tested to get a sense of how powerful the most inexpensive pump option is.
16
4.2 Selected Concept
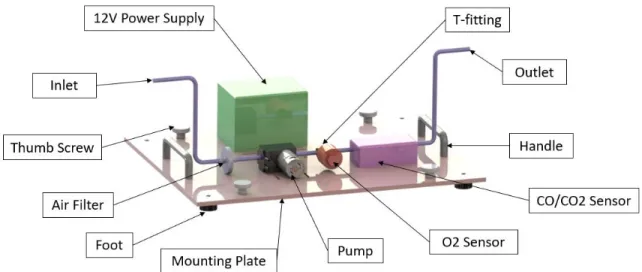
The final product will consist of a pump that extracts the smoke from the fume hood through the inlet on the hose, a sensor that taps into the hose to read the amount of oxygen, carbon dioxide, and carbon monoxide in the line, an Arduino to collect the data from the sensors, a power supply to power the Arduino and sensor, and an outlet where the smoke can go back into the exhaust pipe connected to the fume hood. A computer will be hooked up to the Arduino, which will display the data being collected. An isometric view of the system is shown in Figure 5.
Figure 5: Isometric view of the portable oxygen calorimeter CAD concept.
17
Figure 6: Concept Prototype
4.3 Pump Analysis
For the calorimeter to work, it was necessary for the smoke to be extracted from the fume duct in order for it to be analyzed by the sensors. Many options were considered to perform this function, as shown in Appendix D, but ultimately a pump was chosen as the most practical option.
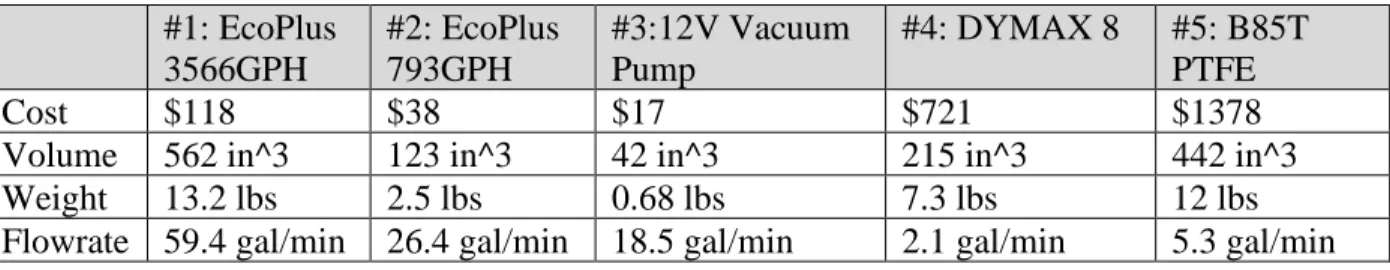
Once it was decided that a pump would be used, the team needed to decide which pump would be best for the system. There were several pumps taken into consideration of various sizes and price points. The characteristics of each of these pumps is shown below in Table 3. The characteristics of each pump that were considered were cost, volume, weight, and flowrate. The cost is important because the team would like to remain within their allocated budget. Volume and weight show the relative size of the pump which will affect the portability of the system. Additionally, maximum flowrate of each pump matters because the system needs to be able to in draw enough air for the sensors, but not so much that the sensors can’t analyze the incoming air.
Table 3: Pump Comparison #1: EcoPlus
3566GPH
#2: EcoPlus 793GPH
#3:12V Vacuum Pump
#4: DYMAX 8 #5: B85T PTFE
Cost $118 $38 $17 $721 $1378
Volume 562 in^3 123 in^3 42 in^3 215 in^3 442 in^3
Weight 13.2 lbs 2.5 lbs 0.68 lbs 7.3 lbs 12 lbs
18
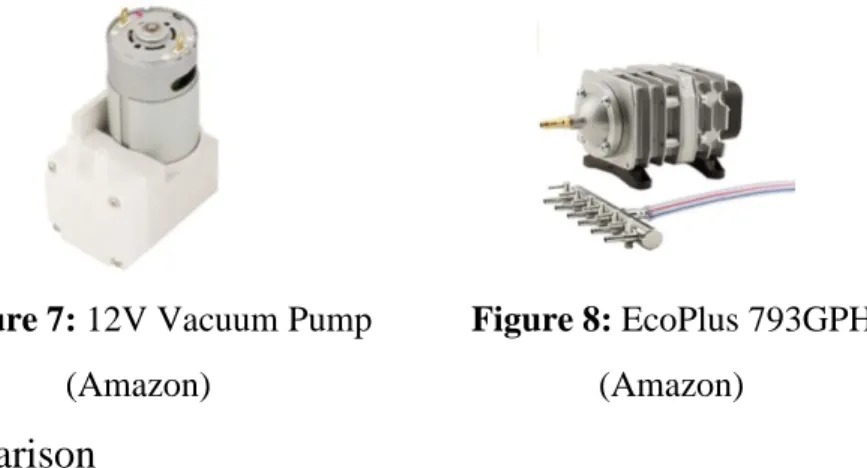
After placing these pumps into a decision matrix, which can be found in Appendix E, the top choice ended up being the 12V vacuum pump (#3) due to it being the smallest, lightest, and cheapest. This pump is shown in Figure 7. At the start of the project, the ideal flowrate for the system was unknown because it was dependent on the requirements of the sensors and resistance caused by air filters. As of CDR, the necessary flowrate dictated by the CO/CO2 sensor was determined to be 0.132 - 0.396 gal/min, with a lower flowrate allowing for more accurate readings. However, with the addition of an air filter creating resistance to flow, the pump would need a high enough flowrate to overcome this. Two pumps were the purchased for testing purposes since they both had low costs but did not provide pump curves for proper analysis. These pumps were the 12V Vacuum Pump and the EcoPlus 793GPH (#2). The EcoPlus 793GPH pump is less ideal since it is slightly larger and would require a larger briefcase for packaging but can provide a higher flowrate. If it is determined that a lower flowrate is needed than either of these pumps can provide, a flow regulator will be added into the system.
Figure 7: 12V Vacuum Pump Figure 8: EcoPlus 793GPH (Amazon) (Amazon)
4.4 Sensor Comparison
For this project it was imperative that the group compared the available types of sensors on the market. There are multiple sensors that could function for the calorimeter, but not all of them are compatible with each other or the system that the team is planning on using.
For both CO2 and CO monitoring, the plan is to use a NDIR type sensor. There are the industry
19
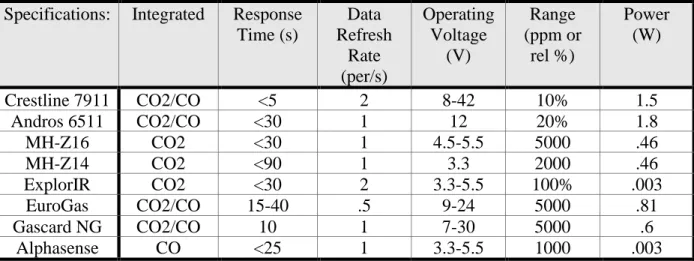
Table 4. Comparisons Between Sensors Specifications: Integrated Response
Time (s)
Data Refresh
Rate (per/s)
Operating Voltage
(V)
Range (ppm or
rel %)
Power (W)
Crestline 7911 CO2/CO <5 2 8-42 10% 1.5
Andros 6511 CO2/CO <30 1 12 20% 1.8
MH-Z16 CO2 <30 1 4.5-5.5 5000 .46
MH-Z14 CO2 <90 1 3.3 2000 .46
ExplorIR CO2 <30 2 3.3-5.5 100% .003
EuroGas CO2/CO 15-40 .5 9-24 5000 .81
Gascard NG CO2/CO 10 1 7-30 5000 .6
Alphasense CO <25 1 3.3-5.5 1000 .003
One of the key differences between sensors is that there are integrated sensors and individual sensors. Most of the industry grade CO2 and CO sensors are integrated sensors and can measure both gases. This is the type of sensor that has been heavily recommended by Dr. Emberley. These types of sensors such as the Crestline model and the Andros model are precise with their measurements.
The O2 sensor will be an AO2 CiTicel sensor, which covers the correct range and is inexpensive as an individual sensor. The decision matrix in Appendix E covers the alternative sensors for detecting oxygen in the system, but the AO2 sensor is the cheapest that fulfills all the requirements.
4.5 Current Risks
20
5. Final Design
This section discusses the final design of the calorimeter. It also considers the safety, maintenance, repair considerations; discusses why specific parts and materials were chosen; and summarizes the cost analysis associated with the final design.
5.1 Final Selected Design
The final selected design for our portable oxygen consumption calorimeter focuses on maximizing portability and sensor accuracy. The device will be composed of several key components; these include a pump, air filter, and gas analyzing sensors for O2 and CO/CO2. All the sensor
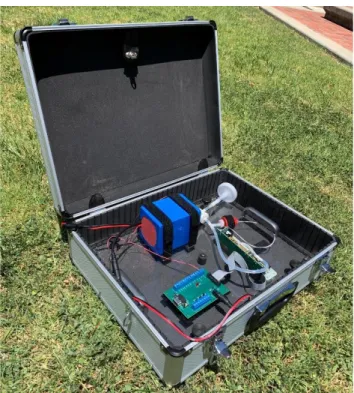
components will be mounted on top of an acrylic board as seen in Figure 9 below. The tubing will be secured in place with routing clamps as needed and the process for mounting these is discussed in the manufacturing section. The device will be mounted inside an aluminum briefcase, which can be seen in the isometric view of the final built assembly in Figure 10.
The device also has handles to make it easier to pick up the device, feet to keep the device level, and thumb screws that allow the user to lock the mounting plate into the briefcase. These components can also be seen in Figure 9.
21
Figure 10. Isometric View of the Final Assembly
The CO/CO2 sensor has a breakout board with a microcontroller that uses an RS232 to USB connector to send the data collected from the sensor to a computer. A picture of the device connected to a computer is shown in Figure 11.
22
The system’s function is to take in smoke and gas from a fume hood that it is hooked up to. The pump pulls gas through the system at a flowrate between 0.5 and 1 L/m. The smoke is pulled through a 0.3-micron filter and pumped to the two sensor components. The oxygen sensor measures the concentration of oxygen in the smoke extraction line. The CO2/CO NDIR sensor
measures their respective gas concentrations. After the smoke’s gas concentrations are measured, the exhaust smoke is pumped back into the fume hood as shown in Figure 12. The outlet line is above the inlet line in the bulkhead fittings to avoid analyzing the same smoke twice.
Figure 12. Exhaust Connection
A 12 V power supply powers the pump and CO/CO2 sensor. This power supply can last up to 14 hours, allowing a user to run multiple tests out in the field before having to recharge. The oxygen sensor gets its power from the breakout board from the CO/CO2 sensor. The CO/CO2 sensor connects to a computer to transmit its data. The diagram for how the sensors and computer will be wired together is attached in Appendix I.
23
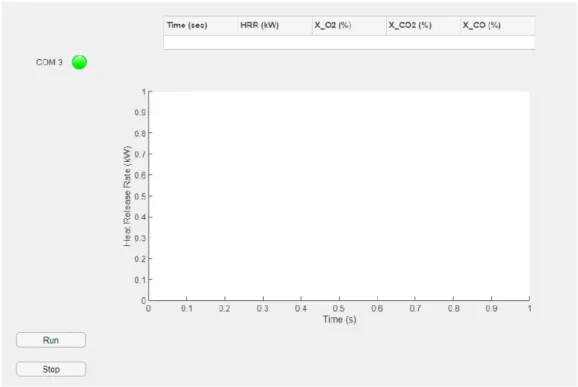
Figure 13. GUI Display for Portable Oxygen Consumption Calorimeter
The MATLAB GUI displays the data and the CO/CO2 sensor’s software, which is called the Crestline software. The Crestline software reads the concentration data coming from the CO/CO2 and O2 sensors and exports the recorded data as a text file. This text file is read by the MATLAB program. The Crestline software must be running in order for the MATLAB program to be able to read the text file and plot data. The team tried to integrate the two programs together, but they were unable to get the MATLAB to send commands to the Crestline software. The specifics on how to operate the portable oxygen consumption calorimeter is outlined in the Operator’s Manual as seen in Appendix Q. This manual outlines the process for connecting the tubing and wires correctly as well as how to set-up and run the software. The Operator’s Manual also details how to run the software to do the calibration testing for the sensors.
5.2 Material and Part Selection Justification
5.2.1 Briefcase
24
Table 5. Comparison of Briefcase Materials
Material Weight
(lbs)
Young’s Modulus (GPa)
Fracture Toughness (MPa/m^2)
Cost (USD)
Aluminum 8.2 68 33 38.99
Leather 7.72 .3 4 114.99
PC+PBT(20% GF) 4.49 5.1 4.85 99.00
Although Aluminum is the heaviest material, it has the highest elastic modulus and fracture toughness. It is important that the case must not deform under heavy pressures as it could possibly damage the components inside. Aluminum is rigid enough to support the components in the case and is stiff enough to resist most bumping that may happen during travel.
5.2.2 Mounting Platform
The mounting platform for attaching all of the major components to is made of acrylic. Acrylic provides a stiff base that is resistant to the environment. Compared to the other platform materials that were considered such as steel, aluminum, and wood; acrylic outperformed all of the other materials in terms of cost and weight. In terms of water resistance, only acrylic and aluminum are water resistant and acrylic is much cheaper than aluminum.
Table 6. Comparisons for a 2’ x 4’ x 0.25” Platform
Material Cost ($) Weight (lb)
Acrylic 29.78 12.27
Steel – Hot Rolled 77.52 45.04
Aluminum – 6061 131.96 14.24
Sande Plywood 44.98 22.15
5.2.3 CO2, CO, O2 Sensor Selection
The NDIR CO2 Crestline sensor was chosen because it is one of the few integrated NDIR sensors
25
Table 7. NDIR Comparison to Prerequisite Values
Resp. Time CO2 Conc. CO Conc. Voltage Power Tolerance Integrated
Required < 10s 0-16% 0-10% <24 V < 20 W +/- 5% ✓
Model 7911 < 5s 0-20% 0-15% 8-42 VDC < 1.5 W +/- 3% ✓
Table 8. Comparison between Oxygen Sensors
Sensor Cost ($) Resp. Time Measurement Range (O2) Temp Range
2FO 103 < 10 s 0-30% -20 to +45 (C)
AO2 89.90 < 5 s 0-100% -20 to +50 (C)
5.2.4 Air Filter
The air filter that was chosen for this project is the Whatman 6723-5000 HEPA-VENT Filter. They are able to filter out particles as small as 0.3 microns at 99.97% efficiency. Other filters that are used in more industrial practices require the system to have compressed air, however the HEPA-VENT filter works with ambient air. Without an air filter, the soot and detritus would get into the sensor and reduce the flowrate of the system which leads to issues with the data measurement. Having this HEPA filter would prevent all of these problems. In addition, they are quite cheap at approximately $12 USD. This allows them to be replaced quite easily when they are filled with particulate. A detailed test procedure was created in order to determine the lifespan on the filters as shown in Appendix P since the team could not perform the test.
5.2.5 Air Line
26
5.2.6 Pump
The chosen pump for the project is the 12V Vacuum Pump made by Gikfun. This pump was chosen because it delivers an appropriate flowrate for the sensor to take its measurements. Additionally, it is modestly priced and small in size and weight, making it easy to package and incorporate into the system. For additional details refer to Section 4.3.
5.2.7 Battery
The Bioenno Power 12V, 9Ah LFP LiFePO4 Lithium Iron Phosphate Battery was chosen to meet the power requirements of our sensors and pump. The battery also has its own charger and be charging and powering the system simultaneously. Another reason this power supply was chosen was because it can last up to 14 hours, allowing a user to run multiple tests out in the field before having to recharge.
5.3 Safety, Maintenance, and Repair Considerations
The safety of the user and the device is of upmost importance. The team reviewed the safety of the design by creating a Failure Modes and Effects Analysis, which is attached in Appendix M. This process investigates how the design will fail, considers how these failures might affect the customer, and focuses the team to work on the most critical potential issues. Since most of the points of failure are software related, actions to mitigate and reduce failure modes will be achieved once the programming phase occurs. This phase will start in mid-February when the sensors are in.
Other safety precautions taken for the user are -- device was designed to be less than 30 lbs, sharp edges are to be rounded, no exposed conductors, and handles are installed to make carrying the device easier. Also, the software is to be user friendly and have lots of helpful comments to make debugging quicker and easier. The GUI has an emergency stop to be able to turn off the system quickly if something goes wrong.
In order to mitigate damage to the device, it is enclosed and secured in an aluminum briefcase as well as the wires are properly insulated and connected so they do not short the device. The tubing that goes to the exhaust duct will be detachable so that can be stored rolled up within the briefcase. If the suitcase lid was closed while the hoses are still attached, the hoses will be fine since they are very flexible. Other protective measures include a well written manual on how to operate the device and safely replace components for maintenance.
27
their part number and vendor are contained in the budget table in Appendix L. There are test procedures to determine the life of the filters in Appendix P.
5.4 Cost Analysis Summary
After sourcing components and compiling their prices, the total cost of the system came out to around $1300. The bulk of the system’s costs come from the two sensors (~$450), the power supply (~$120), and the SPAN gases for calibration (~$220). For quality components that are durable and will last for many years of use, these prices are justified. Additionally, the SPAN gases are needed for calibration purposes and are a one-time cost. All necessary components besides the SPAN gases have been purchased by the team so this is the only thing the sponsor will need to purchase later.
The smoke extraction/tubing network has a total cost of about $100. This means that the briefcase sub-assembly carries most of the cost of the entire system. All bolts and connectors for the system are based on standard sizes, however some of the locking mechanism components such as the thumb screws and coupling nuts bring the price up. The sum of the prices of all these connectors are also about $100.
Since this project has been allocated a budget of $3000, the team feels confident that even if changes must be made to the prototype before building the final assembly, they will have the funds necessary to purchase extra or replacement parts. A summary of these costs can be found in Table 7. For a more detailed cost analysis, refer to Appendix L.
Table 7. Summary of Costs
Component
Cost
Briefcase $38.99
Acrylic for Mounting Plate (final and prototype) $69.99
Oxygen Sensor $89.90
CO/CO2 Sensor $347.00
Power Supply $133.32
Pumps (two types for testing) $46.00
Prototyping Materials $45.00
Air Filter $129.00
Tubing and Fittings $35.91
SPAN gases (for calibration) $226.28
Misc. Hardware and Fasteners $70.00
Estimated Shipping and Taxes $122.98
28
6. Manufacturing
This design for the Portable Oxygen Consumption Calorimeter was created to keep the manufactured or modified parts to a minimum. Most of the key components are sensors that will need to be purchased from third party sources. However, the mounting platform for the briefcase and fitting to the fume hood duct will need to be manufactured. The mounting platform and fume hood duct fitting for this project will need to be fully designed and fabricated. The drawings for the exhaust and the mounting platform as well as their respective assembly drawings are attached in Appendix H. In addition, the GUI and data output will need to be programmed. Pseudocode has been written to show what the program is intended to do and the final code that was written is attached in Appendix O.
6.1 Material Procurement
Due to the nature of this project, key components such as the sensors were purchased from a third-party manufacturer. The NDIR CO2 and CO sensor were purchased from Crestline Inc. The other
electrical components such as the oxygen sensor, wires, and power supply were purchased from the online retailer Amazon. The acrylic, push to connect fittings, barbed fitting, and machine nuts and bolts will be purchased from a Home Depot or ACE hardware depending on part availability. A detailed breakdown of the parts purchased is described further in the Indented BOM attached in Appendix G.
6.2 Mounting Platform
This is the platform that the sensor components, power supply, pump, and air filter are mounted to. The components that mount to the pink mounting platform is shown in Figure 14.
Figure 14. Mounting Platform and the Components
29
Step 2: ¼” holes were laser cut into the corner of the platform, and rubber feet were
threaded onto the platform.
Step 3: ¼” holes were laser cut 1” into the short side of the platform spaced 4” vertically
from each other and 3.71” from the top. This was mirrored on the other side of the acrylic platform. Handles were attached to the platform with bolts and nuts using these holes.
Figure 15. Handles, Bolts, Pump/O2 Sensors Mounted
Step 4: Two 1/8” holes were laser cut 1.25” from the top of the platform and 10.19” from the left side with 1.882” distance separating them vertically.
Step 5: Laser cut 1” x 1/8” slots around battery, pump, and oxygen sensor (see part drawing for locations). These components that were strapped to the mounting platform by using these slots and Velcro straps. These components were strapped to the mounting platform by using these slots and Velcro straps. This makes them easy to remove for maintenance purposes.
Step 6: ¼” holes were laser cut into the mounting platform. Thumbscrews were mounted through the platform onto the coupling nuts.
Step 7: ¼” holes were drilled into the bottom of the briefcase. A round headed bolts were
30
Figure 16. Visual of Round Headed Bolt and Coupling Nut (Right)
Figure 17. Round Headed Bolt and Coupling Nut Mounted
6.3 Tubing Network
High-Flex PVC has been selected for the tubing to route the smoke through the mounting platform between components. The inner diameter of the tubes will be ¼".
31
Figure 18. Pump and Filter Fitting
Figure 19. Fully Attached System
32
6.4 Fumehood Duct Fittings
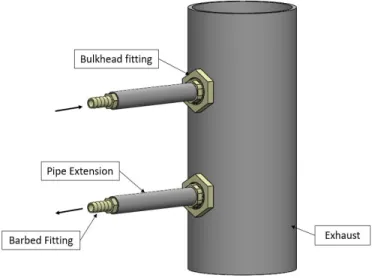
For the duct fitting, two airline bulkhead fittings will be attached to the duct above the fume hood. These bulkhead fittings will have steel tubes with barbed fittings at the end. These barbed fittings will then connect to the tubing network mentioned above. An exploded view of these components is shown in Figure 15. Due to current events, this component has yet to be manufactured. Manufacturing will be done either by Dr. Emberley or by team members at a later date.
Figure 20. View of Exhaust Connection
Step 1: A ¼" hole will be drilled into the duct 5” above the fume hood. A second ¼"
hole will be drilled 2” above the first hole.
Step 2: Bulkhead fittings will be threaded onto the ¼" holes.
Step 3: A 5” steel tube will be attached onto the threaded end of both bulkhead fittings. Step 4: A barbed fitting will be attached to the end of the 5” steel pipe.
Step 5: The tubing network inlet and outlet pipes will then be inserted onto the barbed fittings. The inlet tube should be hooked up to the bottom barbed fitting.
6.5 Wiring the System
33
Step 2: Connect battery to pump and CO/CO2 sensor when ready to use device. The red LED will light up on the breakout board (Figure 21 on the right) if there is power to the device.
Figure 21. CO/CO2 and O2 Sensor Connected to Battery
Step 3: Connect RS-232 to USB cable with the RS-232 connector into the breakout board and the USB connector into computer. (See Fig 22). There will be a blue light inside the cable if the device is connected properly.
34
6.6 Assembly
For this device to work, all three of the previous systems need to be attached together. Once the mounting platform is built into the briefcase the inner tubing networks can be connected and secured to the platform. Once the fittings for the tube network are bolted down onto the board, the tube network will be linked up with the fume hood duct fittings. The inlet tube will be attached to the lower duct fitting and the outlet tube will be attached to the upper duct fitting. However, with problems due to COVID-19, the assembly of the fume hood duct fittings will be completed by Professor Emberley before conducting testing. Our final assembled device is seen in Figure 23.
Figure 23. Isometric View of the Final Assembly
6.7 Coding
The programming in this project consisted of two parts: learning and understanding the Crestline sensor software as well as creating a GUI for users to their desired data. The steps for installing and sending commands to the Crestline Sensor software to get the sensor to collect data is described in the Operator’s Manual which can be found in Appendix Q. The GUI was created using MATLAB and the process for creating it are outlined below. The final code for the GUI and heat release calculations is attached in Appendix O.
35
Step 2: Use MATLAB’s App Designer to create the features of the GUI as seen in Figure 24.
Figure 24. Features of the GUI
Step 3: Set up a while loop for the run button so that it can plot the collected data while the user has the code running.
Step 4: Inside the while loop, call the MATLAB script and then plot the heat release rate against time during each pass through.
Step 5: Create a function to update the table with the current concentration values, heat release rate, and time. This function is called in the while loop to update the table through each pass.
Step 6: Create a global variable that can stop the running of the while loop when the stop button is pressed.
Step 7: Store the collected data (heat release rate, time, and concentrations) to an excel file called testdata.xls for the user to use after the stop button is pressed. The text file from the sensor can also be accessed in the Crestline folder, which is specified in the Operator’s Manual in Appendix Q.
36
6.8 Challenges and Future Production:
The biggest challenge that occurred was creating a plan that would be dealing with the manufacturing processes after COVID-19. There were several manufacturing delays and the team was also spread out across several states. This significantly hampered production time as only one member was able to be working on the device. Future production, however, should be simpler to carry out. A majority of the complex manufacturing is done by the laser cutter and the other manufacturing consists of drilling.
37
7. Design Verification
There are three categories for the testing of the specifications described in the Specifications Table in Section 3.4, safety, usability, and data. Also, the results from the testing procedures in Appendix P are included in Appendix N and are discussed in the results section (Section 7.4).
7.1 Safety:
The smoke extraction cannot leak as this would be a safety hazard for people in the lab. Also, the sensors only work properly for a certain flowrate (0.5 L/min to 1.5 L/min), necessitating a proper test of the smoke extraction system. For the test, a flowmeter will be attached to the tubing of the system as well as a visual inspection of the components to make sure that there are no leaks (the smoke will be visible before the filter due to the soot from the combustion).
Electrical wiring safety is important when working with this system. While there are no high voltages, the battery has enough energy to provide a shock to a person if there are exposed wires. Wires must be properly insulated and there cannot be any shorts in the system, as this is a safety hazard. The test for exposed wires can be performed visually as well as with a voltmeter.
Heat is present in any system with smoke and combustion, which is a hazard to the components of the calorimeter as well as the user. To minimize this, we will ensure that all tubing and components are safe to the touch. The equipment used for the temperature reading will be thermocouples throughout the system.
Thermal analysis of expected temperatures will also be used to compare the actual temperatures for selected areas of interest (connection to the fume hood and inlet to the sensors) and they should be within 5% of the calculated values to ensure the system is safe for the user. The test for thermal analysis will simply be calculations at specific points and will be compared with the measured values from thermocouples at those positions.
The case of the calorimeter must protect the components from damage from an unexpected load or weight. The structural integrity factor quantifies this with minimal deflection by the expected load range (50-100 lbs). This is the expected force that the calorimeter device will feel under normal loading conditions. The structural integrity factor will be tested on the briefcase and acrylic plate by using a tape measure as well as weights to quantify the deflection of the calorimeter under load for a known load.
38
7.2 Usability:
To consider the calorimeter portable, the user must be able to move the device to the desired location. Dimensions of 24 inches long by 24 inches tall by 12 inches wide with a tolerance of +/- 5 inches were chosen. This allows the system to include all the required components, while limiting the size. The test for verifying the correct dimensions for the portable calorimeter will use a tape measure to record the length, width, and height of the calorimeter. Comparing the actual values to the parameters will determine if the specification is met or not.
Portability also includes the weight of the device, which we have chosen to be less than 30 pounds. The test for this device involves placing the calorimeter on a scale and comparing the results to the chosen specification.
The calorimeter needs to be usable without extended training or familiarity, it must be usable and intuitive from the beginning. To test the usability of the entire system, especially the software user interface, a survey will be conducted after the user interacts with the calorimeter. The results will be tabulated and analyzed to ensure that four out of five users have a positive experience.
The calorimeter must be compatible with other devices in the lab, including the fume hood, computers, and electronics in the Combustions Lab. Testing for this will be an inspection of the system to ensure that all properties of the calorimeter work properly.
7.3 Data Acquisition:
The heat release rate values are the most important outputs of this system as they are the primary data measured with the calorimeter. Ensuring the calorimeter has an accurate calibration is necessary to determine the accuracy of the entire device. The test for heat release rate uses the outputs from the oxygen and NDIR sensors compared to the known heat release rate of the sample undergoing combustion in the fume hood. The sensor will collect the numerical data of the heat release rate to perform data analysis and uncertainty propagation calculation.
Software testing will ensure that the runtime for the code is minimized to lower the response time of the entire system. A lower response time gives data that is closer to real time, removing as much lag as possible from the system. Software that takes a long time to run negatively affects the time response and to test this, a stopwatch will be used to measure the time it takes for the software to compile and run. This response time should be less than one minute, and the software may be refined to run much faster than this specification.
39
All specifications and testing requirements, as well as preliminary dates for testing, can be found in the Design Verification Plan in Appendix N.
7.4 Results:
The design was verified using the guidelines in Appendix N (Design Verification Plan). However, there was a significant disruption in the testing procedures due to COVID-19. The Combustion Lab at Cal Poly was not accessible, and no data collection of the combustion products could be completed off campus.
The tests that could be completed were the dimensions, weight of the device, software testing, the structural integrity factor, and the heat release values (to an extent). The dimensions,
structural integrity factor, and weight of the device were pass/fail according the specifications in the DVP. In Figure 25, the software testing of the Crestline software was performed in the Electrical Engineering Lab at Cal Poly. The power supply is attached to the Crestline calorimeter sensor and the sensor is attached to the computer. This initial testing allowed the team to learn the commands and the setup needed for collecting data from the sensor. This helped in
understanding how the sensor stores the data so that it could be used when writing the MATLAB code that processes this data to calculate the heat release rate.
Figure 25. Initial CO/CO2 Sensor Testing in an Electrical Engineering Lab at Cal Poly.
The heat release values were partially completed using data from a previous combustion
40
calculated for the heat release due to the inability to perform any experiments in the lab. The team also ran the MATLAB code while the sensor was collecting data to ensure that the two programs work together.
Figure 26. Plot of Heat Release Over Time from Data Given by Dr. Emberley.
7.5 Future Tests
41
8. Project Management
This section outlines the team’s design process and deadlines and detail the special techniques that were used to solve the problem.
8.1 The Design Process and Deadlines
The design process for the first ten weeks consisted of sponsor interviews, preliminary research and component review. Sponsor interviews and preliminary research was conducted concurrently to help the engineering team determine the scale of the project. The next step was to create a scope of work document and send it to the project’s sponsor. Once the engineering team could move forward, they conducted component review on the parts that will be necessary for creating a functioning prototype. After the research on the individual sensors was complete, the team moved onto understanding the design limitations of the integrated system. When the components were chosen for the final design, the team could proceed with designing the physical containment package of the device. The packaging of the portable calorimeter is important for the smoke line extraction of the system. Once the packaging study has been finished and the prototype has been built, coding the device can begin. This will carry forward into the spring quarter of the academic year. The Gantt Chart contains a more detailed version of tasks in between the major milestones and can be found in Appendix C.
Throughout the project, distribution of tasks was done using a Gantt Chart and after meeting weekly with the adviser. This allowed for the team to keep a tight hold on what needed to be done over the upcoming weeks for short-term planning. Over the course of the spring quarter, COVID-19 disrupted the original workflow of the team. To compensate for this, the team decided to meet up for an additional two hours on the weekend to set up project goals and confirm finished work. This allowed the team to make headway at a constant pace and hit the deadlines for external submissions and internal assignments.
42
Table 8. Project Timeline up to 6/8/2019
Deliverable
Due Date
Choosing a Project
9/26/2019
Identifying Technical Challenges
10/8/2019
Product and Patent Research
10/14/2019
QFD
10/15/2019
Scope of Work
10/18/2019
Preliminary Design Review (PDR)
11/15/2019
Interim Design Review
1/16/2020
Critical Design Review (CDR)
2/7/2020
Manufacturing and Test Review
3/12/2020
Senior Expo
6/8/2020
Final Design Review (FDR)
6/4/2020
8.2 Special Techniques for Solving the Problem
43
9. Conclusion
This section outlines the results, the recommendations, future steps, reflection, and the challenges the team faced during the project.
9.1 Next Steps
Future work to be completed by the sponsor will include calibration of the NDIR sensor, testing the calibrated device using actual fire experiments, and setting up the computer software. In order to calibrate the device, SPAN gases will need to be purchased. This cost has been accounted for in the budget, however quarantine prevented the team from acquiring the gases.
There are also a few manufacturing steps that need to be done - the fume hood extraction piece needs to be manufactured and built into the fume hood in the Combustion Lab. This will allow the device to obtain the data more effectively from the fire and return the smoke into the system in a safer manner. Another piece of manufacturing that could be added into the system is a dehumidifying component. While the oxygen and NDIR sensors are robust and can be used in an environment where the relative humidity is 99%, the water vapor in the system can be purged to ensure that the electrical components will last for a longer period. Ideally, there would also be a flowmeter connected to the system to ensure that the air’s flowrate is in the ideal range for the NDIR sensor.
The software side of the system could also be improved with further work. The team was not able to get the MATLAB script to talk to the host program for the NDIR sensor. Essentially, the two programs need to be run simultaneously for there to be a visible output. This is a
cumbersome way of achieving the goal and can confuse the user if they are not getting the correct outputs. MATLAB can be configured to send serial commands to the host program. This will allow the MATLAB script to communicate with the host program without having to operate both programs at the same time. This would reduce several of the operating procedures and reduced and confusion that may arise due to the two different operating software. If the team had more time to work on this project, they would spend more time researching appropriate MATLAB syntax for achieving this goal. MATLAB syntax for achieving this goal.
Another option for solving this issue is instead of using the breakout board the Crestline software to operate the sensor, one can connect the RX and TX serial data lines to a microcontroller such as an Arduino or Raspberry Pi and program the microcontroller to read the data and plot the results. This would allow for easier use of the system in general but coding a microcontroller would involve building the software and GUI from scratch.
44
9.2 Project Summary and Reflection
This document shows the work that the team has made towards the final design. The goal of this project, which was to create an oxygen consumption calorimeter that will be under $3000 and portable, has been achieved. The team’s concept prototype was the result of brainstorming ways to achieve portability and user-friendly requirements. Additionally, specific sensors, pumps, and coding languages were researched and analyzed to find the best ones for this application. After finding a reasonably priced NDIR sensor, the team was able to move ahead with building their concept and came in under budget at around $1300. The team investigated potential risks involved in the product and noted that there was not anything of concern. The biggest risk is the potential for users to be exposed to heat and smoke, but the team has added safety measures to protect against harm from these elements. As much of the final assembly was built as was possible by the team under the current circumstances due to social distancing measures from COVID-19. As such, the sponsor and team members will continue to refine and test the final product, as well as make modifications to the Combustion lab’s exhaust duct, once they are able.
This year-long project provided an amazing learning opportunity to the team to become more knowledgeable about fire research and safety along with developing skills in project management, safety, design, and testing. If the team were to begin this project over again, they would spend more time during the brainstorming and researching phase designating specific roles to each team member. Additionally, the team would have chosen a different coding program than MATLAB. Although MATLAB was what the team was most familiar with, another program such as C+ would have allowed for a more robust GUI that would make student use easier.
45
References
Beyler, C., et al. “Oxygen Consumption Calorimetry, William Parker: 2016 DiNenno Prize.”
Fire Science Reviews, vol. 6, no. 1, 2017, doi:10.1186/s40038-016-0016-z.
Brohez, S., et al. “The Measurement of Heat Release from Oxygen Consumption in Sooty Fires.”
Journal of Fire Sciences, vol. 18, no. 5, Jan. 2000, pp. 327–353., doi:10.1106/bgr5-xy35- n89h-hyl0.
Dlugogorski, Bogdan Z, et al. “The Measurement of Heat Release Rates by Oxygen
Consumption Calorimetry in Fires Under Suppression.”
http://iafss.org/publications/fss/4/877/view/fss_4-877.pdf.
“Estimation of Rate of Heat Release by Means of Oxygen Consumption Measurements.” A Century of Excellence in MEASUREMENTS, STANDARDS, and TECHNOLOGY, June 2018, pp. 280–282., doi:10.1201/9781351069397-75.
“Flammability Testing and Fire Testing, Flammability Testers - SGS Govmark Fire Laboratories.” Govmark Fire & Flammability Test Instruments,
https://www.govmark.com/testing-instruments/Cone-Calorimeter.
Hangauer, Andreas, et al. “Laser Spectroscopic Oxygen Sensor for Real Time Combustion Optimization.” Procedia Chemistry, vol. 1, no. 1, 2009, pp. 955–958.,
doi:10.1016/j.proche.2009.07.238.
Huggett, Clayton. “Estimation of Rate of Heat Release by Means of Oxygen Consumption Measurements.” Fire and Materials, vol. 4, no. 2, 1980, pp. 61–65.,
doi:10.1002/fam.810040202.
Izu, Noriya et al. “Resistive oxygen sensor using ceria-zirconia sensor material and ceria-yttria temperature compensating material for lean-burn engine.” Sensors (Basel, Switzerland) vol. 9,11 (2009): 8884-95. doi:10.3390/s91108884
Janssens, Marc L. “Measuring Rate of Heat Release by Oxygen Consumption.” Fire Technology, vol. 27, no. 3, 1991, pp. 234–249.
Johnson, Kenneth S., et al. “Air Oxygen Calibration of Oxygen Optodes on a Profiling Float Array.” Journal of Atmospheric and Oceanic Technology, vol. 32, no. 11, 2015, pp. 2160–2172., doi:10.1175/jtech-d-15-0101.1.
46
vol. 86, no. 12, 2015, p. 125103., doi:10.1063/1.4936568.
Parker, W.j. “Calculations of the Heat Release Rate by Oxygen Consumption for Various Applications.” Journal of Fire Sciences, vol. 2, no. 5, 1984, pp. 380–395.,
doi:10.1177/073490418400200505.
Redfern, J.P. “Journal of Thermal Analysis and Calorimetry” Rate of Heat Release Measurement
Using a Cone Calorimeter (1989) 35: 1861. https://doi.org/10.1007/BF01911673 Seitz, Jason, and Chenan Tong. “LMP91051 NDIR CO2 Gas Detection System.” Texas
Instruments Application Report, http://www.ti.com/lit/an/snaa207/snaa207.pdf. “6100 Automatic Compensated Jacket Bomb Calorimeter.” Orbit Technologies, 3 Oct. 2019,
A-1
Appendix A: Patents
1. Heat Release Rate for Milligram Samples (US Patent #6464391 B2)
Abstract: A calorimeter that measures heat release rates of very small samples (on the order of one to 10 milligrams) without the need to separately and simultaneously measure the mass loss rate of the sample and the heat of combustion of the fuel gases produced during the fuel generation process. The sample is thermally decomposed in a small volume pyrolysis chamber. The resulting fuel gases are immediately swept by an inert gas stream from the pyrolysis chamber into a combustion furnace in a plug-like flow. This plug flow substantially synchronizes the emerging fuel gases with the mass loss rate of the sample. Oxygen is
metered into the fuel gas stream just before it enters the combustion furnace where the fuel gases are completely oxidized. The effluent from the furnace is analyzed to determine the amount of oxygen consumed per unit time and the heat release rate is computed without the need to separately measure the mass loss rate of the sample.
2. Method for Measuring Heat Release of Polymeric Compounds (US Patent #0034580 A1) Abstract: The invention provides a method for measuring the heat release rate of a flame retardant compound in a microscale combustion calorimeter.
3. Coal Calorimetry System (European Patent #88105006.6)
Abstract: A calorimetry system which is especially suitable for on-line, continuous
measurement of the heating value of coal and which provides heating value data which may be used to control coal-fired furnaces in public utility power plants has a calorimeter with a combustor and a mixing unit wherein heat from the combustion gases is transferred to air. The system has apparatus for pulverizing the coal and a gravimetric feeder for providing pulverized coal at a measured mass feed rate to the combustor. The system also has devices for preheating the combustor and initiating self-sustained combustion of the coal therein without the need for further supporting fuel gases. Instrumentation in the system measures the flow rates of the cooling air, primary and secondary -, combustion air as well as the mass flow rates of the coal into the combustor. A computer is provided with input/output devices which is responsive to the measuring instruments (thermocouples and pressure gauges) for controlling the feeding of the coal and fuel gases during initiation of combustion and for computing the heating value of the coal. The computer may have a memory with storage for specific heat values of the constituents of the products of combustion of various ranks of coal (bituminous, subbituminous, lignite, etc.) and the average mass fraction of each constituent in the coal by rank so that the heating value thereof can be determined with accuracy. The combustor and mixing unit are constructed in a manner to return to the combustion gas and to the combined combustion gas and cooling air most of the radiant and convective heat losses in the system thereby minimizing the effect of heat loss and the effect of ambient
A-2 4. Bomb Type Calorimeter (US Patent #4511263)
Abstract: A bomb-type conduction calorimeter consists of a bomb separated from a
substantially infinite heat sink by several heat flow detecting elements. The bomb is enclosed by an inner copper box having a cylindrical interior and a polygonal exterior. The inner copper box is enclosed by an outer copper box having a polygonal interior. The heat flow detecting means may be several thermopiles in contact with the inner and outer polygonal surfaces. The infinite heat sink may be a constant temperature water bath. Heat flow directly from the test substance is measured, as opposed to the heat flow dissipated to the
environment of the bomb. The calorific values determined are independent of the amount of water in the water bath.
5. Cone Calorimeter (Chinese Patent #105424748 A)
Abstract: The invention discloses a cone calorimeter. The cone calorimeter comprises a main control computer, an auxiliary control computer, a combustion and irradiation device, a smoke discharging assembly and a gas analysis device, wherein the auxiliary control
computer is provided with a heat flux meter assembly and a water-cooled circulating system of the heat flux meter assembly; the combustion and irradiation device comprises an ignition assembly, a heat radiation assembly and a sampling assembly; the smoke discharging
B-1
C-1