OPTIMIZING THE PUBLIC HEALTH BENEFIT OF A MEDICAID CONTROLLED SUBSTANCE LOCK-IN PROGRAM
Andrew W. Roberts
A dissertation submitted to the faculty at the University of North Carolina at Chapel Hill in partial fulfillment of the requirements for the degree of Doctor of Philosophy in the Division of Pharmaceutical
Outcomes and Policy in the UNC Eshelman School of Pharmacy.
Chapel Hill 2015
ABSTRACT
Andrew W. Roberts: Optimizing the Public Health Benefit of a Medicaid Controlled Substance Lock-In Program
(Under the direction of Joel F. Farley and Asheley C. Skinner)
Medicaid controlled substance lock-in programs (MLIP) have garnered increased attention for their potential role in combating prescription drug abuse. MLIPs are purported to enhance care
coordination for high-risk beneficiaries by restricting access to a single prescriber and pharmacy for controlled substance service coverage. However, the MLIP evidence base is largely non-existent. The purpose of this dissertation was to examine two threats to MLIP effectiveness: lock-in circumvention through out-of-pocket purchases and lack of standardized MLIP eligibility criteria. Our aims were to investigate: 1) the effect of enrollment in the North Carolina (NC) MLIP on controlled substance circumvention behavior, 2) prescription-level characteristics of circumvented opioid analgesics, and 3) optimal claims-based measures of high-risk opioid use for assessing MLIP eligibility.
We used a retrospective cohort of NC MLIP enrollees and linked NC Medicaid claims and Controlled Substances Reporting System data from 10/1/2009-9/30/2012. Generalized estimating equations estimated the effect of MLIP enrollment and covariates on circumvention behavior (Aim 1). Subjects were 3.6 times more likely to obtain a controlled substance prescription through circumvention after MLIP enrollment. Generalized linear models estimated the association of MLIP enrollment with circumvention of opioids with high-risk prescription-level attributes (Aim 2). Mean prescribed daily opioid dose and the likelihood of a circumvented prescription containing a Schedule II opioid product or a long-acting opioid product did not increase after MLIP enrollment.
predictors of overdose were selected using survival receiver operating characteristic models and bivariate Cox model fit. The best measures were ≥5 opioid claims and ≥12 daily milligram morphine equivalents over 60 days, but these exhibited low sensitivity in capturing subjects with overdose.
ACKNOWLEDGEMENTS
I owe a debt of gratitude to so many people for their help and encouragement in getting me across the PhD finish line. First, I need to thank my adviser, Joel Farley. Your mentorship played a vital role in making my time at UNC a rewarding experience, and I’m excited to continue our friendship as
colleagues. Thank you also to Asheley Skinner for being such a collaborative and supportive mentor. I’ve benefited so much as a proto-faculty member from working so closely with you. To the rest of my dissertation committee—Betsy Sleath, Christine Oramasionwu, and Mark Holmes—I can’t tell you how much I appreciate your time and enthusiasm in helping my shape my dissertation.
There is a laundry list of other folks whose moral and technical support made my life as a grad student much easier. Thank you to Tim Carey and the faculty and fellows at the Sheps Center for creating such a fun academic sandbox that I was very fortunate to play in these past two years. Thank you to Morris Weinberger and Stacie Dusetzina for being unfailingly accessible and trustworthy mentors. I need to also thank Mark Weaver and Leslie Moss for your generous and masterful technical assistance. To the entire faculty, staff, and students of DPOP, I couldn’t have asked for a better grad school environment. I would be a very lucky person to work with another group of people as fun and talented as you all.
TABLE OF CONTENTS
LIST OF FIGURES ... xi
LIST OF TABLES ... xiv
LIST OF ABBREVIATIONS ... xix
CHAPTER I: INTRODUCTION ... 1
1.1
OVERVIEW ... 1
1.2
SPECIFIC AIMS ... 4
1.3
SIGNIFICANCE ... 9
CHAPTER II: BACKGROUND, LITERATURE REVIEW, AND CONCEPTUAL MODEL ... 11
2.1
BACKGROUND ... 11
2.1.1
Introduction ... 11
2.1.2
Overview of Controlled Substances ... 11
2.1.3
Controlled Substance Use Behaviors ... 12
2.1.4
Nonmedical Controlled Substance Use—Prevalence and Trends ... 13
2.1.5
Nonmedical Controlled Substance Use—Clinical Outcomes ... 14
2.1.6
Nonmedical Controlled Substance Use —Healthcare Utilization Outcomes ... 15
2.1.7
Nonmedical Controlled Substance Use —Economic Outcomes ... 15
2.1.8
Nonmedical Controlled Substance Use —Trends in North Carolina ... 16
2.1.9
Addressing Nonmedical Use Through Policy ... 16
2.1.10
Prescription Drug Monitoring Programs ... 17
2.1.10.1
North Carolina Controlled Substances Reporting System ... 18
2.1.11
Medicaid Lock-In Programs ... 19
2.1.11.1
North Carolina Medicaid Recipient Management Lock-In Program ... 23
2.2
LITERATURE REVIEW—MLIP Outcomes and Evaluations ... 24
2.2.2
General MLIP Outcomes—Peer-Reviewed Literature ... 25
2.2.3
General MLIP Outcomes—Doctoral Dissertation Findings ... 27
2.2.4
General MLIP Outcomes—Unpublished MLIP Evaluation Data ... 28
2.2.4.1
General MLIP Outcomes—Internal North Carolina MLIP Report ... 29
2.2.4.2
General MLIP Outcomes—Unpublished Economic Findings ... 30
2.2.4.3
General MLIP Outcomes—Unpublished Utilization Findings ... 31
2.2.4.4
General MLIP Outcomes—Unpublished Clinical Findings ... 31
2.2.5
Aim 1 MLIP Outcome—Engaging in Lock-in Circumvention ... 32
2.2.6
Aim 2 MLIP Outcomes—High-Risk Opioid Prescription Use ... 33
2.2.7
MLIP Outcomes—Summary and Gaps ... 37
2.3
LITERATURE REVIEW—DEFINING HIGH-RISK OPIOID USE ... 40
2.3.1
Section Overview ... 40
2.3.2
Defining Risky Controlled Substance Use—Peer-Reviewed Literature ... 41
2.3.2.1
Wisconsin Medicaid Lock-In Program Eligibility Tool Study ... 41
2.3.2.2
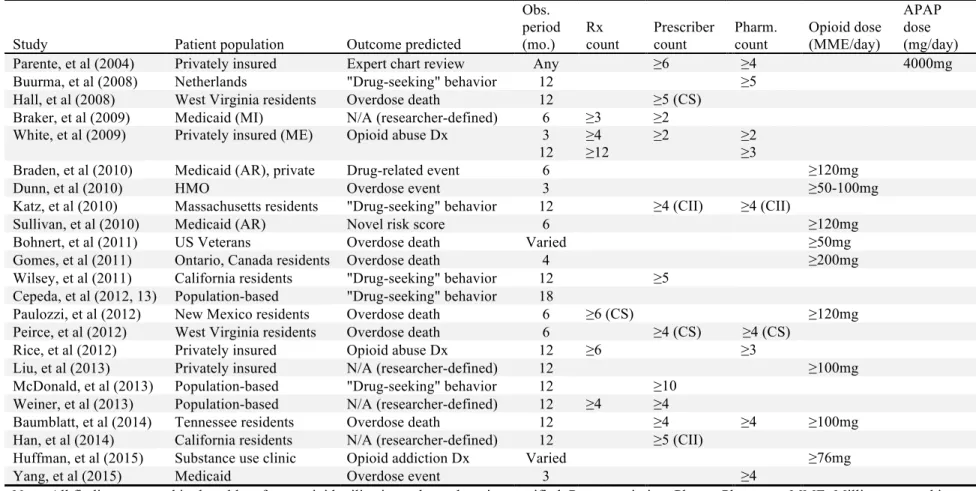
Claims-Based High-Risk Opioid Use Measures—Opioid Prescription Counts ... 42
2.3.2.3
Claims-Based High-Risk Opioid Use Measures—Opioid Prescriber Counts ... 45
2.3.2.4
Claims-Based High-Risk Opioid Use Measures—Opioid Pharmacy Counts ... 46
2.3.2.5
Claims-Based High-Risk Opioid Use Measures—Daily Opioid Dose ... 47
2.3.2.6
Claims-Based High-Risk Opioid Use Measures—Daily Acetaminophen Dose ... 48
2.3.2.7
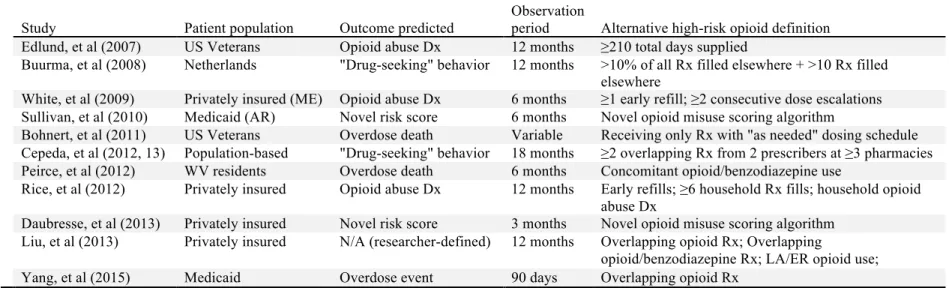
Claims-Based High-Risk Opioid Use Measures—Other Measures ... 49
2.3.3
Defining Risky Controlled Substance Use—The “ADOPT” Report ... 52
2.3.4
Defining Risky Controlled Substance Use—Summary and Gaps ... 53
2.4
CONCEPTUAL MODEL ... 55
2.4.1
Andersen’s Behavioral Model of Health Services Use ... 55
2.4.2
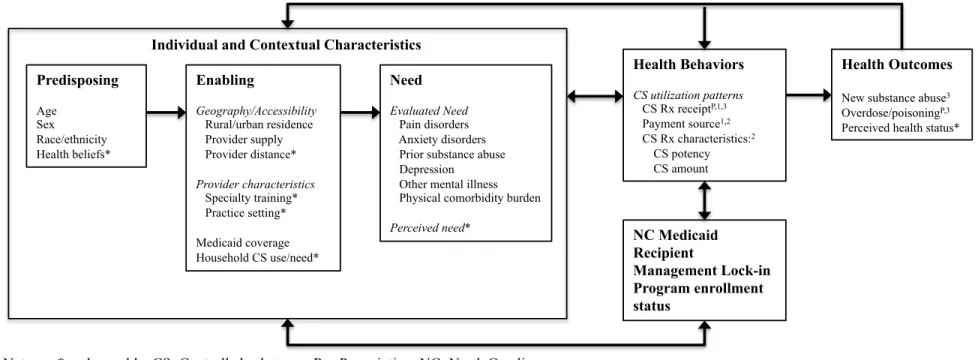
Dissertation Conceptual Model ... 57
2.4.2.1
Dissertation Conceptual Model—Predisposing Characteristics ... 59
2.4.2.2
Dissertation Conceptual Model—Enabling Characteristics ... 59
2.4.2.3
Dissertation Conceptual Model—Need Characteristics ... 60
2.4.2.5
Dissertation Conceptual Model—Health Behaviors ... 62
2.4.2.6
Dissertation Conceptual Model—Health Outcomes ... 63
2.5
CHAPTER SUMMARY ... 63
CHAPTER III: METHODS ... 65
3.1
DATA SOURCES ... 65
3.1.1
North Carolina Medicaid and CSRS Data Linkage ... 67
3.2
OVERALL STUDY SAMPLE AND DESIGN ... 67
3.3
POWER CALCULATIONS ... 68
3.4
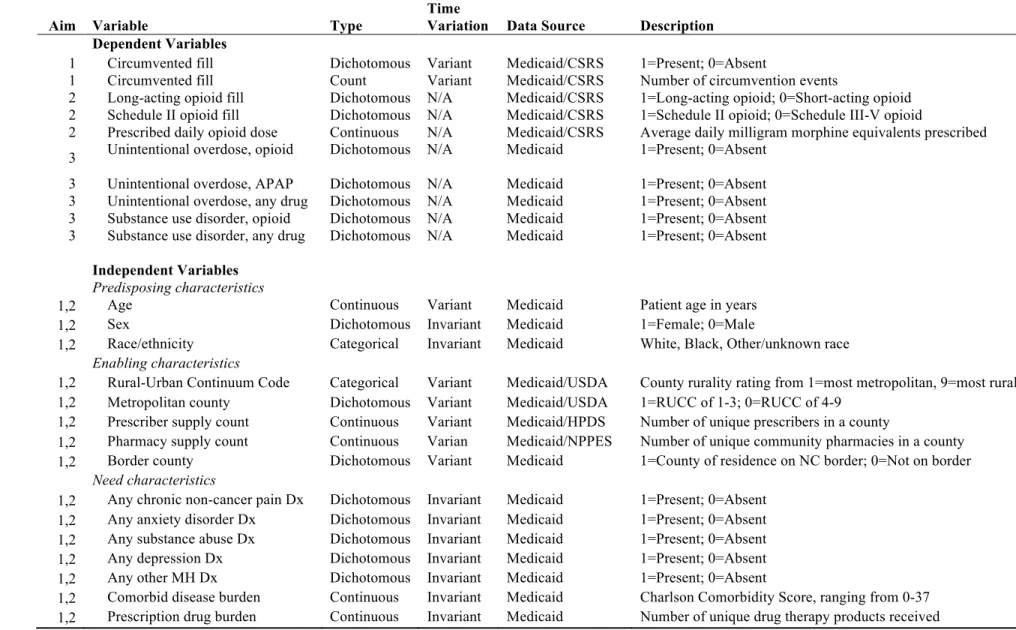
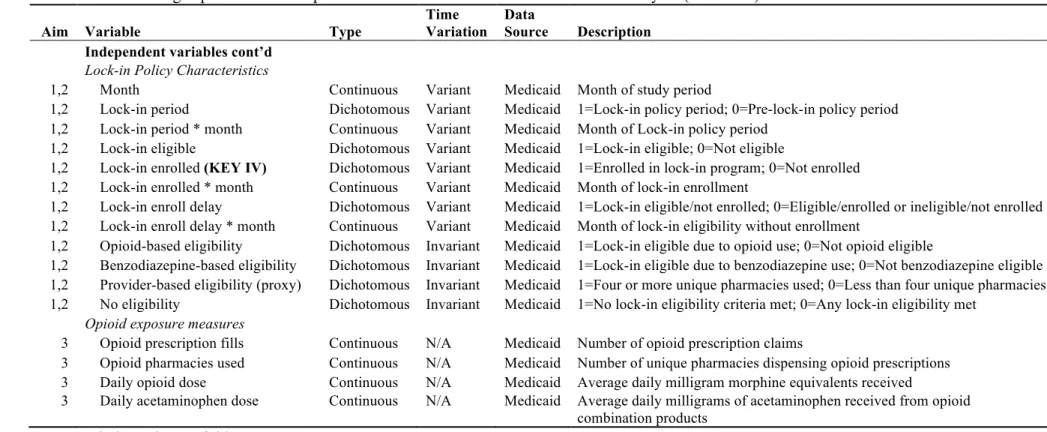
MEASURES ... 68
3.4.1
Dependent Variables ... 71
3.4.2
Independent Variables ... 74
3.4.2.1
Predisposing Characteristics ... 74
3.4.2.2
Enabling Characteristics ... 75
3.4.2.3
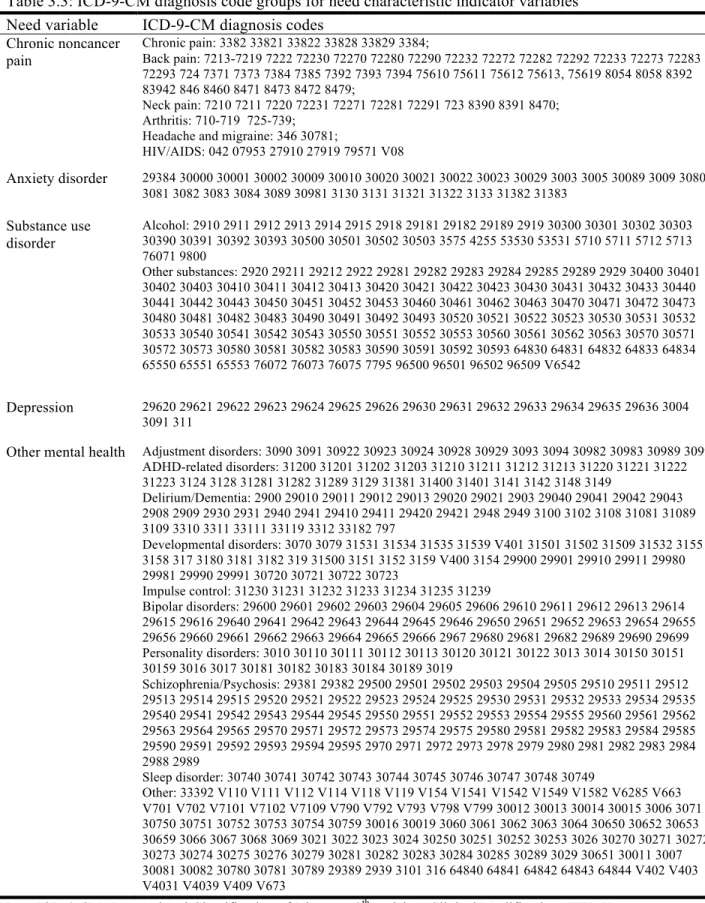
Need Characteristics ... 76
3.4.2.4
Lock-in Policy Variables ... 78
3.4.2.5
Opioid Utilization Measures ... 80
3.5
DATA ANALYSIS BY AIM ... 80
3.5.1
Aim 1 ... 80
3.5.1.1
Study Design—Aim 1 ... 81
3.5.1.2
Study Cohort—Aim 1 ... 83
3.5.1.3
Statistical Analyses—Aim 1 ... 84
3.5.2
Aim 2 ... 87
3.5.2.1
Study Design—Aim 2 ... 87
3.5.2.2
Study Cohort—Aim 2 ... 89
3.5.2.3
Statistical Analyses—Aim 2 ... 90
3.5.3
Aim 3 ... 93
3.5.3.1
Study Design—Aim 3 ... 93
3.5.3.2
Study Cohort—Aim 3 ... 96
3.5.3.3.1
Statistical Analyses—Aim 3 Testing Phase ... 97
3.5.3.3.2
Statistical Analyses—Aim 3 Validation Phase ... 99
CHAPTER IV: RESULTS ... 101
4.1
AIM 1 RESULTS ... 101
4.1.1
Aim 1 Descriptive Analysis Findings ... 101
4.1.2
Aim 1 Bivariate Analysis Findings ... 108
4.1.3
Aim 1 Generalized Estimating Equation Analysis Findings ... 111
4.2
AIM 2 RESULTS ... 115
4.2.1
Aim 2 Descriptive and Bivariate Analysis Findings ... 115
4.2.2
Aim 2 Generalized Linear Modeling Findings ... 123
4.2.2.1
Aim 2 Generalized Linear Modeling Findings—Schedule II opioid outcome ... 123
4.2.2.2
Aim 2 Generalized Linear Modeling Findings—Long-acting opioid outcome ... 126
4.2.2.3
Aim 2 Generalized Linear Modeling Findings—Mean MME/day outcome ... 128
4.3
AIM 3 RESULTS ... 130
4.3.1
Aim 3 Descriptive Analysis Findings ... 130
4.3.2
Aim 3 Testing Phase Findings ... 133
4.3.3
Aim 3 Validation Phase Findings ... 144
CHAPTER V: DISCUSSION ... 156
5.1
DISSERTATION OBJECTIVES RECAP ... 156
5.2
SUMMARY OF FINDINGS ... 157
5.2.1
Summary of Findings—Aim 1 ... 157
5.2.2
Summary of Findings—Aim 2 ... 158
5.2.3
Summary of Findings—Aim 3 ... 159
5.3
POLICY IMPLICATIONS ... 161
5.3.1
Policy Implications—MLIP Enrollment Delays ... 161
5.3.2
Policy Implications—MLIP Circumvention ... 162
5.3.3
Policy Implications—MLIP Eligibility Criteria ... 166
5.3.4
Policy Implications—Call to Action ... 169
5.5
FUTURE RESEARCH ... 171
5.6
CONCLUSION ... 174
APPENDIX ... 175
LIST OF FIGURES
Figure 1.1: Rates of opioid sales, deaths, and substance abuse treatment
admissions (1999-2010) ... 2 Figure 2.1: Andersen’s Behavioral Model of Health Services Use (Phase 5, 2008) ... 56
Figure 2.2: Dissertation conceptual model based on Andersen’s Behavioral
Model of Health Service Use ... 58
Figure 3.1: Aim 1 retrospective cohort study design ... 82
Figure 3.2. Specification of the Aim 1 generalized estimating equation models ... 87
Figure 3.3: Aim 2 pre-post retrospective cohort design for prescription-level
outcomes ... 89
Figure 3.4: Specification of Aim 2 generalized linear models ... 93
Figure 3.5: Aim 3 retrospective cohort study design for testing and validation
phases ... 95
Figure 4.1: Aim 1 analytic cohort selection ... 102
Figure 4.2: Cumulative MLIP eligibility and enrollment totals for Aim 1
subjects across the study period ... 105 Figure 4.3: Trends in the proportion of Aim 1 subjects recording any opioid or
benzodiazepine fill in an observation month, by source of payment ... 110
Figure 4.4: Trends in mean opioid plus benzodiazepine prescription fill totals
per-person-per-month for the Aim 1 cohort, by payment source ... 111
Figure 4.5: Ranked frequency of opioid products obtained by the Aim 2 cohort ... 118
Figure 4.6: Bivariate comparisons of mean prescribed MME/day for
circumvented opioid prescriptions, by MLIP enrollment status ... 122
Figure 4.7: Bivariate comparisons of mean prescribed MME/day for Medicaid
paid opioid prescriptions, by MLIP enrollment status ... 123
Figure 4.8: Aim 3 analytic cohort selection ... 131
Figure 4.9: Survival ROC models of the prescription fill count opioid exposure
measure ... 135
Figure 4.10: Survival ROC models of the unique pharmacy count opioid
exposure measure ... 136
Figure 4.11: Survival ROC models of the average MME/day opioid exposure
Figure 4.12: Survival ROC models of the average APAP mg/day opioid
exposure measure ... 138
Figure 4.13: Distribution of log likelihood values from Cox proportional hazard
models predicting Aim 3 outcomes at varied cutpoints of the opioid prescription
fill count measure ... 142
Figure 4.14: Distribution of log likelihood values from Cox proportional hazard
models predicting Aim 3 outcomes at varied cutpoints of the mean MME/day
measure ... 143
Figure 4.15: Kaplan-Meier survival function plots of time to an unintentional
opioid overdose event, by individual high risk opioid use measure criteria ... 150
Figure 4.16: Kaplan-Meier survival function plots of time to an unintentional
opioid overdose event, by unconditional combination of high risk opioid use
measure criteria ... 151
Figure 4.17: Kaplan-Meier survival function plots of time to an unintentional
opioid overdose event, by conditional combination of high risk opioid use
measure criteria ... 152
Appendix Figure 1: Distribution of captured vs. non-captured controlled substance
prescription claims in the CSRS across the Aim 1 and 2 study period ... 175
Appendix Figure 2: Residual distribution for ordinary least squares model of level
MME/day outcome ... 181
Appendix Figure 3: Residual distribution for GLM model of MME/day with
inverse Gaussian distribution and log link ... 181
Appendix Figure 4: Distribution of log likelihood values from Cox proportional
hazard models predicting Aim 3 outcomes at varied cutpoints of the pharmacy
count measure ... 196
Appendix Figure 5: Distribution of log likelihood values from Cox proportional
hazard models predicting Aim 3 outcomes at varied cutpoints of the mean APAP
mg/day measure ... 197
Appendix Figure 6: Kaplan-Meier survival function plots of time to an
unintentional acetaminophen overdose event, by individual high risk opioid use
measure criteria ... 206
Appendix Figure 7: Kaplan-Meier survival function plots of time to an unintentional
acetaminophen overdose event, by unconditional combination high risk opioid use
measure criteria ... 207
Appendix Figure 8: Kaplan-Meier survival function plots of time to an unintentional
acetaminophen overdose event, by conditional combination high risk opioid use
measure criteria ... 208
Appendix Figure 9: Kaplan-Meier survival function plots of time to any unintentional
Appendix Figure 10: Kaplan-Meier survival function plots of time to any unintentional
overdose event, by unconditional combined high risk opioid use measure criteria ... 210
Appendix Figure 11: Kaplan-Meier survival function plots of time to any unintentional
overdose event, by conditional combined high risk opioid use measure criteria ... 211
Appendix Figure 12: Kaplan-Meier survival function plots of time to an opioid use
disorder diagnosis, by individual high risk opioid use measure criteria ... 212
Appendix Figure 13: Kaplan-Meier survival function plots of time to an opioid use
disorder diagnosis, by unconditional combined high risk opioid use measure criteria ... 213
Appendix Figure 14: Kaplan-Meier survival function plots of time to an opioid use
disorder diagnosis, by conditional combined high risk opioid use measure criteria ... 214
Appendix Figure 15: Kaplan-Meier survival function plots of time to any substance
use disorder diagnosis, by individual high risk opioid use measure criteria ... 215
Appendix Figure 16: Kaplan-Meier survival function plots of time to any substance
use disorder diagnosis, by unconditional combined high risk opioid use measure criteria ... 216
Appendix Figure 17: Kaplan-Meier survival function plots of time to any substance
LIST OF TABLES
Table 2.1: Summary of federal controlled substance schedules 30,31 ... 12
Table 2.2: Controlled substance utilization pattern definitions ... 13
Table 2.3: Enrollment criteria for states with publicly available Medicaid lock-in
eligibility details (as of 2/22/14)a ... 21
Table 2.4: Controlled Substance Overuse Criteria Identified as Significant by the
Wisconsin Medicaid Decision Support Tool ... 42
Table 2.5: Summary of Key Claims-Based Measures of High-Risk Opioid Use in
Peer-Reviewed Literature ... 43
Table 2.6: Summary of Alternative Claims-Based Measures of High-Risk Opioid
Use in Peer-Reviewed Literature ... 50
Table 2.7: Controlled substance risk score component measures ... 51
Table 2.8. Comparison of Different Pharmacy Shopping Criteria in Medicaid
MarketScan® Dataset ... 53
Table 3.1: Definitions and characteristics of dependent and independent variable
measures used in dissertation analyses ... 69
Table 3.2: Categorizations of Schedule II opioids, long-acting opioids, and MME
conversion factors ... 73
Table 3.3: ICD-9-CM diagnosis code groups for need characteristic indicator
variables ... 77
Table 4.1: Aim 1 cohort MLIP eligibility, enrollment delay, and observation
characteristics ... 103
Table 4.2: Summary statistics for predisposing, enabling, and need characteristics
of the Aim 1 cohort, overall and by route of Medicaid lock-in program eligibility ... 107
Table 4.3: Bivariate trends in opioid and benzodiazepine prescription fills and
prescribers, before and after enrollment in the lock-in program ... 108
Table 4.4: Generalized estimating equation results for the estimation of any
circumvention fill and number of circumvented fills ... 113
Table 4.5a: Circumvented opioid prescription frequencies in the Aim 2 cohort
by prescription-level characteristic and MLIP enrollment status ... 116
Table 4.5b: Medicaid paid opioid prescription frequencies in the Aim 2 cohort
by prescription-level characteristic and MLIP enrollment status ... 116
Table 4.5c: All-payer opioid prescription frequencies in the Aim 2 cohort by
Table 4.6a: Circumvented Schedule II opioid product frequency, by MLIP
enrollment status ... 119 Table 4.6b: Circumvented Schedule III-V opioid product frequency, by MLIP
enrollment status ... 119
Table 4.7a: Medicaid paid Schedule II opioid product frequency, by MLIP
enrollment status ... 119
Table 4.7b: Medicaid paid Schedule III-V opioid product frequency, by MLIP
enrollment status ... 120
Table 4.8a: Circumvented long acting opioid product frequency, by MLIP
enrollment status ... 120
Table 4.8b: Circumvented short acting opioid product frequency, by MLIP
enrollment status ... 120
Table 4.9a: Medicaid paid long acting opioid product frequency, by MLIP
enrollment status ... 121
Table 4.9b: Medicaid paid short acting opioid product frequency, by MLIP
enrollment status ... 121
Table 4.10: Generalized linear modeling estimates for the likelihood of an opioid
Rx containing a Schedule II opioid product versus a Schedule III-V product ... 124 Table 4.11: Generalized linear modeling estimates for the likelihood of an opioid
Rx containing a long-acting opioid product versus a short-acting opioid product ... 127
Table 4.12: Generalized linear modeling estimates of average prescribed MME/day
per opioid prescription ... 129
Table 4.13: Summary statistics for the Aim 3 cohort, by testing and validation
sample subsets ... 133
Table 4.14: Logistic ROC analysis findings for each individual and combinations
of opioid exposure measures in predicting the primary Aim 3 outcome of
unintentional opioid overdose ... 139
Table 4.15: Optimal opioid exposure measure cutpoints from survival ROC models
predicting primary outcome of unintentional opioid overdose ... 140
Table 4.16: Describing application of selected opioid use criteria in Aim 3
validation sample for primary unintentional opioid overdose outcome ... 146
Table 4.17: Bivariate Cox proportional hazard model results estimating the hazard
of an unintentional opioid overdose for each opioid use criterion ... 148
Table 4.18: Kaplan-Meier estimates of unintentional opioid overdose event, by
opioid use criterion, represented as absolute risk differences and numbers needed
Appendix Table 1: Examining differences in characteristics of Medicaid controlled
substance claims captured by the CSRS vs. not captured by the CSRS ... 175
Appendix Table 2: NC Medicaid coverage gaps in the Aim 1 analytic cohort ... 175
Appendix Table 3: Sensitivity analysis results of generalized estimating equation
models of circumvention behavior after excluding Aim 1 subjects with any gaps in
Medicaid coverage ... 176
Appendix Table 4: Sensitivity analysis comparing generalized estimated equation
output from logistic versus modified Poisson modeling approach of the Aim 1
binary circumvention outcome ... 177
Appendix Table 5: Pearson’s correlation coefficients among enabling variables
in Aim 1 ... 178
Appendix Table 6: Pearson’s correlation coefficients among need variables in
Aim 1 ... 178
Appendix Table 7: Distribution of a categorical county-level pharmacy supply
measure in the Aim 1 cohort ... 178
Appendix Table 8: Sensitivity analysis results of generalized estimating equation
models of circumvention behavior when including county-level pharmacy supply,
county RUCC score, and Charlson score in their original continuous forms ... 179
Appendix Table 9: GLM models for Aim 2 outcomes among circumvented opioid
prescription fills, excluding subjects with coverage gaps ... 180
Appendix Table 10: Tabular survival ROC results—opioid fill count/unintentional
opioid overdose ... 182
Appendix Table 11: Tabular survival ROC results—opioid fill count/unintentional
acetaminophen overdose ... 183
Appendix Table 12: Tabular survival ROC results—opioid fill count/unintentional
overdose, any drug ... 184
Appendix Table 13: Tabular survival ROC results—opioid fill count/opioid use
disorder ... 185
Appendix Table 14: Tabular survival ROC results—opioid fill count/any substance
use disorder ... 185
Appendix Table 15: Tabular survival ROC results—pharmacy count/unintentional
opioid overdose ... 186
Appendix Table 16: Tabular survival ROC results—pharmacy count/unintentional
acetaminophen overdose ... 186
Appendix Table 17: Tabular survival ROC results—pharmacy count/unintentional
Appendix Table 18: Tabular survival ROC results—pharmacy count/opioid use
disorder ... 187
Appendix Table 19: Tabular survival ROC results—pharmacy count/any substance
use disorder ... 187 Appendix Table 20: Tabular survival ROC results—mean daily MME/unintentional
opioid overdose ... 188
Appendix Table 21: Tabular survival ROC results—mean daily MME/unintentional
acetaminophen overdose ... 189
Appendix Table 22: Tabular survival ROC results—mean daily MME/unintentional
overdose, any drug ... 189
Appendix Table 23: Tabular survival ROC results—mean daily MME/opioid use
disorder ... 190
Appendix Table 24: Tabular survival ROC results—mean daily MME/any substance
use disorder ... 190
Appendix Table 25: Tabular survival ROC results—mean daily APAP mg/
unintentional opioid overdose ... 191
Appendix Table 26: Tabular survival ROC results—mean daily APAP mg/
unintentional acetaminophen overdose ... 192
Appendix Table 27: Tabular survival ROC results—mean daily APAP mg/
unintentional overdose, any drug ... 193
Appendix Table 28: Tabular survival ROC results—mean daily APAP mg/opioid
use disorder ... 194
Appendix Table 29: Tabular survival ROC results—mean daily APAP mg/any
substance use disorder ... 195
Appendix Table 30: Describing application of selected opioid use criteria in Aim 3
validation sample for the secondary unintentional acetaminophen overdose outcome ... 198
Appendix Table 31: Describing application of selected opioid use criteria in Aim 3
validation sample for the secondary outcome of an unintentional overdose of any drug ... 199
Appendix Table 32: Describing application of selected opioid use criteria in Aim 3
validation sample for the secondary opioid use disorder outcome ... 200
Appendix Table 33: Describing application of selected opioid use criteria in Aim 3
validation sample for the secondary outcome of any substance use disorder ... 201
Appendix Table 34: Bivariate Cox proportional hazard model results estimating the
hazard of an unintentional acetaminophen overdose for each opioid use criterion ... 202
Appendix Table 35: Bivariate Cox proportional hazard model results estimating the
Appendix Table 36: Bivariate Cox proportional hazard model results estimating the
hazard of an opioid use disorder diagnosis for each opioid use criterion ... 204
Appendix Table 37: Bivariate Cox proportional hazard model results estimating the
hazard of any substance use disorder diagnosis for each opioid use criterion ... 205
Appendix Table 38: Kaplan-Meier estimates of unintentional acetaminophen
overdose event, by opioid use criterion, represented as absolute risk differences
and numbers needed to enroll ... 218
Appendix Table 39: Kaplan-Meier estimates of any unintentional overdose event,
by opioid use criterion, represented as absolute risk differences and numbers needed
to enroll ... 219
Appendix Table 40: Kaplan-Meier estimates of opioid use disorder diagnosis, by
opioid use criterion, represented as absolute risk differences and numbers needed
to enroll ... 220
Appendix Table 41: Kaplan-Meier estimates of any substance use disorder diagnosis,
by opioid use criterion, represented as absolute risk differences and numbers needed
LIST OF ABBREVIATIONS ACS Affiliated Computer Services
ADOPT Approaches to Drug Overdose Prevention Analytic Tool AHRF Area Health Resources File
APAP Acetaminophen AUC Area under the curve
CDC Centers for Disease Control and Prevention CMS Centers for Medicare and Medicaid Services CNCP Chronic non-cancer pain
CS Controlled substance
CSRS Controlled Substances Reporting System DEA Drug Enforcement Agency
DMA North Carolina Division of Medical Assistance
DRIVE North Carolina Data Retrieval Information and Validation Engine FDA Food and Drug Administration
FPL Federal poverty limit
GEE Generalized estimating equation
ICD-9 International Classification of Diseases, Ninth Revision
ICD-9-CM International Classification of Diseases, Ninth Revision, Clinical Modification MCO Managed care organization
MED Morphine equivalent dose (synonymous with MME) MLIP Medicaid lock-in program
MME Milligram morphine equivalents (synonymous with MED)
NC North Carolina
NC MLIP North Carolina Medicaid lock-in program NPI National Provider Identifier
PDMP Prescription drug monitoring program QIC Quasi-likelihood information criterion
RLP Wisconsin Medicaid Recipient Lock-in Program ROC Receiver operating characteristic
CHAPTER I: INTRODUCTION
1.1 OVERVIEW
Figure 1.1: Rates of opioid sales, deaths, and substance abuse treatment admissions (1999-2010)
Source: Centers for Disease Control and Prevention. Prescription painkiller overdoses in the US. November 2011; http://www.cdc.gov/vitalsigns/painkilleroverdoses/.
Much of the controlled substances used for nonmedical purposes are obtained through entirely legal prescribing and dispensing processes.7,8 The Centers for Disease Control and Prevention (CDC) estimate that nearly 85% of abused controlled substances were originally prescribed to the nonmedical user or to a friend or relative.1 The fact that legal distribution channels are a major source of abused medications creates an opportunity to mitigate the nonmedical use of controlled substances through policy intervention. Two of the most common policy strategies for identifying and preventing nonmedical controlled substance use occur on the state level: prescription drug monitoring programs (PDMP) and Medicaid lock-in programs (MLIP). Although the focus of this dissertation lies on evaluating the MLIP policy strategy, it is important to first understand the role of PDMPs for the purpose of establishing the current policy context in which MLIPs operate and also to lay a foundation for detailing this dissertation’s novel analytic approach, which leverages the breadth of PDMP data.
limitations of PDMPs include low utilization by providers and lack of interstate cooperation between state PDMP systems.10 When accessed by providers, though, the evidence indicates that PDMPs reduce
unnecessary controlled substance prescribing, prevent doctor- and pharmacy-shopping behaviors, and inform higher quality medical decision-making of controlled substance use.11-14
In a prior publication, I found that at least 46 states also operate MLIPs.15 MLIPs work by, first, identifying Medicaid beneficiaries exhibiting “high risk” controlled substance-seeking behaviors.16 Individual state MLIPs typically define high risk controlled substance use through assessment of the number controlled substance prescriptions received, as well as prescribers and pharmacies used in a given time period. Medicaid beneficiaries that exceed a state’s threshold for high-risk controlled substance use based on claims review are “locked in” to specific providers—usually one prescriber and pharmacy. This means that during periods of MLIP enrollment, Medicaid will only pay for a beneficiary’s controlled substance-related services if they were accessed through the designated lock-in providers.
The MLIP is intended to reduce prescription drug abuse burden in the Medicaid population by creating better care coordination among providers caring for patients with high-risk controlled substance use. Better care coordination is thought to ultimately prevent nonmedical use behaviors and adverse outcomes for the high-risk Medicaid beneficiaries enrolled in the program. Unlike PDMPs, however, the body of evidence supporting the MLIP policy strategy’s public health benefit in combating nonmedical prescription drug use is minimal. There has been little to no peer-reviewed research, to date, examining the effect of MLIPs on substance abuse and overdose-related outcomes. There are also noted limitations of the MLIP intervention that may potentially undermine the current and future benefits of MLIPs in improving care coordination and outcomes from high-risk controlled substance use.
knowledge, findings from this dissertation represented one of the first attempts to establish an MLIP evidence base. It is hoped this new knowledge will be leveraged to inform MLIP optimizations that enhance the public health benefit of this policy strategy in fighting the prescription drug abuse epidemic. 1.2 SPECIFIC AIMS
In October 2010, North Carolina (NC) Medicaid implemented the Recipient Management Lock-In Program (further referred to as the NC MLIP). The NC MLIP enrolled beneficiaries meeting at least one of the following eligibility criteria assessed over a period of two consecutive months: ≥7 opioid prescription claims, ≥7 benzodiazepine prescription claims, and/or ≥4 unique prescribers of these medications.17 NC MLIP enrollees were locked in to one prescriber and one pharmacy for a period of 12 months. The recent introduction of this program to the controlled substance abuse policy landscape in North Carolina—which has operated a PDMP called the Controlled Substances Reporting System (CSRS) since 2005—created a unique opportunity to contribute a rigorous MLIP examination to the peer-reviewed literature and inform state-level policy efforts to curb nonmedical prescription drug use.
The research evaluating the NC MLIP conducted herein was investigated under the umbrella of a parent project. The parent project was an interdisciplinary collaboration of researchers across the
University of North Carolina at Chapel Hill. It was funded by the Centers for Disease Control and Prevention (CDC) [PI: Asheley Skinner, Grant No. CDC U01 CE002160-01]. The aims of the parent project represented initial population-level policy evaluation questions. It included a qualitative process evaluation of NC MLIP administration and quantitative investigations of the population-level effect of the NC MLIP on the number of controlled substance prescription fills and overdose events in the NC
Medicaid population.
likely to be circumvented than others? and (3) What are the most effective claims-based measures for identifying high-risk beneficiaries for potential enrollment in the MLIP?
This dissertation used a novel dataset linking Medicaid claims data with records from the North Carolina CSRS, the state’s PDMP surveillance database. Because the PDMP captures data for all controlled substance prescriptions dispensed in the state regardless of payer, this merged dataset allowed observation of an MLIP enrollee’s complete controlled substance-seeking behavior, whether or not they adhered to the lock-in restrictions.
The specific aims of this dissertation were:
Aim 1: To examine the effect of the NC MLIP, as well as patient-level characteristics, on
controlled substance circumvention behaviors.
Controlled substance circumvention occurs when NC Medicaid beneficiaries purchase an opioid or benzodiazepine prescription entirely out of pocket without submitting a prescription claim to the Medicaid benefit. Although this behavior constitutes fraud when a Medicaid beneficiary is enrolled in the MLIP, circumvention can easily happen in situations where the MLIP enrollee visits a pharmacy and fails to inform the pharmacy of their Medicaid coverage. Also, a pharmacy may inappropriately allow the enrollee to pay the full cash price for the medication out of pocket despite knowledge of active Medicaid coverage. Circumvention of the MLIP restrictions has serious consequences for the intended public health impact of MLIPs. For MLIP enrollees that circumvent the program with the intent of abusing or diverting controlled substances, the ability to circumvent Medicaid fails to prevent access to these medications. For MLIP enrollees with legitimate medical need of controlled substances, circumvention may reflect the MLIP causing undue access barriers to necessary medications. In either case, circumvention undermines the ability of MLIPs to confer enhanced provider care coordination of these high-risk patients and it wastes state resources used to operate the MLIP.
This will inform opportunities for targeted improvements in MLIP design and operation. Analyses for Aim 1 utilized the novel Medicaid-CSRS linked dataset. This dataset allowed identification of
circumvention behavior. Circumvention was defined as the presence of an opioid or benzodiazepine prescription fill record in the CSRS dataset that lacked a corresponding prescription fill record in the Medicaid claims data. The study sample was a longitudinal cohort of adult NC MLIP enrollees with continuous NC Medicaid coverage. A retrospective cohort design with repeated monthly measures was used. We described patient-level characteristics of the study cohort and compared circumvention behavior trends across NC MLIP enrollment status through bivariate analyses. Generalized estimating equation (GEE) modeling estimated the relationship between NC MLIP enrollment, as well as select patient-level characteristics, with the likelihood and extent of circumvention at the person-month level. GEE leveraged the repeated monthly measures to account for time trends and control for within-subject correlation. The first GEE model utilized multivariable logistic regression to estimate the effect of MLIP enrollment and patient predictors on engaging in any circumvention behavior. The second GEE model examined the effect of MLIP enrollment and patient predictors on the number of circumvention fills obtained. Aim 2: To investigate prescription-level characteristics of opioid analgesics obtained by NC
MLIP enrollees through circumvention.
represent a group of opioids with the highest potency. Schedule II products include agents such as morphine, oxycodone, fentanyl, and methadone. Additionally, long-acting, or extended-release, opioid preparations have greater potential to contribute to overdose due to larger amounts of opioids contained within each dosing unit, as compared to short-acting products. Long-acting opioids include products such as Oxycontin tablets, transdermal fentanyl patches, and extended-release morphine capsules and tablets. Aside from Schedule II and long-acting qualities, the strength of a prescription opioid product and the prescribed quantity also play a major role in a prescription’s abuse and overdose potential.
The purpose of Aim 2 was to examine the effect of NC MLIP enrollment, as well as patient predictors, on prescription-level characteristics of opioid fills received through circumvention. Specifically, three prescription-level opioid characteristics were investigated: receipt of a Schedule II product vs. non-Schedule II, receipt of a long-acting opioid vs. short-acting opioid, and the amount of opioid product received in a prescription (measured as prescribed average daily milligram morphine equivalents). Collectively, these three outcomes capture the abuse potential of individual prescriptions received by NC MLIP enrollees. Analyzing trends in these prescription-level characteristics among circumvented opioid fills provided valuable knowledge for the extent to which circumvention behavior might contribute to downstream overdose outcomes, whether NC MLIP enrollment induced changes in utilization of certain opioid products, and prescription-level characteristics that may signal attractiveness for MLIP circumventers.
GLM analysis of these outcomes was performed in the sample of circumvented opioid fills. They were also performed in the Medicaid-covered opioid prescription fill sample and the combined sample of opioid fills from both payment sources in order to observe comprehensive trends in opioid utilization. Aim 3: To identify and validate the most effective measures of high-risk opioid analgesic use in
the NC Medicaid population.
Defining high-risk controlled substance use in the context of NC MLIP eligibility currently involves assessment of the number of controlled substance-related prescription fills and prescribers used in a given time period. However, when looking at MLIP eligibility criteria used across state Medicaid programs, there exists a remarkable lack of standardization with regard to the specific measures and thresholds used for assessing MLIP eligibility. And currently, there are no peer-reviewed studies in the literature providing evidence for the most effective strategy to define high-risk controlled substance use in the context MLIPs as it relates to notable meaningful public health outcomes.
Aim 3 analyses filled this gap in the MLIP literature by rigorously evaluating the effectiveness of various opioid exposure measures in predicting relevant clinical outcomes from high-risk opioid use. Results from this aim help establish best practices in MLIP design by informing strategies for identifying beneficiaries most likely to benefit from program enrollment from a public health perspective. Aim 3 employed a retrospective cohort design using Medicaid claims data from 10/1/2008 through 9/30/2010. The study cohort included adult NC Medicaid beneficiaries who recorded an opioid prescription claim in the first year of the study period. Survival receiver operating characteristic (ROC) modeling was
of any drug product, diagnosed opioid use disorder, and any diagnosed substance use disorder. High performing opioid exposure measures and their optimal thresholds identified in a randomly selected testing sample were validated in the remaining subjects. Performance of optimal measures in predicting the Aim 3 outcomes was assessed through descriptive analysis, Cox proportional hazard models, and Kaplan-Meier estimation.
1.3 SIGNIFICANCE
Medicaid lock-in programs represent a highly prevalent state-level strategy for combating the ongoing epidemic of prescription drug abuse in the United States. These policies are poised to reduce nonmedical controlled substance use and its consequences among Medicaid beneficiaries—a patient population known to experience greater rates of prescription drug abuse and overdose-related death.19-22 In fact, multiple academic and governmental sources, including the Office of the President of the United States, have explicitly identified MLIPs as a key tool moving forward in this fight.23,24 However, rigorous evaluations of MLIPs are largely absent from the literature. Any meaningful application of MLIPs in large-scale efforts to mitigate nonmedical use will require a deep understanding of what constitutes an effective MLIP design and how lock-in enrollment impacts patient outcomes.
Findings from this dissertation project contribute significantly to this field by rigorously
examining two important and previously uninvestigated MLIP limitations that may currently undermine the public health benefit of this policy. The first MLIP limitation is the problem of Medicaid
circumvention. Circumvention negates the intended effect of MLIP restrictions because it reflects a failure to regulate access to inappropriate use of controlled substances and obviates the care coordination that adherence to provider lock-in restrictions would provide. From a public health perspective,
MLIP population by investigating prescription-level characteristics of opioid analgesics obtained through circumvention. Aim 2 findings characterized whether certain opioid prescriptions were more attractive for circumvention and provided new understanding of the level of risky opioid use occurring outside the current reach of MLIP administrators. Both Aims 1 and 2 also identified patient-level predictors of their respective outcomes. This information will inform targeted MLIP design modifications and educational interventions of providers to improve adherence to MLIP restrictions and, ultimately, improve the quality of care and patient outcomes for Medicaid beneficiaries engaging in risky controlled substance use.
The second key MLIP limitation is reflected in the absence of any semblance of accepted definitions of high-risk controlled substance utilization in MLIP eligibility criteria. The findings from Aim 3 will help illuminate the most effective strategy or strategies for defining high-risk controlled substance use within the context of MLIP enrollment criteria. Validated MLIP eligibility criteria are necessary to ensure enrollment of beneficiaries most likely to benefit from this policy intervention. This information—along with lessons learned from using a novel dataset merging claims and PDMP data— will be invaluable in future efforts to create much-needed interoperable prescription drug abuse
monitoring tools that aggregate multiple relevant data sources across state lines.8,10,25-28 Lastly, the need for the evidence provided by this dissertation project concerning the effectiveness and optimal design of MLIPs is made all the more urgent by the recent and ongoing influx of millions of patients into the healthcare system as a result of expanded insurance coverage under the Affordable Care Act. Millions of newly insured Americans will gain coverage through Medicaid programs. With more Medicaid
CHAPTER II: BACKGROUND, LITERATURE REVIEW, AND CONCEPTUAL MODEL
Chapter II is presented in three sections. The first section provides background information regarding controlled substance pharmaceuticals; trends in the nonmedical use of prescribed controlled substances; prescription drug monitoring program and Medicaid lock-in program policy strategies for mitigating nonmedical controlled substance use; and a description of North Carolina’s PDMP and MLIP. The second section comprises a rigorous review of the literature evaluating MLIP-related outcomes and is followed by identification of gaps in the literature that motivate the research questions in Aims 1 and 2. The second section also reviews the body of evidence examining definitions of high-risk controlled substance use in prescription claims data, which provides a foundation for the investigations of Aim 3. The third section of Chapter II outlines a conceptual framework upon which analyses of the dissertation aims are based.
2.1 BACKGROUND
2.1.1 Introduction
This section details necessary background knowledge and establishes the public health and policy context in which the dissertation were developed. It provides a comprehensive overview of issues
pertaining to controlled substances, including regulation, utilization trends, and the major policy strategies currently used to address nonmedical controlled substance use in the United States and in North Carolina, specifically.
2.1.2 Overview of Controlled Substances
Controlled substances are classified into Schedules, ranging from Schedule I to Schedule V.30 The schedule decision is primarily informed by the degree of a drug product’s abuse potential. Designation as a controlled substance imposes stricter regulations on the accessibility of these medications. For example, Schedule II prescriptions cannot have refill authorizations and must be presented to the pharmacy in a hardcopy paper form. Table 2.1 describes characteristics of each controlled substance Schedule, as well as common medication classes and products in each.
Table 2.1: Summary of federal controlled substance schedules 30,31
Schedule Description Major drug classes Primary use Example generic drug products (Brand)
I No accepted medical use. High abuse potential and severe psychological or physical dependence
Illicit street drugs Recreation Marijuana, heroin, LSD
II High abuse potential but less than Schedule I drugs. Potential for severe psychological or physical dependence.
Opioid analgesics Stimulants
Pain ADHD
Oxycodone HCL (Oxycontin, Percocet);
fentanyl (Duragesic); Amphetamine salts (Adderall); methylphenidate HCL (Ritalin)
III Less abuse potential than Schedules I and II but more than Schedule IV. Moderate to low potential for psychological or physical dependence.
Opioid analgesics Pain Hydrocodone combination products (Vicodin); codeine products with <90mg/dose (Tylenol #3)
IV Low abuse potential. Low risk of dependence. Benzodiazepines Sedative/hypnotics Muscle relaxants Anxiety Insomnia Muscle spasms
Alprazolam (Xanax); diazepam (Valium)
Zolpidem tartrate (Ambien) Carisoprodol (Soma) V Lower abuse potential than
Schedule IV.
Codeine-based antitussives
Cough <200mg/mL codeine preparations (Robitussin AC)
Note: LSD=lysergic acid diethylamide; ADHD=attention deficit hyperactivity disorder; HCL=hydrochloride; mg=milligram; mL=milliliter
2.1.3 Controlled Substance Use Behaviors
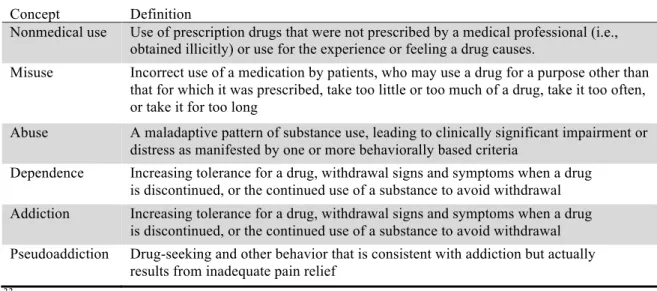
The increased abuse potential of controlled substances, along with their accessibility through legal channels, makes them prime targets for undesirable medication use behaviors among patient populations and the public at large.32 A constellation of terminology exists to describe ways in which individuals consume controlled substances outside of their intended purpose or directions for use. These include nonmedical use, misuse, abuse, dependence, addiction and pseudoaddiction.33 Table 2.2 provides definitions for each concept, as developed by the Substance Abuse and Mental Health Services
Table 2.2: Controlled substance utilization pattern definitions Concept Definition
Nonmedical use Use of prescription drugs that were not prescribed by a medical professional (i.e., obtained illicitly) or use for the experience or feeling a drug causes.
Misuse Incorrect use of a medication by patients, who may use a drug for a purpose other than that for which it was prescribed, take too little or too much of a drug, take it too often, or take it for too long
Abuse A maladaptive pattern of substance use, leading to clinically significant impairment or distress as manifested by one or more behaviorally based criteria
Dependence Increasing tolerance for a drug, withdrawal signs and symptoms when a drug is discontinued, or the continued use of a substance to avoid withdrawal Addiction Increasing tolerance for a drug, withdrawal signs and symptoms when a drug
is discontinued, or the continued use of a substance to avoid withdrawal Pseudoaddiction Drug-seeking and other behavior that is consistent with addiction but actually
results from inadequate pain relief 33
Nonmedical use represents the broadest definition of “risky” controlled substance utilization, allowing for the fact that these substances could have been obtained through legal means or through diversion.33 In this context, diversion means any method for distributing controlled substances, or obtaining controlled substances with the intent to distribute them, through illegal channels; this includes theft; forgery of prescriptions; receipt from friends or family members; or doctor- and pharmacy-shopping.34 Shopping behaviors refer to visiting multiple providers to illicitly obtain large quantities of controlled substances.35 Misuse behaviors are a subset of nonmedical use in which the medications were prescribed to the misusing individual. Abuse refers to patterns of nonmedical use or misuse that have escalated to the point of causing impairment or significant adverse health outcomes, such as overdose.36 2.1.4 Nonmedical Controlled Substance Use—Prevalence and Trends
Utilization of controlled substances grew exponentially in recent decades.37-39 In fact, the manufacture and sales of opioid analgesics quadrupled from 1999 to 2010.2 Not only did the number of prescriptions for controlled substances increase during this time compared to non-controlled
respectively, between 2000 and 2010.41 This growth has been driven in large part by a substantial, yet clinically controversial,43,44 increase in the prescribing of opioid analgesics to treat chronic non-cancer pain (CNCP) diagnoses.45-48 Controlled substances are now among the most commonly prescribed medications in this country; hydrocodone combination products have been the most frequently dispensed drug in the United States since the mid-2000s, with alprazolam, zolpidem, and oxycodone also ranking in the top 25.49
With the drastic increase in the controlled substance prescribing, it is not surprising that nonmedical use of controlled substances is highly prevalent in the United States.50 The annual National Survey on Drug Use and Health (NSDUH), sponsored by SAMHSA, found that 6.8 million people over the age of 12 reported nonmedical use of prescription drugs in the past month—mostly involving opioid analgesics.1 Nearly 16 million people reported nonmedical use in the past year. In addition, 750,000 Americans newly initiated nonmedical use of prescription drugs in 2012, alone. Estimates report four to six percent of adults use medications for nonmedical purposes at some point in their lifetime.1,51-53 While the NSDUH shows relatively stable incidence of reported nonmedical use over the past decade, other evidence shows an increasing trend. In 2013, Roland, et al found that diagnosed opioid abuse doubled among privately insured patients between 2005 and 2010.54 Research also suggests a significant shift in preference from illicit street drugs to the nonmedical use of controlled substances for recreational purposes.55,56 A 2013 national survey reported that nearly 30% of law enforcement agencies believe controlled substances pose the greatest drug threat, up from 10% three years prior.57
2.1.5 Nonmedical Controlled Substance Use—Clinical Outcomes
implicated in multi-substance overdose deaths due to its contribution to fatal respiratory depression.63 However, acute benzodiazepine overdoses rarely cause death when they are the single intoxicant.64 In 2008, there were over 20,000 deaths due to prescription drug overdoses in the United States; 75% of these were tied to opioid analgesics.2,4 This represented a four-fold increase in the prescription drug overdose death rate since 1999.4 Controlled substance overdoses are now the second-leading cause of unintended death in the United States behind motor vehicle accidents.3
2.1.6 Nonmedical Controlled Substance Use —Healthcare Utilization Outcomes
In addition to clinical outcomes, nonmedical controlled substance use is associated with increased utilization of costly healthcare services.37,39,54 SAMHSA’s Drug Abuse Warning Network found that, in 2011, 1.2 million emergency department visits stemmed from nonmedical prescription drug use.5 Of these, nearly one-third were directly tied to nonmedical use of opioid analgesics and over half involved multiple pharmaceutical agents. Between 2004 and 2011, the incidence of nonmedical use-related emergency department visits increased 183%.5 In 2011, White and colleagues found that opioid abusers were up to nine times more likely to be hospitalized, three times more likely to utilize emergency services, and they received up to four times as many prescription services compared non-abusing opioid users.65 As previously shown in Figure 1.1, there is a striking increase in utilization of healthcare services and deaths resulting from nonmedical use observed over the past decade.20
2.1.7 Nonmedical Controlled Substance Use —Economic Outcomes
costs annually68,69 up to $53 billion per year.6 The CDC reports this figure could actually be in excess of $72 billion annually.2
2.1.8 Nonmedical Controlled Substance Use —Trends in North Carolina
The effects of the nonmedical controlled substance use epidemic have been felt in North Carolina, specifically. Currently, rates of controlled substance sales, reported nonmedical use, and nonmedical use-related fatalities are in line with national averages.4,70 Most of the increase in nonmedical use fatalities were concentrated in rural Western North Carolina71, which is consistent with other literature investigating nonmedical use trends in Appalachian regions.72,73 Since 1997, the number of annual deaths in North Carolina due to controlled substance overdose increased around 200-300%74,75, claiming a total of 7,100 lives by 2008.71 Opioid analgesics and benzodiazepines were implicated in roughly 90% of these prescription overdose fatalities. Controlled substance overdoses in North Carolina were on pace to imminently (or perhaps already) surpass vehicular accidents as the leading cause of injury-related deaths in the state.74
2.1.9 Addressing Nonmedical Use Through Policy
infusing collaboration across local, regional, state, and Federal levels. A 2011 landmark report from the Office of the President of the United States, “Epidemic: Responding to America’s Prescription Drug Abuse Crisis,” recommended a four-pronged policy approach: improve patient and provider education about nonmedical use; proper medication disposal; stronger enforcement against “pill mill” prescribers; and smarter tracking and monitoring of controlled substance utilization behaviors.23
The attention drawn by the alarming trends of nonmedical controlled substance use in the US, coupled with the added momentum from Federal urging to address this problem, has led to many policy and practice changes in recent years. For example, many community-based organizations were created to provide direct comprehensive support and education to hard-struck areas.81,82 Prescription drug take-back initiatives have proliferated, which remove unused or unwanted pharmaceuticals from peoples’ homes that may have been misused or diverted otherwise.8384,85 In clinical practice, significant efforts have been made to reduce prescription forgery14,86, increase prescribing of abuse-deterrent opioid formulations87, and integrate substance abuse screening instruments into regular practice.88 Some of the most robust efforts to reduce nonmedical use of controlled substances happen through state-level policy strategies, namely prescription drug monitoring programs and, the policy strategy that is the focus of the proposed dissertation, Medicaid controlled substance lock-in programs.
2.1.10 Prescription Drug Monitoring Programs
Although this dissertation does not directly evaluate PDMPs, it is important to provide background on this strategy to fully understand the policy landscape in which MLIPs operates and to highlight how integrating PDMP and payer data—which is used for Aim 1 analyses—enhances the monitoring of risky controlled substance use.
PDMPs are electronic databases that aggregate controlled substance dispensing records in a state. They collect detailed information for controlled substance prescriptions dispensed by all community pharmacies within state lines regardless of the source of payment—out-of-pocket or payer-covered. Most states collect records for drugs in all Schedules II-V.89 PDMPs records typically include patient-,
and, in some cases, law enforcement agencies, are then able to register with the PDMP and access its data through online portals to view past controlled substance utilization patterns for patients under their care. The National Alliance for Model State Drug Laws identifies five primary purposes for implementing PDMPs: “(1) to support access to legitimate medical use of controlled substances, (2) to help identify and deter or prevent drug abuse and diversion, (3) to facilitate and encourage the identification, intervention with, and treatment of persons addicted to prescription controlled substances, (4) to help inform public health initiatives through outlining of use and abuse trends, and (5) to help educate individuals about PDMPs and prescription drug use, abuse, diversion, and addiction.”89
The concept of tracking state-level controlled substance dispensing dates back to the 1930s in California.10 However, the introduction of two federal grant programs90 in 2002 and 2005, as well as improved technology contributed to a recent proliferation of PDMPs. Currently, 49 states have enacted PDMP legislation and 47 operate active PDMPs.9
PDMPs form the cornerstone of the Office of the President’s 2011 initiative to improve the tracking and monitoring of controlled substance use.23 Despite some conflicting findings91, the available body of evidence generally indicates that PDMPs can successfully reduce controlled substance utilization, shopping behaviors, and improve prescribing practices.11-14,92-94 The primary limitations facing PDMPs at this date are limited provider engagement with the programs95-97, lags in data availability, and lack of data-sharing capabilities across state lines and with other key data streams like prescription insurance claims data.26
2.1.10.1 North Carolina Controlled Substances Reporting System
In 2005, the state of North Carolina passed PDMP legislation establishing the CSRS, which was later implemented in 2007.98 Prescribers and pharmacists are granted access to the CSRS, which collects records for all Schedule II through Schedule V controlled substances. CSRS data aggregates detailed patient-, prescriber-, pharmacy-, and prescription-level for each controlled substance prescription
Carolina pharmacies report controlled substance claims data to the CSRS weekly.99 A recent internal evaluation of providers’ experience with the CSRS found that 86% of provider respondents were registered with the program, and over 93% of providers had accessed the CSRS at least once in the previous three months.100
2.1.11 Medicaid Lock-In Programs
In addition to operating PDMPs, the vast majority of states (n=46) also operate controlled substance lock-in programs designed to identify, correct, and prevent high-risk nonmedical use behaviors in their Medicaid populations.15 (Medicaid was established in 1965 by Title XIX of the Social Security Act as a joint state and federally funded health insurance program for the poor and disabled.101) This is not surprising given Medicaid beneficiaries are particularly susceptible to nonmedical controlled substance use behaviors and its consequences.102 The rate of controlled substance prescribing among Medicaid beneficiaries increased two- to three-fold over the past 15 years.19,22,48 In fact, literature has shown Medicaid beneficiaries are up to twice as likely to receive an opioid analgesic prescription than privately insured or uninsured populations, when controlling for demographic and clinical
characteristics.21,103 Notably, Washington Medicaid beneficiaries had a six-fold risk of opioid-related death, accounting for half of all such events despite making up only 22% of the state’s population.20
stand to enjoy substantial economic savings from a reduction in unnecessary controlled substance-related services and avoidance of downstream clinical outcomes from nonmedical controlled substance use. 15
The legal foundation for MLIPs was established in 42 CFR 431.54(e). These rules provide a general framework for MLIPs16:
(e) If a Medicaid agency finds that a recipient has utilized Medicaid services at a frequency or amount that is not medically necessary, as determined in accordance with utilization guidelines established by the State, the agency may restrict that recipient for a reasonable period of time to obtain Medicaid services from designated providers only. The agency may impose these restrictions only if the following conditions are met:
(1) The agency gives the recipient notice and opportunity for a hearing (in accordance with procedures established by the agency) before imposing the restrictions.
(2) The agency ensures that the recipient has reasonable access (taking into account geographic location and reasonable travel time) to Medicaid services of adequate quality.
(3) The restrictions do not apply to emergency services furnished to the recipient.
The Federal rules only stipulate that MLIPs must inform candidates of the lock-in decision prior to their MLIP enrollment, must ensure reasonable access to quality Medicaid services, and must not impede access to emergency medical services. The rest of the program design decisions are left up to state Medicaid agencies. These decisions include the MLIP enrollment criteria, qualifying medication classes, which provider(s) MLIP enrollees get locked in to, and the duration of the lock-in period. Most MLIPs restrict enrollees to either one pharmacy or one pharmacy plus one prescriber. The lock-in period
21
Table 2.3: Enrollment criteria for states with publicly available Medicaid lock-in eligibility details (as of 2/22/14)a
State
Assessment
periodb Prescription criteria Prescriber criteria Pharmacy criteria Other criteria
Alaska Monthly for 2
consecutive months
Receipt of prescriptions with frequency ≥2 standard deviations of mean;
Receipt of prescriptions from ≥1 prescribers in total average daily doses exceeding those recommended in Facts & Comparisons
Provider referral
Colorado 3 months ≥3 drugs in the same therapeutic category; ≥16 prescriptions
≥3 pharmacies Provider referral
Idaho 60 days ≥6 benzodiazepine claims;
≥8 opiate claims; ≥3 tramadol claims; ≥480 tramadol tablets;
≥6 months of continuous muscle relaxant use
Use of "multiple" prescribers
Use of "multiple" pharmacies
"Excessive" ED use; Drug dependence or abuse history;
Provider referral
Kentucky 2 consecutive
180-day periods
≥10 different prescription drugs; ≥5 prescribers ≥3 pharmacies ≥4 ED visits for non-emergency; ≥3 different EDs used for non-emergency
Massachusetts 3 months ≥11 Schedule II-IV prescription fills; AND ≥4 prescribers; OR ≥4 pharmacies Michigan 3 months ≥5 claims for CS or muscle relaxants;
"Aberrant" CS utilization patterns over 1 year
≥2 prescribers for duplicate services
≥3 pharmacies ≥3 ED visits;
Repeat ED use with no follow-up; Repeat ED use for
non-emergency
Nevada 60 days ≥9 CS claims
New Hampshire (any three criteria)
90 days ≥3 drugs in same drug class;
Same/similar drug received from different pharmacies within 2 days;
100 units per prescription per 7-day supply
≥3 prescribers ≥3 pharmacies ≥2 ED visits
New Jersey NR ≥2 prescription fills "in excess of what any one prescriber would intend"
Use of "multiple" prescribers
Use of "multiple" pharmacies
Presentation of forged or altered prescription
North Carolina 2 consecutive months
≥6 benzodiazepine claims; ≥6 opiate claims
≥3 prescribers Provider referral
Oregon 6 months “Exhibit patterns of drug misuse” Use of "multiple"
prescribers to obtain same/similar drugs
22
Utah 12 months ≥6 CS prescription fillsc ≥3 prescribers ≥4 pharmacies ≥4 primary care providers visited;
≥4 specialists visited;
≥5 ED visits for non-emergency
Virginia 3 months Exceed 200% max therapeutic dose of drug
class or 100% max therapeutic dose of drug class from ≥2 prescribers for period ≥4 weeks; Duplicate prescription fills within 2 days on two separate occasions;
≥2 CS prescriptions from ≥2 pharmacies or ≥2 prescribers for period ≥4 weeks;
≥24 prescriptions; ≥12 CS prescriptions
≥3 prescribers; ≥2 physician visits for similar diagnoses within 2 days
≥3 pharmacies ≥3 ED visits for non-emergency; Provider referral;
Pattern of non-compliance
Washington (any two criteria)
3 months ≥10 prescriptions;
CS prescriptions from ≥2 prescribers (automatic eligibility if this criterion met)
≥4 prescribers ≥4 pharmacies Similar services from ≥2 providers
on same day; ≥10 office visits;
≥2 ED visits (automatic eligibility); “At risk” fraudulent behavior (automatic eligibility) West Virginia 60 days Suboxone therapy in last 30 days;
≥6 claims within single class with abuse potential;
≥6 claims from ≥3 classes with abuse potential; ≥16 claims for all drugs with abuse potential; "Doctor shopping" involving ≥6 claims for drug
with abuse potential from ≥3 prescribers filled at ≥2 pharmacies
≥3 prescribers of drugs
with abuse potential
History of dependence; History of poisoning/overdose
Wyoming NR ≥2 prescribers ≥2 pharmacies
Note: CS=controlled substance; ED=emergency department; NR=not reported. Information in this table reflects evidence identified in published literature and publicly available sources online.
a. Eligibility for lock-in enrollment contingent on meeting one individual criterion listed within the state, except where noted as otherwise.
b. Assessment of individual lock-in enrollment criteria occurs over the designated time period in this column, except where noted with criterion as otherwise. c. CS utilization criteria for Utah Medicaid Restriction Program assessed over time period shorter than 12 months, but exact duration unavailable