HEALTHY WORK ENVIRONMENTS: IMPROVING STAFF SATISFACTION AND EMPLOYEE PRODUCTIVITY IN A NON-TRADITIONAL NURSING WORK
ENVIRONMENT THROUGH EMPLOYEE RECOGNITION
Charles Michael Combs II
A dissertation submitted to the faculty at the University of North Carolina at Chapel Hill in partial fulfillment of the requirements for the degree of Doctor of Nursing Practice in the School
of Nursing.
Chapel Hill 2018
©2018
ABSTRACT
Charles Michael Combs II: Healthy Work Environments: Improving Staff Satisfaction and Employee Productivity in a Non-Traditional Nursing Work Environment Through Employee
Recognition
(Under the direction of Rebecca Kitzmiller)
Background: Meaningful recognition (MR), one of the six standards outlined by the American Association of Critical-Care Nurses for creating and sustaining a healthy work environment, is essential for improving individual and organizational outcomes. Employee recognition programs (ERPs), a subset of MR, are linked to improved employee performance, job satisfaction, and employee engagement and motivation. However, little evidence is available that specifically examines implementation of MR-based ERPs in non-traditional nursing settings and the resultant impacts.
Purpose: The purpose of this project was to evaluate the effectiveness and feasibility of implementing a non-monetary, MR-based ERP in a non-traditional nursing setting.
Results: Significant increases in job satisfaction (t = 2.39, p = 0.02), the health of the Medical Review work environment (t = 2.16, p = 0.04), and staff productivity (t = 7.96, p = 0.02) were noted. Participants agreed that the ERP was (1) meaningful (89.7%), (2) easy to use
(92.3%), (3) fair (89.7%), (4) beneficial to the department (87.2%), and (5) should become permanent (76.9%). Further, 89.7% of participants reported satisfaction with the ERP and the types of recognition given.
ACKNOWLEDGEMENTS
I owe this accomplishment to all my friends and family that stood by me and supported me along this awesome journey. I wouldn’t have made it very far without your love and support. I especially want to thank Tim Paschkewitz for always being there, listening to me, and
encouraging me along the way. Thank you for never letting me give up, even though I wanted to numerous times. Your love and support throughout the DNP program helped me realize my dreams and I couldn’t have done this without you! I also want to thank Tara Bass for being my confidant and most of all my friend. You were always available to listen, bounce ideas off of, and to tell me things would be ok. Your friendship and support throughout the DNP program and the DNP project were invaluable to me and I can’t thank you enough for everything! I also want to thank my friend and fellow classmate, Christine Weeks, for her friendship and support
throughout the DNP program. Lastly, I want to thank Alex Robbins and Jennifer Binkley, the two best friends a guy could have. Thank you for always being there for me when I needed you and for your love and support throughout this journey.
Carrie Palmer and Molly O’Toole. Thank you, Dr. Palmer, for stepping in during my time of need and for your support and guidance throughout both the DNP program and the DNP project. Thank you, Molly, for your support in continuing my education and your assistance in
facilitating the implementation of my project. I couldn’t have done this without you both. I also want to acknowledge all the faculty and staff at the UNC School of Nursing. I would not be here today without your guidance and support throughout the DNP program. I also want to acknowledge my professors specifically, for teaching me, providing new learning opportunities, and instilling in me the skills and knowledge necessary to become a nurse leader of tomorrow. I want to thank Dr. Julee Waldrop for instilling in me a love of research and for helping me grow my project idea into what it became. You never wavering support and kindness were truly special to me. I also want to thank Dr. Mary Lynn for your guidance, support, and knowledge of data analysis. The skills you instilled in me allowed me to look at data in a different light and to understand the tools necessary for data analysis. Thank you both for everything!
TABLE OF CONTENTS
LIST OF TABLES ... xii
LIST OF FIGURES ... xiii
LIST OF ABBREVIATIONS ... xiv
LIST OF SYMBOLS ... xvi
CHAPTER 1: INTRODUCTION ... 1
Background ... 1
Practice Problem Statement ... 2
Purpose Statement ... 3
CHAPTER 2: REVIEW OF LITERATURE ... 4
Search Strategy ... 4
Search Results ... 4
Healthcare Work Environments ... 4
Healthy Work Environments ... 5
Recognition ... 7
Meaningful Recognition ... 8
Employee Recognition Programs ... 10
CHAPTER 3: CONCEPTUAL AND THEORETICAL FRAMEWORK... 12
Lewin’s Theory of Change ... 12
Essential Points of Lewin’s Theory of Change... 12
Usefulness and Limitations ... 16
CHAPTER 4: METHODOLOGY ... 18
Methods... 18
Project Setting and Subjects... 18
Protection of Human Subjects ... 19
Employee Recognition Program Design ... 19
Program Implementation ... 20
Phase One: Pre-implementation ... 20
Phase Two: ERP Implementation and Monitoring ... 25
Phase Three: Post-implementation ... 26
CHAPTER 5: DATA ANALYSIS ... 28
Results ... 28
Demographics Data ... 28
Program Results ... 30
Job Satisfaction Survey ... 32
Healthy Work Environment Assessment Tool ... 34
Productivity ... 35
Employee Perceptions ... 37
CHAPTER 6: DISCUSSION ... 45
Discussion ... 45
Job Satisfaction ... 45
Healthy Work Environment ... 48
Productivity ... 51
Employee Perceptions ... 52
Lessons Learned ... 55
Sustainability ... 56
Recommendations ... 57
Implications for Research ... 57
Implications for Practice ... 58
Limitations ... 58
Dissemination ... 59
Conclusion ... 59
APPENDIX A: FORCE-FIELD ANALYSIS OF THE MEDICAL REVIEW DEPARTMENT ... 61
APPENDIX B: EMPLOYEE RECOGNITION PROGRAM DESIGN ... 62
APPENDIX C: DEMOGRAPHICS QUESTIONS ... 68
APPENDIX D: JOB SATISFACTION SURVEY ... 69
APPENDIX E: ADAPTED HEALTHY WORK ENVIRONMENT ASSESSMENT TOOL ... 72
APPENDIX F: EMPLOYEE PERCEPTION QUESTIONS ... 75
APPENDIX G: UNIVERSITY OF NORTH CAROLINA AT CHAPEL HILL’S IRB APPROVAL ... 76
LIST OF TABLES
Table 1. Subject-Generated Identification Code (SGIC) and Question Set... 22
Table 2. Demographic Data ... 29
Table 3. Awards Received Per Team ... 31
Table 4. Job Satisfaction Survey – Paired Samples t-Test Results and Paired Samples Statistics ... 33
Table 5. Healthy Work Environment Assessment Tool – Paired Samples t-Test Results and Paired Samples Statistics ... 35
Table 6. The Types of Recognition were Meaningful to Me ... 37
Table 7. Overall, I was Satisfied with the Employee Recognition Program... 38
Table 8. The Employee Recognition Program was Easy to Use... 39
Table 9. The Selection Criteria were Fair to all Participants ... 40
Table 10. The Employee Recognition Program was Beneficial to the Department ... 42
Table 11. The Employee Recognition Program Should Become a Permanent Addition to the Medical Review Department ... 43
Table 12. Mean Scores for Employee Perceptions of the Employee Recognition Program’s Meaningfulness and Effectiveness ... 44
Table D1. Job Satisfaction Scale ... 69
Table D2. Job Satisfaction Subscale Item Numbers ... 71
Table E1. Adapted Healthy Work Environment Assessment Tool ... 72
LIST OF FIGURES
Figure 1. Average Productivity by Week ... 36
Figure 2. Average Productivity per Team by Week ... 36
Figure A1. Force-Field Analysis of the Medical Review Department ... 61
Figure B1. Shining Star Award Nomination Form ... 65
Figure B2. Shining Star Award Certificate... 66
LIST OF ABBREVIATIONS AACN American Association of Critical Care Nurses BCBS NC BlueCross and BlueShield of North Carolina
BCBSNC-MRD BlueCross and BlueShield of North Carolina Medical Review Department DNP Doctor of Nursing Practice
ERC Employee Recognition Committee
ER Employee Recognition
ERP Employee Recognition Program
ERPs Employee Recognition Programs
FFA Force-Field Analysis
HWE Healthy Work Environment
HWEAT Healthy Work Environment Assessment Tool
HWEs Healthy Work Environments
IHI Institute for Healthcare Improvement IOM Institute of Medicine
IRB Institutional Review Board
JSS Job Satisfaction Survey
MR Meaningful Recognition
MRD Medical Review Department
NHSR Not Human Subject Research
PI Primary Investigator
LIST OF SYMBOLS
β Beta Coefficient
M Mean
CHAPTER 1: INTRODUCTION Background
Evidence suggests that healthy work environments (HWEs) positively impact employee satisfaction, recruitment, productivity, retention, and engagement; and are linked to
organizational success and financial viability (Cornett & O’Rourke, 2009; Lowe et al., 2003; Pearson et al., 2007; Raziq & Maulabakhsh, 2014; Vollers, Hill, Roberts, Dambaugh, & Brenner, 2009). In 2005, the American Association of Critical-Care Nurses (AACN) began a campaign to improve the working environments of nurses because of the association between work
environment, nurse satisfaction and retention, and patient outcomes. The six essential elements for creating and maintaining a HWE include: skilled communication, true collaboration,
effective decision-making, appropriate staffing, authentic leadership, and meaningful recognition (MR) (AACN, 2005). Meaningful recognition, defined as valuing and rewarding work well done, often occurs through formal employee recognition programs (ERPs) (e.g. supervisor and/or peer recognition, monetary and/or non-monetary rewards) and is associated with improved
of Nursing Practice (DNP) project will examine the feasibility and effectiveness of an ERP among staff at a non-traditional nursing work setting, BlueCross and BlueShield of North Carolina (BCBS NC).
Practice Problem Statement
Lack of a healthy work environment (HWE), defined as safe, supportive, satisfying, and empowering, results in increased staff turnover, worker stress, increased errors, and greater job absenteeism (Aiken et al., 2008; Erenstein & McCaffrey, 2007; Heath et al., 2004). Virtual work environments may further contribute to poor employee experiences due to increased feelings of professional and social isolation and decreased employee engagement and motivation (Caillier, 2012; Felstead, Jewson, Phizacklea, & Walters, 2006; Kurland & Cooper, 2002; Sardeshmukh, Sharma, & Golden, 2012). Nurses increasingly work in nontraditional settings, such as call centers, telehealth, and insurance companies where virtual work is common. Because these settings and virtual work differ dramatically from more traditional work settings (e.g.,
ambulatory or acute care), nurses may be particularly vulnerable to the negative consequences of social isolation. Meaningful recognition (MR), one of the six standards outlined by the American Association of Critical-Care Nurses (AACN) for creating a healthy work environment, examines how employees are rewarded for the work they do and the value they provide to an organization (Vollers et al., 2009). Evidence suggests that MR and employee recognition programs (ERPs), a subset of MR, positively impact productivity, job satisfaction, and employee engagement and motivation (Akafo & Boateng, 2015; Ali & Ahmed, 2009; Darling, Arn, & Gatlin, 1997; Grochow, 2012; Lefton & Breugger, 2009; Tessema, Ready, & Embaye, 2013; Ulrich et al., 2006).
The BlueCross and BlueShield of North Carolina Medical Review department
productivity-based environment, the majority of staff work from home with limited daily interactions. Current BCBSNC-MRD productivity measures indicate that greater than 40% of staff are not fully productive. Productivity directly impacts overall staff and departmental performance. Furthermore, recent focus group and survey data (June, 2018) indicated that staff desire
increased recognition and acknowledgment for their work beyond existing monetary incentives. Feelings of isolation and separation among BCBSNC-MRD staff may contribute to poor
productivity rates and the desire for increased recognition. Therefore, translating the HWE Meaningful Recognition (MR) standards to this environment through the implementation of an employee recognition program (ERP) may positively affect employee satisfaction, productivity, and ultimately improve the overall health of the work environment.
Purpose Statement
The purpose of the project was to evaluate the effectiveness of an ERP to improve staff satisfaction, productivity, and the overall health of the BCBSNC-MRD work environment.
Questions
Four questions guided the development of this project:
1. How does an ERP effect job satisfaction among BCBSNC-MRD staff?
2. How does an ERP effect overall work environment health within Medical Review? 3. How does an ERP effect Medical Review work productivity?
CHAPTER 2: REVIEW OF LITERATURE Search Strategy
PubMed, CINAHL, Google Scholar, and Business Source Premier databases were searched using the keywords: healthy work environment, meaningful recognition, employee recognition program, employee productivity, and staff satisfaction. Inclusion criteria for screening and full-text review included articles from peer-reviewed journals in the English language. Articles examining only monetary forms of recognition were excluded. To specifically target articles related to the AACN HWE framework and standards, a filter was applied to identify the phrase “healthy work environment”. Keywords were combined to examine the impacts of ERPs on the outcome measures of productivity and staff satisfaction.
Search Results
Searches produced 317 articles. Following the removal of duplicates and application of inclusion and exclusion criteria, 62 articles were retained and read in their entirety. Of these, 44 articles met inclusion and exclusion criteria and were included in the review of the literature. Healthcare Work Environments
Over the past two decades, the Institute of Medicine (IOM) and others focused
Association of Critical-Care Nurses (AACN) released the AACN Standards for Establishing and Sustaining Healthy Work Environments: A Journey to Excellence (2016). This report, built upon 10 years of research, “responded to mounting evidence that unhealthy work environments contribute to medical errors, ineffective delivery of care, and conflict and stress among health care professionals” (AACN, 2016, p. 1). The AACN proposed six standards essential to creating and maintaining a HWE: skilled communication, true collaboration, effective decision making, appropriate staffing, MR, and authentic leadership (AACN, 2005; AACN, 2016). Although applicable to all work environments, the majority of nurse-focused HWE research targeted improving the healthcare work environment and increasing job satisfaction, patient care outcomes, and staff retention in acute care settings (Huddleston, 2015). The importance of the healthcare work environment on care quality gained further prominence when the Institute for Healthcare Improvement (IHI) expanded the Triple Aim framework to include a fourth aim focused on improving the healthcare work environment (Berwick, Nolan, & Whittington, 2008; Bodenheimer & Sinsky, 2014; Sikka, Morath, & Leape, 2015) in response to “widespread burnout and dissatisfaction” felt by many healthcare workers and the resultant negative impacts on patient outcomes (Bodenheimer & Sinsky, 2014, p. 1).
Healthy Work Environments
p = 0.016), characteristics of UWEs, significantly negatively impact productivity (Letvak & Buck, 2008; Nayeri, 2009).
Although, the definition of a HWE varies, Shirey’s (2006) definition predominates research. A HWE is “a work setting in which policies, procedures, and systems are designed so that employees are able to meet the organizational objectives and achieve personal satisfaction in their environment” (p. 258). A HWE is supportive, productive, joyful, satisfies personal needs, and allows employees to realize their full potential (Kramer & Schmalenberg, 2008; Shirey, 2006). A HWE represents the cumulative effects of many interconnected variables related to organization structures and processes that together combine to shape the nursing work environment (Alspach, 2009).
Healthy work environments impact both individual and organizational outcomes
including job satisfaction, recruitment, productivity, retention, and engagement; and are linked to the financial success and sustainability of an organization (Bai, 2015; Cornett & O’Rourke, 2009; Lowe et al., 2003; Pearson et al., 2007; Raziq & Maulabakhsh, 2014; Vollers et al., 2009). Bai (2015) examined the impacts of HWEs on overall job satisfaction and found a statistically significant correlation (r = 0.53, p < 0.01) between HWEs and job satisfaction. Lowe et al. (2003) and Raziq & Maulabakhsh (2014) found that HWEs are a statistically significant predictor of job satisfaction (r = 0.56, p < 0.01 and r = 0.363, p < 0.05 respectively).
Third, collaboration and communication are inherent in the organizational culture, employees are valuable assets, and organizational decisions are not based solely on financial gains. Fourth, HWEs encourage physical and emotional safety. The work environment is familial and happiness results from teamwork and the organization as a whole (Shirey, 2006).
The majority of HWE research occurred in critical care settings by Ulrich and colleagues (Huddleston, 2015). In 2006, 2008, and 2013, critical care nurses were surveyed on their
perceptions of their work environment to first gain a baseline understanding of the AACN HWE standards in practice and then to capture trends (Ulrich et al., 2006; Ulrich et al., 2009; Ulrich et al., 2014). The 2013 results suggested that the health of critical care nursing work environments declined as compared to the previous year’s results (Ulrich et al., 2014). The results are
surprising based on continued HWE initiatives but provide evidence that HWEs remain relevant and deserve attention.
Recognition
Defined as “the acknowledgment, appreciation, or approval of the positive
Meaningful Recognition
Meaningful recognition, an essential component of a HWE, goes beyond general recognition in that MR acknowledges individual behaviors and the resultant impact these behaviors have on others, ensuring that “feedback is relevant to the recognized situation, and is equal to the person’s contributions” (Lefton, 2012, p. 331). Therefore, MR represents workplace feedback that examines how employees’ work contributes to the organization and is rewarded (Vollers et al., 2009). Meaningful recognition must be individualized and based on the
uniqueness of the recipient (AACN, 2016). When MR lacks congruence, it may be perceived as disrespectful and viewed as a form of tokenism (AACN, 2016). Effective MR is a continual process and not a single event and therefore must become engrained in the workplace culture (AACN, 2005).
Meaningful recognition-based programs contain six elements essential for success
(AACN, 2005; AACN, 2016). First, for recognition programs to achieve effective outcomes and to maintain sustainability, they must be formalized with detailed processes and structures.
Second, staff education must address the programmatic details and processes for participation. Third, the MR program must include all organizational levels (from staff to executive level) and remain consistent regardless of the recipient. Fourth, the MR program must have built-in
processes to ensure recognition methods remain meaningful. Fifth, active participation in the MR program is expected of all employees. Sixth, the MR program includes methods for regular evaluation and revision. Combined, these elements help to ensure that MR becomes permanently engrained within the organizational culture (AACN, 2005; AACN, 2016).
Akerboom, and Verhoeven (2005) found a significant correlation between MR and job
satisfaction (β = 0.23, p < 0.001) and identified managerial support as a significant predictor of job satisfaction (β = 0.12, p < 0.001) (Gelsema et al., 2005). Ajala (2012) found that MR is the most significant (M = 3.32) predictor of employee productivity. Further, 79% of respondents agree that MR was a motivating factor for increased productivity and greater job performance (Ajala, 2012).
The AACN (2005) states that “recognition of the value and meaningfulness of one’s contribution to an organization’s work is a fundamental human need and an essential requisite to personal and professional development. People who are not recognized feel invisible,
processes and clear performance guidelines relavent to those being recongized (Zwickel et al., 2016).
Employee Recognition Programs
Effective ERPs positively impact productivity, job satisfaction, and employee
engagement and motivation, and are linked to improved organizational effectiveness and overall performance and success (Akafo & Boateng, 2015; Ali & Ahmed, 2009; Darling et al., 1997; Manzoor, 2012; Shonubi et al., 2016; Tessema et al., 2013). Among non-healthcare employees, employee recognition is associated with increased job satisfaction and improved motivation (r = 0.92, p < 0.01) (Ali & Ahmed, 2009). Among multinational university students, employee recognition is a statistically significant predictor of job satisfaction (r = 0.25, p <0.001), regardless of income level or cultural background (Tessema et al., 2013). Among temporary employees, employee recognition, given in the form of thank-you cards, significantly increased performance and productivity (p < 0.01), by as much as 10%, in response to the recognition. This study highlights that simple, non-monetary forms of recognition may be successful for increasing employee performance and productivity (Bradler et al., 2016).
Non-monetary forms of recognition are underutilized (Tessema et al., 2013), though they represent a cost-effective means of improving job satisfaction and employee performance
(Shonubi et al., 2016). Non-financial recognition may be given more frequently, to more recipients, with generally little or no associated cost. Survey results show that four of the five most influential employee incentives are non-monetary and that employees rank manager-initiated forms of recognition as the most rewarding and motivating (Luthans, 2000). Simple gestures such as a handshake or pat on the back are highly meaningful to employees (Tessema et al., 2013). Data from recent BCBS NC focus groups and surveys (June, 2018) shows that
over monetary incentives. Examples of non-monetary forms of recognition include personal congratulations, handwritten notes, recognition in public forums, and meetings that acknowledge successes (Bradler et al., 2016; Luthans, 2000). Although the evidence clearly supports the benefits of employee recognition, it remains largely underutilized by many organizations including those the employ nurses (Neckermann & Frey, 2013).
Expanding on the earlier work of Nelson (1995), Luthans (2000) outlines four
CHAPTER 3: CONCEPTUAL AND THEORETICAL FRAMEWORK Lewin’s Theory of Change
Effective ERP implementation and sustainment require organizational change. Lewin’s Theory of Change was selected as the theoretical framework for understanding the forces
impacting change (1947). Since change is difficult for individuals and organizations (Society for Human Resource Management, 2018), Lewin’s Theory provides a reliable foundation for
understanding change and ensuring that change is sustainable.
Essential Points of Lewin’s Theory of Change
Grounded in social psychology, Lewin’s Theory of Change has two major elements: force-field analysis (FFA) and Three Phases of Change Model (Miner, 2007; Sarayreh, Khudair, & Barakat, 2013). For this project, FFA was used (1) to examine both the driving forces and restraining forces impacting change within the Medical Review department (MRD) and (2) to develop ERP implementation strategies that promoted the driving forces and reduced the restraining forces of change (Shirey, 2013). Additionally, Lewin’s Three Phases of Change Model served as the program implementation framework to promote sustainability.
equilibrium so that past behavior is unlearned and new behavior is accepted (Sarayreh et al., 2013). Moving represents the transition to a more acceptable level of behavior and involves the internal struggle to change (Burnes, 2004). Freezing refers to establishing a new equilibrium to prevent regression back to old behaviors (Burnes, 2004).
Lewin’s Theory of Change offers a step by step approach to project implementation and the Change Model framework accounts for activities that occur during each phase of change (Bozak, 2003). The project’s primary investigator (PI) utilized the FFA to determine the forces impacting change and to develop both change and sustainment strategies. Lewin’s Theory of Change has been used extensively in nursing for change implementation and is considered a strategic nursing resource for bringing about organizational change (Shirey, 2013). McGarry et al. (2012) utilized Lewin’s Theory of Change to promote simulation in child and adolescent psychiatric nursing settings. Lewin’s Theory of Change has been widely used in organizational development and ties in well with the corporate nature of the project setting (Burnes, 2004). Lewin’s theory was selected because it adds organization and a systematic approach to change implementation, focuses on the importance of engaging frontline staff, and helps to ensure the project implementation is successful.
Force-Field Analysis
historical patterns of staff change resistance, poor staff participation in other organizational programs, lack of financial resources to implement and sustain an ERP, staff’s fear of the unknown, and potential conflict between an ERP and existing corporate monetary forms of recognition. For planned change to occur, the driving forces must outweigh the restraining forces so that a new equilibrium state is reached (Lewin, 1947; Figure A1, Appendix A).
Force-field analysis also includes the concept of change agent, defined as any “individual or group that undertakes the task of initiating and managing change in an organization”
(Lunenburg, 2010, p. 1). BlueCross and BlueShield of North Carolina extensively uses change agents; therefore, incorporating a change agent within the project was congruent with current corporate practices. A change agent promotes the driving forces for change and facilitates the disruption of the current equilibrium (Kaminski, 2011). Change agent activities increase the likelihood of achieving the new desired state by providing support throughout each of the three phases of change and acting as change process experts (Kaminiski, 2011). In addition to the project PI, change agents were selected from across the MRD teams to aid in facilitating planned change processes as this strategy was expected to facilitate staff buy-in and promote
implementation success. These change agents served as the ERP recognition committee and reviewed recognition submissions and selected awardees.
Three Phases of Change Model
During the unfreezing phase, the practice problem or change focus was identified (Sutherland, 2013). In this preparatory phase, all stakeholders impacted by the change process were determined (Bozak, 2003). For MRD, stakeholders included medical review analysts, clinical support specialists, clinical education consultants, and the management team. In order to build trust and ensure that staff feel secure with the change process, open and honest
frontline staff in planning and decision-making processes fosters empowerment and reduces internal resistance to change and allows staff to understand that change is beneficial (Sutherland, 2013). The FFA was completed to identify the driving and restraining forces (Bozak, 2003). Once the forces impacting change were identified, the PI devised strategies to promote driving forces and reduce restraining forces and included involving the Medical Review staff during each phase of program implementation, periodically informing staff about project progress, holding frequent meetings with the staff to foster communication and encourage participation, and communicating the BCBSNC-MRD management’s commitment to the project with the staff (Bozak, 2003).
The freezing phase represented a “period of stability and evaluation” (Bozak, 2003, p. 84) where project planning and implementation phases were complete. Central to this phase was ensuring that change remained permanent (Kaminski, 2011). Change agents continued to provide support to all stakeholders (Sutherland, 2013). Once the change process was complete and the PI determined stability, the PI began to withdraw from the project. Change agents within the MRD were entrusted with providing continued assistance and support (Bozak, 2003). Finally,
evaluation and dissemination of the results, successes, and challenges throughout project
implementation and future project plans were discussed (Sutherland, 2013). It is during this time that the program was evaluated and recommendations on continuation were made.
Usefulness and Limitations
Lewin’s Theory of Change is very useful for program implementation, particularly in change-resistant environments. It offers a framework for implementing planned change through the three-step model and allows examination of the forces impacting change via the FFA. Knowing the forces impacting change allows the PI to design strategies that promote the driving forces and reduce the restraining forces. This helps to ensure that planned change is successful and sustainable. The use of change agents helps to ensure program longevity and provides support and guidance to staff long after the PI has withdrawn.
CHAPTER 4: METHODOLOGY Methods
This DNP project examined implementation feasibility and ERP effect on job satisfaction, productivity, and the work environment perceptions among staff from a non-traditional nursing work setting.
Project Setting and Subjects
This project was conducted in the Medical Review department at BCBS NC, a not-for-profit health insurance company headquartered in Durham, North Carolina with major operations centers in Durham, Winston-Salem, and Fayetteville, as well as an office in Charlotte. BlueCross and BlueShield of North Carolina served over 3.89 million members and employed over 4,700 employees (BCBS NC, 2018a). Written permission to implement this DNP project was obtained from BCBS NC on April 26, 2018.
The Medical Review department at BCBS NC consisted of 60 staff members (at the time of project completion), divided into five teams consisting of 11 to 16 staff members. Job titles included medical review analysts, senior medical review analysts, dental analysts, clinical support specialists, clinical education consultants, team leads, a senior divisional compliance consultant, and a manager. The majority of staff worked from home and all department-wide meetings were conducted virtually with high attendance. The management team worked both from home and in-office and had representation in both the Durham and Winston-Salem
claim reviews. Review types include medical necessity, pricing, dental, investigational, benefit-based, and high dollar reviews.
Protection of Human Subjects
The DNP project proposal was submitted to the University of North Carolina at Chapel Hill’s Institutional Review Board (IRB) (IRB# 18-1163) and was classified as Not Human Subjects Research (NHSR) on May 4, 2018 (Appendix G).
Employee Recognition Program Design
All existing recognition programs in the BCBSNC-MRD were monetary. Most forms of monetary recognition were private and not known outside the manager and the employee and were given infrequently (e.g. once a year). The ERP in this project utilized the four
characteristics of effective ERPs outlined by Luthans (2000) as a framework and adapted strategies used at the University of North Carolina at Chapel Hill (UNC) and the Massachusetts Institute of Technology’s best practices for designing and maintaining employee recognition programs (Massachusetts Institute of Technology [MIT], n.d.; UNC, n.d.; Appendix B). These models were selected for their clarity and detail regarding the activities that occur within each ERP stage. Further, they represented a solid framework to build upon and adapt to fit the needs of the MRD.
The ERP design consisted of eight stages:
1. Stage One: Identify the Program’s Purpose 2. Stage Two: Identify the Program’s Goals
7. Stage Seven: Determine Recognition Type and Publicity 8. Stage Eight: Conduct Program Monitoring and Evaluation
The project utilized the following non-monetary forms of recognition to increase the number of people being recognized: email blasts to the department, computer-generated
certificates of recognition, and mailing of small keepsakes, like a gold star pin, to the recipients as recommended by Luthans (2000). A recognition committee was formed to review and vote on each recognition submission and met on a weekly basis to ensure that recognition was given timely and as soon as the desired behavior was noted. As recommended by Luthans (2000), recognitions were delivered by departmental management and also a committee of their peers, to enhance meaningfulness. The recognition committee reviewed each submission and assessed merit based on the submission criteria. This was to ensure that recognition reinforced desired behaviors and that recognition was not given falsely. Finally, during the evaluation phase, employees were surveyed to determine if selected non-monetary forms of recognition were meaningful to them. Based on the results, the forms of recognition may be altered upon project completion and new forms instituted during the next iteration.
Program Implementation
Program implementation occurred in three phases: pre-implementation (May 2018), implementation and monitoring (May-August 2018), and post-implementation (August-September 2018).
Phase One: Pre-implementation
department during a virtual meeting, during which time, MRD staff received a brief overview of HWEs, MR/ERPs and their benefits, MRD ERP processes, and how to submit the recognition forms; (3) purchasing necessary supplies (e.g. gold star pins); and (4) collecting baseline participant demographics, productivity, job satisfaction, and AACN HWE Assessment data (Appendix B).
Participant Demographics. To describe project participants and explore the differences between participants, demographics data, including BCBS NC position, length of employment (both in Medical review and at BCBS NC), education level, and age, were collected via online Qualtrics self-report survey (Appendix C).
Subject-Generated Identification Code. A six-element Subject-Generated
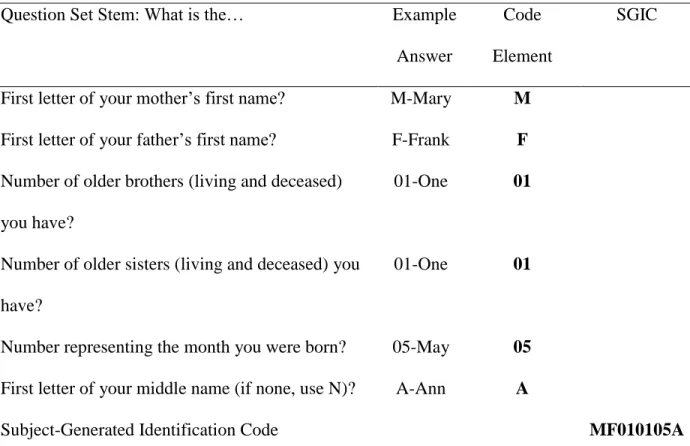
Table 1. Subject-Generated Identification Code (SGIC) and Question Set
Question Set Stem: What is the… Example
Answer
Code Element
SGIC
First letter of your mother’s first name? M-Mary M First letter of your father’s first name? F-Frank F Number of older brothers (living and deceased)
you have?
01-One 01
Number of older sisters (living and deceased) you have?
01-One 01
Number representing the month you were born? 05-May 05 First letter of your middle name (if none, use N)? A-Ann A
Subject-Generated Identification Code MF010105A
Note. Adapted from Ensuring anonymity by use of subject-generated identification codes, S. P. Damrosch (1986) & The use of self-generated identification codes in longitudinal research, by L. A. Yurek, J. Vasey, & D. S. Havens (2008).
medical necessity reviews. For nursing staff, a goal of 19.5 items per day or 97.5 items per week was interpreted as 100% productive. For dental analysts and clinical support staff, a goal of 39 items per day or 195 items per week was interpreted as 100% productive. An Excel spreadsheet, with embedded formulas was used to enter, calculate, and tabulate the productivity data. These data were provided by BCBS NC before, during, and following implementation, and used to assess the impact of the ERP on participants work. During the pre-implementation period, greater than 40% of staff were not meeting the departmental productivity standard of 95%.
Example productivity calculation. John Doe was a commercial medical review analyst. Last week, he completed 120 medical necessity reviews. John worked five days last week and had no additional non-productive time (6.5 x 5 = 32.5 productive hours for the week). To be 100% productive, John should have completed 97.5 reviews (32.5 x 3 [productivity rate per hour for medical necessity]). Since John completed over his goal, his productivity was 123%
(120/97.5 x 100%).
Job Satisfaction Survey data was collected via an online Qualtrics self-report survey at baseline and the conclusion of the ERP pilot period. The JSS consisted of 36 items divided into nine subscales (Table D2, Appendix D). Subscales included pay, promotion, supervision, fringe benefits, contingent rewards, operating procedures, coworkers, nature of work, and
communication. Participants rated each item on a six-point Likert scale ranging from disagree very much (1) to agree very much (6). Mean scores for each subscale and the total satisfaction score were interpreted using the scale of “dissatisfaction” (M ≤ 3.00), “ambivalence” (M = 3.01-4.00) and “satisfaction” (M > 3.01-4.00) (Spector, 1994).
Healthy Work Environment Assessment. Developed by the AACN in 2005 to evaluate a work environment on the six AACN HWE standards, the Healthy Work Environment
Assessment tool (HWEAT) was used to identify specific areas for workplace improvement and to evaluate progress towards meeting the HWE standards (AACN, n.d.). The HWEAT data was collected via an online Qualtrics self-report survey at baseline and following implementation of the ERP. Per the AACN, “questions and scales have been reviewed for face validity and
administered to two groups of 250 subjects each. Both samples were tested for reliability and showed internal consistency with identical factor structures and Cronbach's Alpha scores of 0.80 or better” (AACN, n.d., para. 6). Reliability was replicated and convergent and discriminant validity was established “using well-known surveys as benchmarks to test against the subscales” (AACN, n.d., para.7).
E2, Appendix E). The six subscales represent the AACN HWE standards: skilled
communication, true collaboration, effective decision making, appropriate staffing, meaningful recognition, and authentic leadership (AACN, n.d.). Participants rated each item on a five-point Likert scale ranging from strongly disagree (1) to strongly agree (6) (AACN, 2015). Mean scores for each subscale were calculated and interpreted using the scale of “needs improvement” (M = 1.00-2.99), “good” (M = 3.00-3.99), and “excellent” (M = 4.00-5.00) (AACN, n.d.).
Phase Two: ERP Implementation and Monitoring
During phase two, the ERP was implemented and executed over a three-month period. The ERC met weekly to review recognition submissions and voted based on the selection criteria (Stage Five, Appendix B). Because recognition should be timely and occur as soon as possible after the desired behavior was noted, the ERC met weekly. The time lapse between behavior and recognition reduces its inherent value (Luthans, 2000). For each selected awardee, the following recognition strategies were employed:
1. Email blast sent to the entire department notifying the staff of the recognition award. The email blast included the person being recognized, the nominator, and a brief description of the recognition reason.
2. Shining Star Award certificate was generated and emailed to the employee (Figure B2, Appendix B).
3. Gold star pin was mailed to the employee or delivered in person (depending if worker was in office or work-from-home) (Figure B3, Appendix B).
Phase Three: Post-implementation
Phase three occurred at the conclusion of the three-month pilot period. During this phase, participants completed the JSS, HWEAT, and provided perceptions about the ERP and its
meaningfulness via Qualtrics survey. Following data analysis, findings and recommendations about the future of the program were disseminated via a virtual MRD meeting.
Subject-Generated Identification Code. A six-element Subject-Generated
Identification Code (SGIC) was utilized to link pre- and post-implementation surveys. The SGIC was collected via online Qualtrics self-survey (Table 1).
Outcomes. Following the three-month program pilot, post-implementation data (e.g. productivity, HWEAT, job satisfaction) was collected through Qualtrics and analyzed. The results were disseminated to all stakeholders and recommendations were made about program effectiveness and continuation.
Employee perceptions of the ERP. Employee perceptions of the effectiveness and meaningfulness of the ERP were assessed using a six-item Qualtrics questionnaire. Respondents rated each question using the same six-point Likert scale as the JSS (disagree very much [1] to agree very much [6]) (Appendix F).
Data analysis. Demographic data were analyzed using descriptive statistics and
frequency distributions. Productivity and survey data were analyzed using descriptive statistics and Paired t-Tests. Program evaluation data were analyzed using descriptive statistics, frequency distributions, and content analysis. The Statistical Package for Social Sciences (SPSS) version 25 was utilized to determine:
1. Pre- and post-implementation differences in productivity, HWEAT, and employee satisfaction using Paired t-Tests.
Dissemination and Recommendations. After data analysis, the results were disseminated to all BCBS NC stakeholders to include both the Medical Review staff and
management. Based on the results about the effectiveness of the ERP in improving productivity, job satisfaction, and employee perceptions of the work environment, recommendations about the continuation of the program and opportunities to improve the ERP in advance of the next
CHAPTER 5: DATA ANALYSIS Results
Fifty-six MRD employees completed the demographic, JSS, and HWEAT
pre-implementation Qualtrics survey (91.8% response rate). Productivity data on 39 employees were collected. Due to employee attrition and other factors, 56 MRD employees were eligible for post-implementation data collection. Forty completed post-post-implementation surveys were returned for a response rate of 71.43%.
Demographics Data
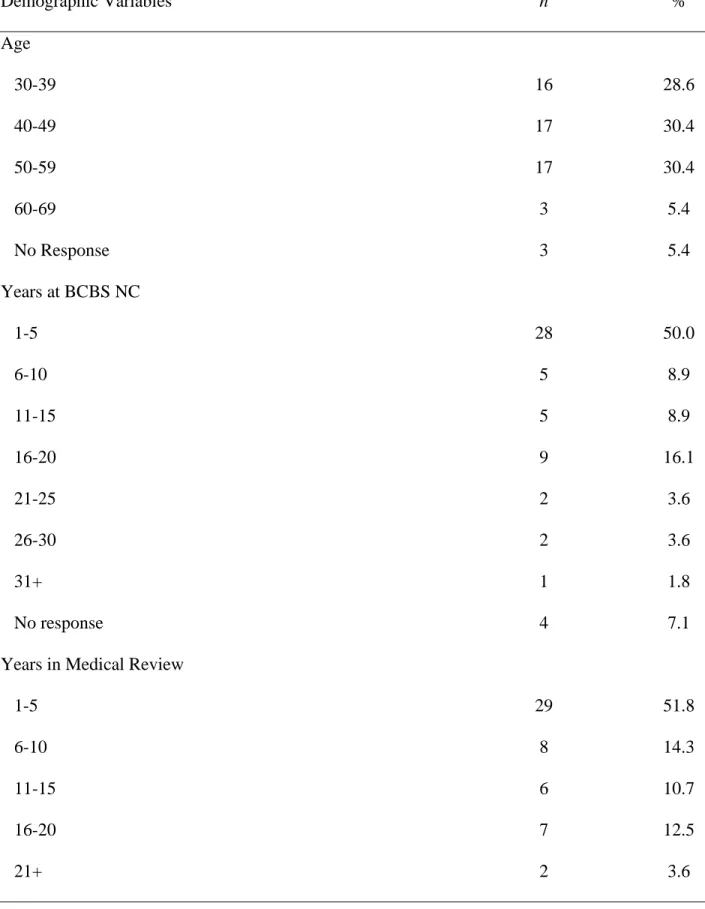
Table 2. Demographic Data
Demographic Variables n %
Age
30-39 16 28.6
40-49 17 30.4
50-59 60-69 No Response 17 3 3 30.4 5.4 5.4 Years at BCBS NC
1-5 28 50.0
6-10 11-15 16-20 21-25 26-30 31+ 5 5 9 2 2 1 8.9 8.9 16.1 3.6 3.6 1.8
No response 4 7.1
Years in Medical Review
1-5 29 51.8
Demographic Variables n %
No response 4 7.1
Position
Clinical Education Consultant 2 3.6
Clinical Support Specialist 4 7.1
Dental Analyst 2 3.6
Manager or Senior Divisional Compliance Consultant 3 5.4
Medical Review Analyst 32 57.1
Senior Medical Review Analyst 8 14.3
Team Lead 3 5.4
No response 2 3.6
Education Level
High School Diploma Associate’s Degree Bachelor’s Degree Master’s Degree Other No Response 1 16 20 7 10 2 1.8 28.6 35.7 12.5 17.9 3.6 Note. Percentages may not total 100% due to rounding
Program Results
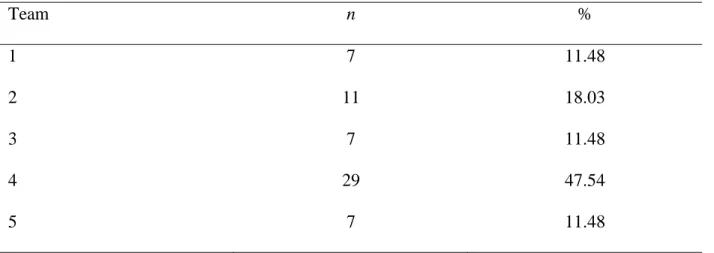
Table 3. Awards Received Per Team
Team n %
1 7 11.48
2 11 18.03
3 7 11.48
4 29 47.54
5 7 11.48
Recognition was given for numerous reasons. Major themes included assisting one’s peers, managing urgent work issues and other tasks, assisting the department and other departments within the company, commitment to one’s own team and the department overall, having someone’s back, offering help, guidance, or support to someone, and going above and beyond what was expected. For example, the following recognition was given to staff member XX by their direct supervisor:
XX is instrumental to the success of the High Dollar team. In addition to completing her daily assignments and other work functions, XX has many duties and responsibilities that go above and beyond what is expected of her. Particularly, XX monitors the High Dollar inventory and reports the High Dollar savings and claims volumes monthly to upper level management. Gathering this information is very time consuming and often times, XX is required to do this task outside her normal working hours. This involves querying a database and cleaning raw data into a form that is usable by all. Furthermore, XX is always willing to provide data to the leadership team and anyone else when necessary, taking time out of her busy schedule to ensure this is managed timely. XX is truly a Shining Star and a great asset to High Dollar, Medial Review, and the company as a whole.
Job Satisfaction Survey
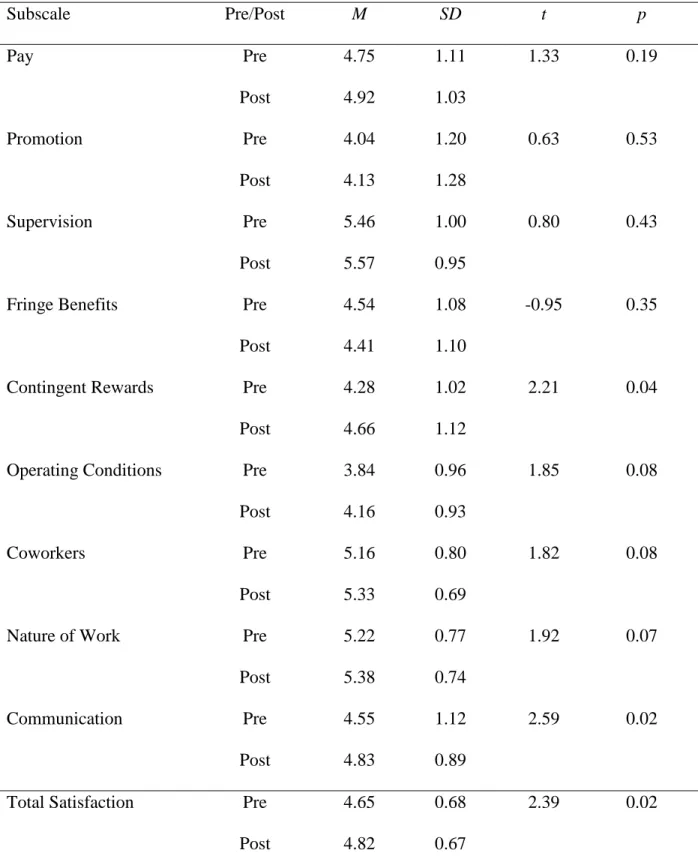
The JSS consisted of 36 items divided into nine subscales rated on a six-point Likert scale ranging from disagree very much (1) to agree very much (6). Mean scores for each subscale and the total Satisfaction score were calculated and interpreted using the scale of dissatisfaction (M ≤ 3.00), ambivalence (M = 3.01-4.00) and satisfaction (M > 4.00) per interpretation instructions (Spector, 1994). The nine subscales included pay, promotion, supervision, fringe benefits, contingent rewards, operating procedures, coworkers, nature of work, and communication. To determine if differences existed in the job satisfaction pre- and post-implementation, a Paired Samples t-Test was performed using SPSS. Significant differences were noted in the Contingent Rewards (t = 2.21, p = 0.04) and the Communication (t = 2.59, p = 0.02) subscales as well as the total Satisfaction score (t = 2.39, p = 0.02). Otherwise, there were no significant differences in the remaining seven subscales (Pay, Promotion, Supervision, Fringe Benefits, Operating Conditions, Coworkers, and Nature of Work).
Table 4. Job Satisfaction Survey – Paired Samples t-Test Results and Paired Samples Statistics
Subscale Pre/Post M SD t p
Pay Pre 4.75 1.11 1.33 0.19
Post 4.92 1.03
Promotion Pre 4.04 1.20 0.63 0.53
Post 4.13 1.28
Supervision Pre 5.46 1.00 0.80 0.43
Post 5.57 0.95
Fringe Benefits Pre 4.54 1.08 -0.95 0.35
Post 4.41 1.10
Contingent Rewards Pre 4.28 1.02 2.21 0.04
Post 4.66 1.12
Operating Conditions Pre 3.84 0.96 1.85 0.08
Post 4.16 0.93
Coworkers Pre 5.16 0.80 1.82 0.08
Post 5.33 0.69
Nature of Work Pre 5.22 0.77 1.92 0.07
Post 5.38 0.74
Communication Pre 4.55 1.12 2.59 0.02
Post 4.83 0.89
Total Satisfaction Pre 4.65 0.68 2.39 0.02
Healthy Work Environment Assessment Tool
The HWEAT consisted of 18 items divided into six subscales rated on a five-point Likert scale ranging from strongly disagree (1) to strongly agree (6) (AACN, 2015). Mean scores for each subscale and the total HWEAT score were calculated and interpreted using the scale of needs improvement (M = 1.00-2.99), good (M = 3.00-3.99), and excellent (M = 4.00-5.00) (AACN, 2005). The six subscales included: skilled communication, true collaboration, effective decision making, appropriate staffing, meaningful recognition, and authentic leadership. To determine if differences existed in the HWEAT pre- and post-implementation, a Paired Samples t-Test was performed using SPSS. Significant differences were noted in the Appropriate Staffing (t = 3.02, p = 0.01) and Meaningful Recognition (t = 3.45, p = 0.002) subscales as well as the total HWEAT score (t = 2.16, p = 0.04). Otherwise, there were no significant differences for the remaining four subscales (Authentic Leadership, Skilled Communication, True Collaboration, and Effective Decision Making)
Table 5. Healthy Work Environment Assessment Tool – Paired Samples t-Test Results and Paired Samples Statistics
Subscale Pre/Post M SD t p
Appropriate Staffing Pre 3.68 0.69 3.02 0.01
Post 3.97 0.82
Authentic Leadership Pre 3.91 0.68 1.26 0.22
Post 4.02 0.69
Skilled Communication Pre 3.80 0.83 0.64 0.53
Post 3.87 0.92
True Collaboration Pre 3.62 0.76 0.31 0.76
Post 3.66 0.81
Effective Decision Making Pre 3.64 0.83 0.96 0.34
Post 3.76 0.82
Meaningful Recognition Pre 3.56 0.84 3.45 0.002
Post 3.92 0.73
Total HWEAT Pre 3.70 0.69 2.16 0.04
Post 3.86 0.73
Note. Mean =1.00-2.99 represents Needs Improvement; 3.00-3.99 represents Good; 4.00-5.00 represents Excellent (AACN, 2005)
Productivity
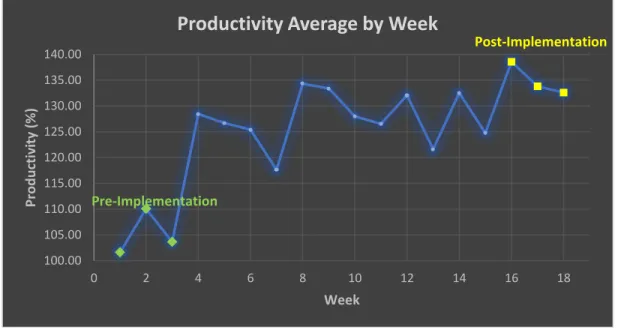
departmental productivity increased by almost 30% throughout program implementation (Pre: M = 105.11; Post: M = 134.99) (Figure 1).
Figure 1. Average Productivity by Week
The Medical Review department consisted of three productivity-based teams. See Figure 2 for the average productivity per team throughout project implementation.
Figure 2. Average Productivity per Team by Week
100.00 105.00 110.00 115.00 120.00 125.00 130.00 135.00 140.00
0 2 4 6 8 10 12 14 16 18
Pr o d u ctiv ity (% ) Week
Productivity Average by Week
Pre-Implementation Post-Implementation 80 90 100 110 120 130 140 150 160
1 2 3 4 5 6 7 8 9 10 11 12 13 14 15 16 17 18
Pr o d u ctiv ity (% ) Week
Productivity Average by Team
Employee Perceptions
Employee perceptions of the effectiveness and meaningfulness of the ERP were assessed using a six-item Qualtrics questionnaire. Respondents rated each item using a six-point Likert scale: disagree very much (1), disagree moderately (2), disagree slightly (3), agree slightly (4), agree moderately (5), and agree very much (6). Employee perceptions data were analyzed by SPSS using descriptive statistics. Additionally, qualitative data was gathered by asking staff to explain why they selected their responses to each item on the questionnaire, these data were analyzed through content analysis.
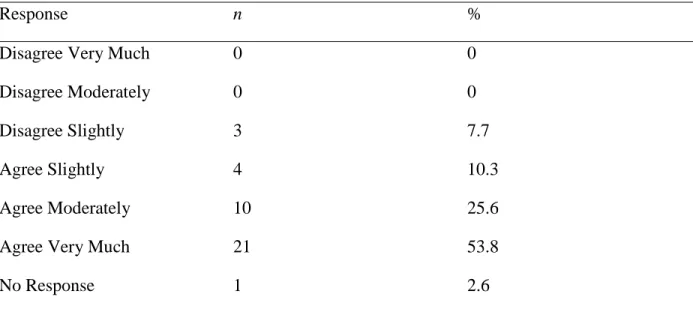
Was it meaningful? The first item assessed whether the staff found the ERP and the types of recognition meaningful. Overall, 89.7% (n=35) of respondents agreed (slightly, moderately, and very much) that the ERP and the types of recognition were meaningful (Table 6).
Table 6. The Types of Recognition were Meaningful to Me
Response n %
Disagree Very Much 0 0
Disagree Moderately 0 0
Disagree Slightly 3 7.7
Agree Slightly 4 10.3
Agree Moderately 10 25.6
Agree Very Much 21 53.8
No Response 1 2.6
Staff explanation of why they selected their responses varied. Overwhelmingly, the comments were positive (84.21%). For example, one respondent stated:
Being recognized by someone other than just the person you interacted with really made me feel appreciated and as if I fit into the team/department. Just received email after email saying 'congratulations' really made me smile for the rest of that day. Also, printing the certificate out and placing my star on it was another moment of joy that made me think 'maybe I do fit well here'.
Other common themes that arose were feeling good about oneself, being noticed, being valued, feeling their work was important and not overlooked, and feeling that peers cared. The negative comments (15.79% of total comments) mainly surrounded the nomination process:
I felt friends of friends were selected, so then it really didn't matter to me. Seems the same people were always submitted and recognized.
Requirements for recognition were fairly non-specific. Would have liked more specific documentation of what made the winners shine.
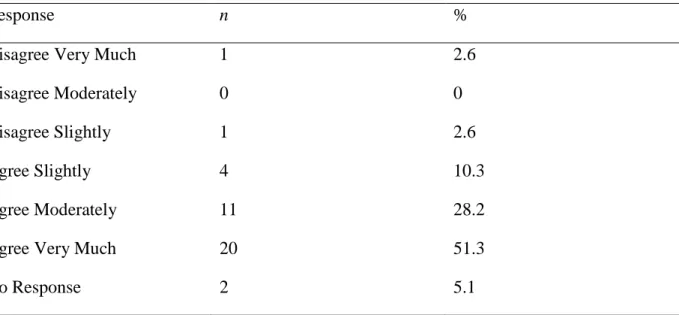
Were they satisfied? The second item assessed whether staff was satisfied overall with the ERP. Overall, 89.7% (n=35) of respondents agreed (slightly, moderately, and very much) they were satisfied with the ERP (Table 7).
Table 7. Overall, I was Satisfied with the Employee Recognition Program
Response n %
Disagree Very Much 1 2.6
Disagree Moderately 0 0
Disagree Slightly 1 2.6
Agree Slightly 4 10.3
Agree Moderately 11 28.2
Agree Very Much 20 51.3
No Response 2 5.1
Again, staff explanation of why they selected their responses varied. Overwhelmingly, the comments were positive (93.75%). For example, one respondent stated:
It was a pleasant surprise to get that kudos when I did something that seemed so small to me but made a huge difference to someone else.
Other common themes included boosting morale, satisfaction with the ERP overall, fun and enjoyable way to recognize peers, fairness to all, and being recognized no matter how big or small the deed was. Only one negative comment was received (6.25% of total comments). It was related to the weekly email blasts surrounding the award recipients:
On the day the awards were presented, the amount of emails congratulating winners was somewhat disruptive.
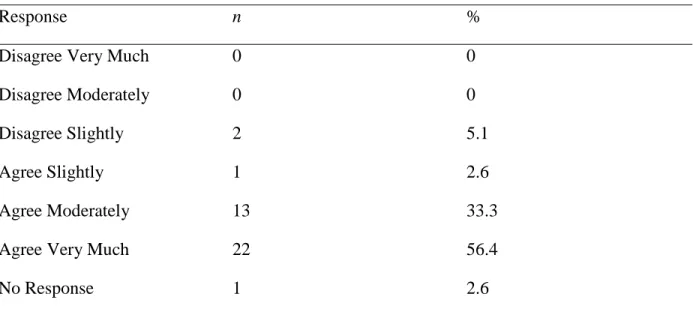
Was it easy to use? The third item assessed whether staff believed the ERP was easy to use. Overall, 92.3% (n=36) of respondents agreed (slightly, moderately, and very much) that the ERP was easy to use (Table 8).
Table 8. The Employee Recognition Program was Easy to Use
Response n %
Disagree Very Much 0 0
Disagree Moderately 0 0
Disagree Slightly 2 5.1
Agree Slightly 1 2.6
Agree Moderately 13 33.3
Agree Very Much 22 56.4
No Response 1 2.6
Staff explanation of why they selected their responses varied. For this item, the comments were overwhelmingly positive (95%). One respondent stated:
The nomination form was straightforward and getting to the form was simple with the link provided.
Another respondent stated:
Every week a link was sent out to give people an opportunity to participate and the program tied with BCBS core values. Just a few clicks of the mouse and that's all it takes. Very simple to submit a recommendation.
Common themes included ease of use, self-explanatory, user-friendly, straightforward, and quick. Only one negative comment was received (5% of total comments). It was related to the virtual work environment and not knowing their peer’s:
How can you recognize someone when you work from home, and really don't know people?
Was it fair? The fourth item assessed whether staff believed the selection criteria of the ERP were fair to all. Overall, 89.7% (n=35) of respondents agreed (slightly, moderately, and very much) that the ERP was fair to all participants (Table 9).
Table 9. The Selection Criteria were Fair to all Participants
Response n %
Disagree Very Much 0 0
Disagree Moderately 0 0
Disagree Slightly 3 7.7
Agree Slightly 3 7.7
Agree Moderately 8 20.5
Agree Very Much 24 61.5
No Response 1 2.6
Staff explanation of why they selected their responses varied. For this item, the comments overwhelmingly positive (81.82%). One respondent stated:
The program allowed peers to recognize each other for jobs well done and great team work. Everyone had equal opportunity to be nominated, if they made contributions and their teammates recognized them.
Another respondent stated:
I feel the selection criteria was fair because it gave all staff members a chance to recognize their coworkers whether they were on the same team or not.
Other common themes included being able to nominate anyone, fairness to all, universal criteria, everyone having the same opportunity to be nominated, and everyone being encouraged and able to participate. Negative comments (18.18% of total comments) surrounded the number of
nominations and awards people received. One respondent stated:
It seemed like the same people were awarded several times in a short span of time... there should be a limit on how often a person can get awarded.
Another respondent stated that:
At some times felt like popularity contest.
Table 10. The Employee Recognition Program was Beneficial to the Department
Response n %
Disagree Very Much 1 2.6
Disagree Moderately 0 0
Disagree Slightly 2 5.1
Agree Slightly 4 10.3
Agree Moderately 11 28.2
Agree Very Much 19 48.7
No Response 2 5.1
Note. Percentages may not total 100% due to rounding
Staff explanation of why they selected their responses varied. For this item, the comments overwhelmingly positive (94.44%). One respondent stated:
It gave the department the opportunity to recognize each other with no chance of running out of nominations or recipients. It also allowed the recipient to accept the praise from the entire department for 'shinning' as well as receive a physical representation of that praise.
Another respondent stated:
I enjoyed seeing everyone participate, whether it was being recognized or congratulating others. It's awesome to know what great things are going on in the department!
Other common themes included being able to express personal value to your peers, giving everyone the opportunity to be appreciated and recognized, boosting morale, feeling good about yourself, uniting the teams and the department, and allowing staff to feel like they are making a difference. Only one negative comment was received (5.56% of total comments). This
respondent stated that:
Should the ERP become permanent? The sixth item assessed whether staff believed the ERP should become a permanent addition to the Medical Review department. Overall, 76.9% (n=30) of respondents agreed (slightly, moderately, and very much) that the ERP should become permanent (Table 11).
Table 11. The Employee Recognition Program Should Become a Permanent Addition to the Medical Review Department
Response n %
Disagree Very Much 1 2.6
Disagree Moderately 3 7.7
Disagree Slightly 4 10.3
Agree Slightly 4 10.3
Agree Moderately 14 35.9
Agree Very Much 12 30.8
No Response 1 5.1
Note. Percentages may not total 100% due to rounding
Staff explanation of why they selected their responses varied. For this item, the comments overwhelmingly positive (85.71%). One respondent stated:
It was evident after the first few weeks of the program during staff/team meetings that people were less anxious and more jovial towards each other and to management in regards to working as a whole. I feel that when people feel recognized and rewarded, they are happier at work and happier employees tend to be more productive employees. Another respondent stated:
I liked the interaction that occurs weekly when nominees were announced. It's nice to see all of the encouraging and congratulatory emails.
The first stated that they prefer the current systems that were in place in Medical Review prior to program implementation. Specifically, the respondent stated that:
I prefer the current PROPS points system and wonder if this system took away from people giving PROPS points.
The other comments surrounded not feeling included in the program and being overlooked if no one knows you since most staff work virtually. Specifically, one respondent stated that:
It's not inclusive. If no one knows you, you are overlooked.
Employee perceptions overall. Mean scores for each of the six items ranged from 4.66 to 5.45 (out of 6.00). The majority of items (five out of the six items) rated ‘agree moderately” on the 6-point Likert scale (disagree very much, disagree moderately, disagree slightly, agree slightly, agree moderately, and agree very much) except for the item asking if the ERP should become permanent. This item rated “agree slightly” (M = 4.66) (Table 12).
Table 12. Mean Scores for Employee Perceptions of the Employee Recognition Program’s Meaningfulness and Effectiveness
Item M SD
Meaningfulness 5.29 0.96
Overall Satisfaction 5.27 1.07
Ease of Use 5.45 0.80
Fairness 5.39 0.95
Beneficial 5.19 1.13
Should it Become Permanent 4.66 1.38
CHAPTER 6: DISCUSSION Discussion
A quality improvement project utilizing a pre-post design evaluated the effectiveness of an ERP at improving staff satisfaction, productivity, and the overall health of the BCBSNC-MRD work environment. Specifically, this project aimed to understand the impacts of ERPs based on non-monetary forms of recognition on staff satisfaction, productivity, and the overall health of the work environment in a non-traditional nursing setting. Four questions guided the development of this project:
1. How does an ERP effect job satisfaction among BCBSNC-MRD staff?
2. How does an ERP effect overall work environment health within Medical Review? 3. How does an ERP effect Medical Review work productivity?
4. What facilitators and barriers impact ERP implementation at BCBS NC?
Analysis of the JSS and HWEAT data indicated a significant improvement in the overall job satisfaction and the health of the Medical Review work environment. Further, staff productivity improved significantly throughout the pilot period. The results from this project support the application of non-monetary-based recognition programs in non-traditional nursing work environments and highlight the value of these programs in improving staff and organizational outcomes.
Job Satisfaction
organizational performance and effectiveness (Bakotic, 2016). Satisfied employees are more committed to their organization, have greater performance and productivity, and are more likely to assist their peers and go above and beyond what is expected of them (Bakotic, 2016; Pang & Lu, 2016). Job satisfaction is so crucial, researchers posit that employee satisfaction is the major determinant of organizational success (Bakotic, 2016). Although, the association between job satisfaction and employee recognition is well established, little evidence is available that specifically inspects the impacts of employee recognition on job satisfaction within healthcare. Further, no evidence is currently available that examines the impacts of employee recognition on job satisfaction within non-traditional nursing work environments.
How does an ERP effect job satisfaction among BlueCross and BlueShield Medical Review department staff? In this project, the effect of an ERP on job satisfaction in a non-traditional nursing work setting (BCBSNC-MRD) was examined. Significant differences were noted in the total Satisfaction score (t = 2.39, p = 0.02) and the Contingent Rewards (t = 2.21, p = 0.04) and Communication (t = 2.59, p = 0.02) subscale scores of the JSS. These results suggest that the implementation of the ERP was effective at improving job satisfaction within the Medical Review department.
The Contingent Rewards subscale was designed to assess employee “appreciation, recognition, and rewards” for a job well done (Spector, 2001). The Contingent Rewards subscale consisted of four items (items #5, 14, 23, and 32 on the JSS):
• When I do a good job, I receive the recognition for it that I should receive.
• I do not feel that the work I do is appreciated.
• There are few rewards for those who work here.
Significant findings within the Contingent Rewards subscale were not surprising as the project’s purpose was implementation of an ERP within the MRD, further increasing the available
avenues for recognition and rewards within the project setting. Further, this project was a
supplement to the already extensive rewards and recognition systems in place within BCBS NC. The Communication subscale was designed to measure communication within the
organization (Spector, 2001). The Communication subscale consisted of four items (items #9, 18, 26, and 36 on the JSS):
• Communications seem good within this organization.
• The goals of this organization are not clear to me.
• I often feel that I do not know what is going on with the organization.
• Work assignments are not fully explained.
Significant findings within the Communication subscale were not surprising as one of the recognition types, the departmental-wide email blasts, substantially increased communication across the department throughout the pilot period. Prior to project implementation, many staff members could go extended periods without speaking to their peers or management. This was due to the nature of their work and the virtual work environment. Weekly emails blasts with the recognition rewards allowed staff the opportunity to respond to the entire department, offering words of congratulations and praise, and increasing their communication with their peers and the management team.
employee recognition was a statistically significant predictor of job satisfaction (r = 0.25, p <0.001). The importance job satisfaction and employee recognition play in achieving employee and organizational outcomes is clearly evident. Results from this project further support that employee recognition represents a powerful tool for management to utilize to improve job satisfaction and ultimately ensure organizational success and the achievement of employee and organizational outcomes.
Healthy Work Environment
A HWE is critical to the success of an organization and its employees (Shirey, 2006). Healthier work environments are associated with improved patient, staff, and organizational outcomes (Erickson, 2010). Meaningful recognition, one of the six AACN HWE standards, examines employee reward based on individual value and staff contributions to their
organization (Vollers et al., 2009). Meaningful recognition and MR-based ERPs, have been shown to positively impact job satisfaction, productivity, engagement, retention, and overall organizational performance and success (Akafo & Boateng, 2015; Ali & Ahmed, 2009; Lefton & Breugger, 2009; Tessema et al., 2013; Ulrich et al., 2006). Healthy work environments and MR have been studied primarily in acute care nursing settings. Little to no evidence is available that examines their impacts on non-traditional nursing work environments.
Appropriate Staffing was described by the AACN as staffing levels and skill mixes that ensure “the effective match between patient needs and nurse competencies” (AACN, 2005). This concept may be expanded more globally beyond the clinical environment to refer to the
appropriateness of the match between meeting organizational needs and the skills and
competencies of the employees (Morton, 2015). The Appropriate Staffing subscale consisted of three items (items #3, 8, and 12 on the HWEAT):
• Managers and team leads work with staff to make sure there are enough staff to
effectively manage the work.
• Managers and team leads make sure there is the right mix of staff to ensure
optimal outcomes.
• Support services are provided at a level that allows department staff to spend