ARE FIRMS STOCKPILING FOREIGN EARNINGS?
Margot E. Howard
A dissertation submitted to the faculty at the University of North Carolina at Chapel Hill in partial fulfillment of the requirements for the degree of Doctor of Philosophy in the Department
of Accounting in the Kenan-Flagler Business School.
Chapel Hill 2015
Approved by:
Douglas A. Shackelford Edward L. Maydew Eva Labro
iii ABSTRACT
Margot E. Howard: Are Firms Stockpiling Foreign Earnings? (Under the direction of Douglas A. Shackelford)
The American Jobs Creation Act of 2004 (the Act) created a temporary opportunity for U.S. firms to repatriate certain foreign earnings, determined in part by a firm’s permanently reinvested earnings (PRE), at a significantly reduced tax rate. Firm balances of PRE have soared over recent years and some have speculated that it is partially attributable to the Act. My results reveal that firms experienced a spike in changes to PRE after the Act only in 2006, rather than an ongoing trend of increased changes to PRE throughout the post-Act period. I also examine whether the Act changed investor expectations related to repatriation tax liabilities and my results indicate that while there was no permanent shift in valuation, investors responded to the possibility of another tax holiday. Overall, my results provide insight into the firm and market effects of tax legislation and shed light on the “stockpiling” of PRE as discussed by the media, legislators, and the related literature amid concerns that the Act has led firms to hoard
iv
TABLE OF CONTENTS
LIST OF TABLES ... v
LIST OF FIGURES ... vi
SECTION 1: INTRODUCTION ... 1
SECTION 2: BACKGROUND AND RELATED LITERATURE ... 6
SECTION 3: HYPOTHESIS DEVELOPMENT ... 10
SECTION 4: RESEARCH DESIGN AND SAMPLE ... 15
SECTION 5: RESULTS ... 18
SECTION 5.1: POST-ACT CHANGES IN PRE ... 18
SECTION 5.2: MARKET VALUATION ANALYSIS ... 23
SECTION 6: CONCLUSION ... 25
APPENDIX: VARIABLE DEFINITIONS ... 42
v
LIST OF TABLES
TABLE 1: DESCRIPTIVE STATISTICS ... 28
TABLE 2: CHANGES IN FIRM PRE ... 30
TABLE 3: INDUSTRY ANALYSIS ... 34
TABLE 4: TOP REPATRIATING FIRMS ... 37
TABLE 5: PRE-ACT PERIOD ANALYSIS ... 40
vi
LIST OF FIGURES
FIGURE 1: PRE FOR FIRMS WITH THE 15 HIGHEST REPATRIATIONS
1 SECTION 1: INTRODUCTION
This paper investigates the reported surge in permanently reinvested earnings (PRE) that has occurred since the repatriation tax holiday under the American Jobs Creation Act of 2004 (the Act).1 While it is generally reported that firms increased their PRE in the period following the Act and some assert that firms have “stockpiled” PRE in anticipation of another tax holiday, there is, to my knowledge, little research that provides empirical evidence of this claim or investigates the details of this increase in PRE related to the Act.2,3
I hypothesize that the increase in reported PRE was disproportionately from firms that repatriated under the favorable terms of the Act and/or firms that repatriated the maximum eligible amount under the Act. Contrary to my hypotheses I find no evidence of an ongoing trend of increased changes to PRE or a concentration of increased changes to PRE within any one group during the post-Act period. Rather, it appears that all firms increased their changes to PRE only in 2006, immediately after the repatriation period under the Act ended. Further investigation also indicates that firms that repatriated the maximum amount under the Act had relatively smaller changes to PRE during the recent financial crisis. My results also indicate that
1
The tax holiday under the Act provided an 85 percent dividends received deduction to U.S. firms that repatriated earnings (had their foreign subsidiaries pay dividends to the U.S. parent) back to the United States. The Act is discussed in greater detail in Section 2.
2
United States Senate (2011), Fleischer (2012), and New York Times Editorial Board (2014) are just a few examples of the many claims that the Act led to firms hoarding cash abroad.
3
2
firms that repatriated under the Act increased their changes to PRE in 2003, in advance of the Act.
I also investigate whether the Act changed investors’ valuation of the disclosed tax
liability associated with PRE. Numerous studies have investigated the market valuation of PRE and/or the disclosed or estimated deferred tax liability related to PRE (Collins et al., 2001; Oler et al. 2007; Bryant-Kutcher et al., 2008; among others) before or around the time of the Act. However, no study, to my knowledge, has thoroughly investigated whether the Act led to a shift in investor expectations about future repatriation tax rates, as exhibited through investors’ valuation of the repatriation tax liability, in the post-Act period. I hypothesize that investors’ valuation of the tax liability associated with PRE will become less negative in the post-Act period, reflecting the expectation of another tax holiday. My results suggest that the Act did not lead to a permanent shift in investors’ valuation of the repatriation tax liability. Rather it appears
that investors only alter their valuation as legislation is proposed for a tax holiday, similar to investor reaction in the time preceding the Act.
The recent growth in PRE has attracted attention from many quarters, including Congressional testimony from Jack T. Ciesielski, an accounting and investment expert:
In 2006, the year after firms were allowed to repatriate earnings at a reduced tax rate, the total balance was only $618.5 billion. In the space of five years, the balance of indefinitely reinvested earnings more than doubled, growing at an average rate of 20% per year. Firms had depleted their balances somewhat in 2005, when they were permitted to repatriate earnings at a 5.25% tax rate. Still, firms have added indefinitely reinvested earnings at a remarkable rate in just the last several years: over $450 billion in just 2011 and 2010.4
A 2011 Senate Majority Staff Report attributed this rise in PRE to the Act itself:
Even more disturbing is that the 2004 repatriation rewarded corporations that kept substantial funds offshore, and has created a new incentive for U.S. corporations to keep shipping jobs and diverting domestic funds offshore…The long term
3
consequence of that policy is the current corporate stockpiling of offshore funds
in anticipation of another repatriation tax break allowing multinational
corporations to use a 5.25% tax rate in place of the top 35% rate that applies to domestic corporations. (Emphasis added)5
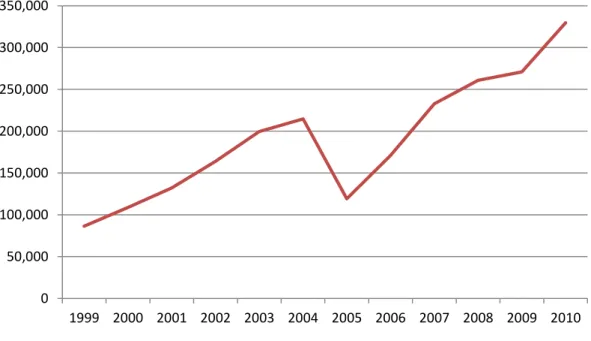
The Majority Staff report also identified the 15 firms with the highest repatriations under the Act. Figure 1 graphs the PRE of these 15 firms for 1999 through 2010. The graph shows a steady climb in PRE through 2004, followed by a massive drop in 2005 as a result of repatriations under the Act. However, PRE quickly rises again and surpasses pre-Act levels in just two years. The media has also attributed this rise in PRE directly to the Act with statements such as “The tax holiday also raised expectations for future tax holidays, and companies have changed their behavior accordingly by hoarding cash offshore” (Fleischer 2012) and “Such a reprieve in 2005 was disastrous, in part because it encouraged the hoarding of profits in tax-deferred foreign accounts in anticipation of future tax holidays” (New York Times Editorial Board 2014). The academic community has also commented on this issue, although their remarks have typically been less inflammatory. As Dartmouth College professor Leslie Robinson noted in her recent Congressional testimony, “[I]t is my conjecture that the recent build-up of undistributed earnings
since the 2005 tax holiday is at least, in part, driven by the expectation of a potential future tax holiday.”
Understanding firms’ reporting of PRE and how it has changed because of the Act is
important not only so we can evaluate the claims made by legislators, academics, and the media, but also for the light it can shed on the potential impact of future tax policy. The projected response to the repatriation tax holiday under the Act, $2.8 billion in tax revenue, was
significantly underestimated, with firms repatriating $312 billion of qualified dividends, resulting in actual revenues of $18 billion, over six times the estimated amount. Having a better
4
comprehension of PRE would help with estimating the response to another tax holiday similar to the Act, which has been suggested several times over the past few years. During the 112th Congress (2011-2012) numerous bills were introduced that include proposals to reduce the effective tax rate on repatriations, either temporarily or permanently (Gravelle and Marples, 2011).6 Last year there were also discussions in Congress of another repatriation tax holiday to, in part, help raise revenues for the dangerously low federal Highway Trust Fund.7 In Graham et al. (2010) 64.7 percent of responding tax executives indicated that they would take advantage of another future repatriation tax holiday, suggesting that the response to a future holiday could be significant and making an understanding of the impact of the previous tax holiday even more critical. President Obama’s current budget proposal includes a 14 percent tax on existing PRE and a 19 percent tax on future foreign earnings, a clear change from the current deferral available for PRE under APB 23.8 Therefore, even absent another repatriation tax holiday it is important to understand how the Act has changed firm reporting of PRE and investor perceptions of PRE. In addition, tax executives’ survey responses indicate that the financial accounting implications are as important as the cash tax consequences in making decisions on repatriating or reinvesting foreign earnings (Graham et al., 2011). Presumably, the financial accounting implications are so important at least in part because of how investors interpret and use that information when valuing the firm. Therefore, it is important to know whether the Act has affected investors’
valuation of the PRE-related tax liability.
Despite all the discussion about the increase in PRE since the Act and the importance of understanding how the Act affected PRE, there has been little investigation into the details and
6For additional details see H.R. 937, H.R. 1036, H.R. 1834, H.R. 2862, S. 727, and S. 1671 from the 112th Congress.
7Weisman (2014), New York Times Editorial Board (2014), and Stephenson and Temple-West (2014).
5
causes of this increase. My study contributes to the literature by providing evidence on a topic that is often assumed to be true – that firms have increased their changes to PRE in recent years. My results reveal that although firms have in fact increased their changes to PRE in the post-Act period it has not been an ongoing trend. Rather there was a spike in changes to PRE only in 2006. My results also suggest that some firms have actually relatively decreased their changes to PRE in the post-Act period, even after controlling for general macroeconomic effects. I also provide evidence that investors’ valuation of the tax liability associated with PRE did not permanently shift after the Act, but became less negative as investors anticipated another possible tax holiday.
This paper proceeds as follows. Section 2 provides background on the Act and a
6
SECTION 2: BACKGROUND AND RELATED LITERATURE
The earnings of a foreign subsidiary of a U.S. firm are generally subject to U.S. income tax upon distribution of those earnings back to the U.S. firm (repatriation tax).9 Firms receive a credit for foreign taxes paid on such earnings, reducing the amount of tax due upon repatriation. However, as shown in Figure 2, the U.S. corporate income tax rate has generally been higher than foreign corporate income tax rates in recent years, meaning that firms generally still owe U.S. taxes upon repatriation. Although the cash taxes are not due until the firm actually brings the earnings back to the U.S., under financial accounting rules a deferred tax liability would typically need to be recognized along with the foreign earnings, accounting for the tax that will be paid when the foreign earnings are repatriated back to the U.S. However, under APB Opinion No. 23 no repatriation tax liability has to be recognized if the firm provides sufficient evidence that the foreign subsidiary’s earnings will be invested indefinitely overseas or the earnings will
be remitted as part of a tax-free liquidation. Firms can therefore delay the recognition of the repatriation tax on their financial statements by declaring that earnings from foreign subsidiaries are permanently reinvested abroad. Paragraph 44c of SFAS No. 109 states that firms must
9The amount of repatriation tax due depends on several factors, including whether the foreign tax rate applied to
7
disclose the amount of the unrecognized deferred tax liability related to PRE or state that the determination of that amount is not practicable.10
The Act created a tax holiday for repatriated earnings. Specifically, the Act provided a temporary 85 percent deduction for qualified dividends paid from a foreign subsidiary to its U.S. parent. The Act was unique in the way that the cash tax consequences of this deduction were tied to a financial statement amount, permanently reinvested earnings (PRE). Specifically, under Internal Revenue Code Section 965(b) qualified dividends were restricted to the greater of (1) $500 million, (2) the amount designated as PRE on the most recent audited financial statements filed on or before June 30, 2003, or (3) if only the tax liability related to PRE was disclosed, an amount equal to the tax liability divided by 35 percent. The dividends received deduction was further limited to extraordinary dividends, defined as repatriations made during the year that were in excess of the average repatriation during the previous five years (excluding the highest and lowest repatriation amounts during those years).11
This paper is related to two streams of literature: studies related to PRE and related repatriation taxes and studies more specifically examining the consequences of the repatriation provisions of the Act, though there is undoubtedly some overlap between the two. Within the PRE literature some studies focus on firm characteristics and actions. Krull (2004) hypothesizes and finds that firms use PRE to manage earnings to meet analysts’ forecasts. Foley et al. (2007)
find that firms that would face higher repatriation taxes hold higher levels of cash abroad, presumably to avoid the tax costs of repatriation. Graham et al. (2011) conduct a survey of almost 600 tax executives about factors they consider when deciding where to locate operations and whether to reinvest foreign earnings abroad. The results suggest that in addition to cash tax
10See Donohoe et al. (2012) for a more thorough discussion of PRE and APB Opinion No. 23.
8
costs, financial accounting repatriation tax considerations are also an important factor in making decisions regarding repatriation and foreign reinvestment. Blouin et al. (2012) find that
reporting incentives discourage repatriation of foreign earnings back to the U.S. Hanlon et al. (2014) investigate the relation between U.S. repatriation taxes and foreign investment and find a higher likelihood of foreign acquisitions for firms with cash that is “locked-out” because of repatriation taxes.
Other studies within the PRE literature focus on the market interpretation of PRE. Investor valuation of PRE was first investigated by Collins et al. (2001). Their results show that the market impounds the unrecognized but disclosed deferred tax liability related to PRE into firm value. Their results also suggest that the market similarly values PRE for firms that report a zero deferred tax liability related to PRE, firms that state that it is not practicable to estimate a deferred tax liability related to PRE, and firms that provide no information on the tax liability related to PRE.
Bryant-Kutcher et al. (2008) build on these results, incorporating findings from Foley et al. (2007) and DeWaegenaere and Sansing (2008). The authors partition their sample on whether a firm holds high amounts of excess cash, assuming that these firms (compared to low excess cash firms) are more likely to hold PRE in financial assets rather than operating assets. The authors hypothesize that PRE invested in financial assets is valued less than PRE invested in operating assets and find evidence that supports that conclusion. They also find that PRE invested in financial assets is valued less in firms that report a positive deferred repatriation tax liability, compared to firms that report a zero repatriation tax liability or do not provide
9
Oler et al. (2007) study how investors’ valuation of the potential tax liability associated
with the repatriation of PRE changed with the Act. Their results suggest that although investors priced the estimated liability before the Act, that valuation of the liability became less negative during the Act period, reflecting the potential for repatriating earnings at a reduced tax rate under the Act.
Several studies have specifically investigated repatriations under the Act. Repatriating firms had lower investment opportunities and higher free cash flows compared to
non-repatriating firms (Blouin and Krull, 2009). In regards to economic consequences of Act, there is evidence that the repatriations were not associated with an increase in domestic investment, employment, or R&D, part of the explicit purpose of the Act. In addition, there is evidence that firms that repatriated under the Act increased share repurchases in 2005, suggesting that firms used repatriated funds to increase shareholder payouts rather than to increase investment in domestic operations (Blouin and Krull, 2009; Graham et al. 2010; Dharmapala et al., 2011).12
12
10 SECTION 3: HYPOTHESIS DEVELOPMENT
Hartman (1985) first modeled repatriation decisions under the U.S. tax system. His results show that the repatriation tax does not distort decisions on foreign investment versus repatriation since, in his model, all foreign earnings are eventually subject to the same repatriation tax. Subsequent research deviates from this assumption. DeWaegenaere and Sansing (2008) include in their model “the occurrence of future tax holidays, implying that it may be optimal to temporarily invest earnings on operating assets in financial assets and repatriate these financial assets at a tax holiday.” If firms anticipate another tax holiday similar
to the AJCA this could incentivize them to accumulate PRE, similar to the tax holiday repatriating firms in the DeWaegenaere and Sansing model. In their model, a firm’s choice between investing operating earnings in financial assets and never repatriating those financial assets or immediately repatriating operating earnings and never investing in foreign financial assets is based on the comparison between the foreign corporate tax rate and the shareholder tax rate. If the shareholder tax rate exceeds the foreign corporate tax rate the firm will choose the former; if the foreign corporate tax rate exceeds the shareholder tax rate then it will choose the latter. Adding a future tax holiday into the model can affect both groups. Firms in the former group now have the option to repatriate foreign financial assets during the tax holiday. Some firms in the latter group will now choose to invest in financial assets instead of repatriating all operating earnings.
11
were limited to $500 million of qualified dividends under the Act. Some firms had qualified dividends in the tens of billions of dollars, indicating that the $500 million limitation would have been binding for some firms if they had not previously reported PRE (Mock and Simon, 2008).
Although the media has reported significant increases in firms’ PRE in recent years – often suggesting those firms are “hoarding” or “stashing” cash and earnings abroad - it is possible that those increases are related to expanding investment abroad.13 Firms often justify their PRE balances as an operational requirement for expanding business in foreign markets. For example, in a recent response letter to the SEC Google maintained that when making decisions regarding its amount of permanently reinvested earnings “[t]he main factors considered are the
funding requirements outside the U.S. for market growth and expansion, and financial requirements of our U.S. companies and operations.” They further explained:
With respect to the funding requirements for market growth and expansion outside the U.S., we expect a significant portion of our future expansion will continue to be driven by foreign operations outside the U.S. In fiscal year 2012, approximately 50% of our revenues were generated in non-U.S. markets. Accordingly, we have significant financial needs outside the U.S. to fund our continued market growth and expansion through mergers and acquisitions, on-going research and development, and investments in datacenter and other infrastructure and real property.
Apple similarly defended its decisions regarding PRE, noting:
The Company’s international markets have grown dramatically in recent years. In 2012, 61% of the Company’s net sales were outside the U.S. In recent years, the Company has invested significant amounts of cash outside the U.S. on product tooling and manufacturing process equipment, long-term supply agreements, the Company’s own retail stores and corporate facilities, acquisitions and strategic investments, and overall geographic expansion.
As these firms attest, there are plenty of business reasons, unrelated to tax holidays, for a firm to continue to increase its PRE. The results in Blouin et al. (2014) provide some support for these
13See Fontevecchia (2013) and O’Brien (2014) for examples of articles that suggest recent increases in PRE are not
12
claims, suggesting that a significant portion of PRE is driven by growth incentives and/or invested in non-financial assets, contrary to the idea that most firms are simply amassing suboptimal amounts of cash abroad. Therefore, it is not clear whether the recent increases in PRE are related to the Act or are simply the consequences of doing business as firms expand their international operations. However, the overwhelming assumption from legislators and the media seems to be that firms are stockpiling PRE (beyond amounts related to investment and other tax incentives) in anticipation of another repatriation tax holiday. This leads me to my first hypothesis:
H1: Changes in reported PRE, controlling for other tax and investment incentives, have
increased in the post-Act period.
In addition to confirming whether changes in reported PRE increased in the post-Act period, I also investigate which firms drove that change. Although the tax incentives of the repatriation were open to all firms that met the requirements of the Act, not all firms chose to repatriate. For example, Alcoa Inc., which had over $5 billion of PRE according to its 10-K filed in early 2003 (which would have established Alcoa’s repatriation limit under the Act), stated in its 2005 10-K, “Alcoa did not utilize the AJCA provision that allows companies to repatriate earnings from foreign subsidiaries at a reduced U.S. tax rate.” Oler et al. (2007) discuss the decision to repatriate or reinvest foreign earnings and note that, even with the extremely low repatriation tax rate under the Act, firms with significantly high-return foreign investment opportunities would still forgo repatriation. However, some firms were extremely interested in another tax holiday with some even participating in the Win America campaign, a lobbying effort to secure another repatriation tax holiday similar to the Act.14 Win America included companies such as Pfizer, Cisco Systems, Microsoft, and Apple, which repatriated $37 billion,
13
$1.2 billion, $780 million, and $755 million, respectively, under the favorable provisions of the Act.15 This indicates, perhaps unsurprisingly, that firms with some of the largest repatriations under the Act were also some of the firms most interested in the enactment of another tax holiday. Therefore, it is possible that the increases in reported PRE were concentrated in firms that actually took advantage of the repatriation provisions of the Act and were hoping to take advantage of a similar future tax holiday, which leads to hypothesis 1A:
H1A: Increased changes in reported PRE in the post-Act period are concentrated in firms
that repatriated funds under the Act.
As stated earlier, if a firm decided to repatriate under the Act there were limitations on the amount of dividends eligible for the reduced rate. In general they were limited to the greater of $500 million or the amount of reported PRE on the financial statements filed on or before June 30, 2003. Many firms (including Pfizer, Cisco, Microsoft, and Apple) repatriated the maximum amount allowed. These firms in particular could have benefited even more under the Act if they had previously reported higher amounts of PRE on their financial statements,
incentivizing them to report increased amounts of PRE on post-Act financial statements in anticipation of another tax holiday, leading to hypothesis 1B:
H1B: Increased changes in reported PRE in the post-Act period are concentrated in firms
that repatriated the maximum amount eligible under the Act.
Clausing (2005) describes how the Act should affect expectations related to future repatriations:
By granting a temporary tax break for firms with large accumulations of untaxed profits in low-tax countries, this provision sends the signal that the U.S.
government may grant such holidays in the future, or perhaps even move toward exempting foreign dividends from taxation…firms will have an incentive to
15I accessed a list of members of the Win America campaign through a copy of
14
repatriate profits during the holiday but will likely face a reduced incentive to repatriate in subsequent years, as the prospects have improved for a future “one-time” holiday, an extension, or even a permanent change.
While there is language in the legislation that refers to this holiday as a temporary stimulus measure, it should nonetheless lead to permanent changes in
expectations regarding the U.S. tax system. (339)
Oler et al. (2007) show that investors’ valuation of the tax liability related to PRE became less negative in 2003 and 2004 as investors anticipated firms’ repatriations at a reduced tax rate under the Act. As Clausing (2005) says the Act “should nonetheless lead to permanent changes in expectations regarding the U.S. tax system.” If the Act did in fact permanently change investors’
expectations regarding the U.S. tax system, I expect that the less negative tax expense valuation for the AJCA period found in Oler et al. (2007) persists into the post-Act period.16 Therefore I hypothesize:
H2: The investor valuation of repatriation tax liabilities is less negative in the post-Act
period.
16
15 SECTION 4: RESEARCH DESIGN AND SAMPLE
I begin my analysis with the following model:
ΔPREi,t = α0 + α1ROAdiffi,t-1 + α2FTRi,t + α3ΔFassetsi,t + α4FCFi,t + α5DivYieldi,t
+ α6Levi,t + α7GDPgrowthi,t + α8Lossi,t +α9-15FYi,t + εi,t (1)
The variables are based on the prior literature, including Krull (2004) and Blouin and Krull (2009). ΔPREis the current year PRE balance minus the previous year PRE balance, scaled by total firm assets. ROAdiff controls for the difference in expected foreign and domestic return on assets, measured at year t-1. FTR is the firm’s foreign tax rate. ΔFassets is the annual change in foreign assets. FCF equals annual operating cash flows scaled by total firm assets. DivYield is the ratio of dividends paid to the market value of equity. Lev controls for the firm’s method of financing. GDPgrowth is equal to U.S. GDP in year t minus U.S. GDP in year t-1, scaled by U.S. GDP in year t-1, to control for general macroeconomic effects. To maximize my sample size I also include firms with a domestic loss. Therefore I include the indicator variable Loss, which equals one for observations where the firm has a domestic loss in that year. FY represents indicator variables for each of the seven years (2004 through 2010) after the enactment of the AJCA. (See Appendix A for variable definitions.) Based on H1 I expect α9 throughα15 to be
positive, indicating that in each post-Act year firms made larger increases to PRE when
16
repatriating firms into firms that did and did not repatriate the maximum eligible amount under the Act.17
I expand on the model from Oler et al. (2007) to examine whether investors’ valuation of the deferred repatriation tax liability has changed in the post-Act period:
MVEi,t = β0+ β1DNIi,t + β2FNIi,t + β3CSi,t+ β4REi,t + β5PREi,t + β6Taxi,t
+ β7Posti,t +β8Tax*Posti,t + εi,t (2)
See Appendix A for variable definitions.18 Based on the results in Oler et al. (2007) I expect β6
to be negative. As formally stated in H2 I expect β8 to be positive, indicating that in the post-Act
period investors expect foreign earnings to eventually be repatriated at a lower rate, similar to that of the Act.
I hand collect data on PRE, the related tax liability, and repatriations under the Act from firm 10-K filings. I focus on S&P 500 firms from 1999 through 2010. I obtain foreign asset data from Datastream, share price data from CRSP, and all other data from Compustat. For my tests I focus on firms that already made the decision to report PRE without the additional incentive under the Act. Therefore, for both my firm and market tests I restrict the sample to firms that appear in at least seven of the 12 years in my sample period to ensure that I have observations for each firm both before and after the Act. 19 In addition, for my firm tests, I focus on changes in
17Since firms do not necessarily disclose past repatriations I can only take into account restrictions based on reported
PRE, not restrictions based on average past repatriation. However, the absence of this additional restriction biases against finding results since it results in my conservatively coding possible restricted firms as unrestricted.
18I use the three-year foreign effective tax rate, rather than the five-year rate Oler et al. (2007) use, to calculate TAX in order to increase my sample size. Results (untabulated) are similar if I use the five-year rate.
19Focusing on S&P 500 firms that appear at least seven years in my sample means that my sample is comprised of
17
PRE unrelated to the tax incentives of the Act so I eliminate observations for years when firms chose to repatriate under the Act. Following the prior literature, I winsorize continuous variables at the 1st and 99th percentile.
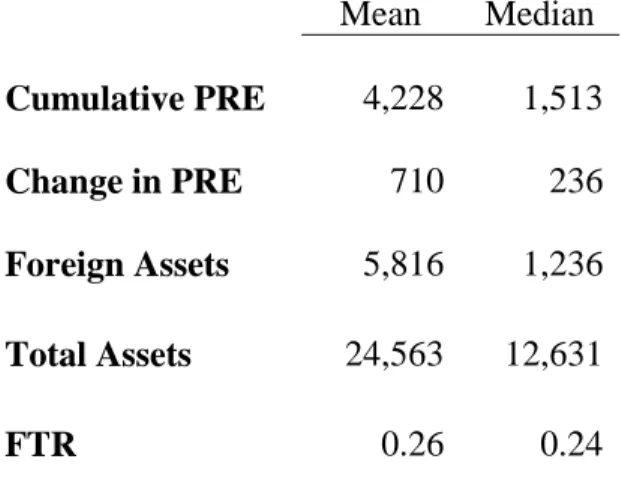
Table 1 provides descriptive statistics for the full sample, as well as for repatriating, non-repatriating, restricted, and unrestricted samples. Repatriating firms are those firms that reported making an eligible repatriation under the Act. Non-repatriating firms are those firms that
reported PRE in their 10Ks, but chose not to repatriate under the Act. Within the sample of repatriating firms restricted (unrestricted) firms are those firms that repatriated 95 percent or more (less than 95 percent) of the eligible amount.20,21 Table 1 Panel B shows that repatriating firms on average report significantly higher annual changes in PRE despite having significantly lower total and foreign assets compared to non-repatriating firms. Panel C provides a similar view of restricted firms compared to unrestricted firms, although the average total assets of both groups are not significantly different.
billion while mean total assets for all Compustat firms for the same period is only $7.4 billion. I focus on this subsample of relatively large firms because these are the firms with the potential to accumulate the most PRE/repatriate the most earnings under a future tax holiday.
20I define eligible amount as the amount designated as PRE on the most recent audited financial statements filed on
or before June 30, 2003.
21I use 95 percent rather than 100 percent since firms sometimes use approximations in their disclosures. For
18 SECTION 5: RESULTS
SECTION 5.1: POST-ACT CHANGES IN PRE
Before running any regressions I begin by examining the annual changes to PRE in the pre- vs. post-Act period. It seems possible that media and legislators focusing on growing annual changes to PRE in the post-Act period are failing to take into account that the firms themselves generally continue to grow larger over time. That is – these larger changes to PRE could be driven in part simply by the fact that these are now larger firms. Therefore, I use the
ΔPRE variable, which scales the annual change in PRE by total firm assets in order to control for
effects of the changing size of the firm. Table 2 Panel A shows that the mean value of ΔPRE in the years before the Act (1999-2003) is 0.030 while the mean value in the years after the Act (2004-2010) is 0.038, even after scaling for firm size. In addition the different between these numbers is significant at the 1 percent level, suggesting that firms have in fact been relatively increasing their changes to PRE since the Act.
19
Table 2 Panel C shows the results of my main regression. Column 1 displays the results of equation (1) for the entire sample. If H1 were correct we would see significant positive coefficients for each of the year indicator variables, suggesting an ongoing trend of firms
increasing their annual changes to PRE in all, or at least multiple, years after the Act. However, only one year coefficient, FY06, is significant. This indicates that while firms may have
increased their annual changes to PRE in response to the Act, that response was limited to immediately after the Act and was not a continuing trend.
I next investigate whether repatriating firms in particular increased their PRE in the post-Act period. Columns 2 and 3 have the results of equation (1) for the samples of repatriating (column 2) and non-repatriating firms (column 3). Under H1A the coefficients for the year indicator variables would be larger and/or more significant for the repatriating group sample. Like the overall sample the only positive and significant year indicator coefficient for both subsamples is FY06. In addition, that coefficient is larger and more significant for the non-repatriating sample. However, a chi-squared test, as shown in column 4 of Table 2 Panel C, fails to reject that the year indicator variable coefficients for the two samples are equal. This result suggests, contrary to H1A, that there was no difference in how the two groups altered their annual changes to PRE after the Act.
Table 2 Panel D displays the results for equation (1) for restricted firms (column 1) and unrestricted firms (column 2). The coefficient on FY06 is only significant for the unrestricted firm group. In addition, the FY09 coefficient for the restricted firm group is negative and
significant. A chi-squared test, as shown in column 3, suggests that the FY06 coefficients are not significantly different from each other. However, the results suggest that the FY08 and FY09
20
firms actually declared relatively lower changes to PRE in 2008 and 2009. Overall, the results in Table 2 Panels C and D indicate that firms increased their annual change to PRE only in 2006, rather than as part of an ongoing trend in the years after the Act. In addition, it seems that this change was not concentrated in any one group, but occurred across all firms in the sample. Finally, the results also suggest that firms that repatriated the maximum amount under the Act actually reported relatively smaller annual changes to PRE during the recent financial crisis.
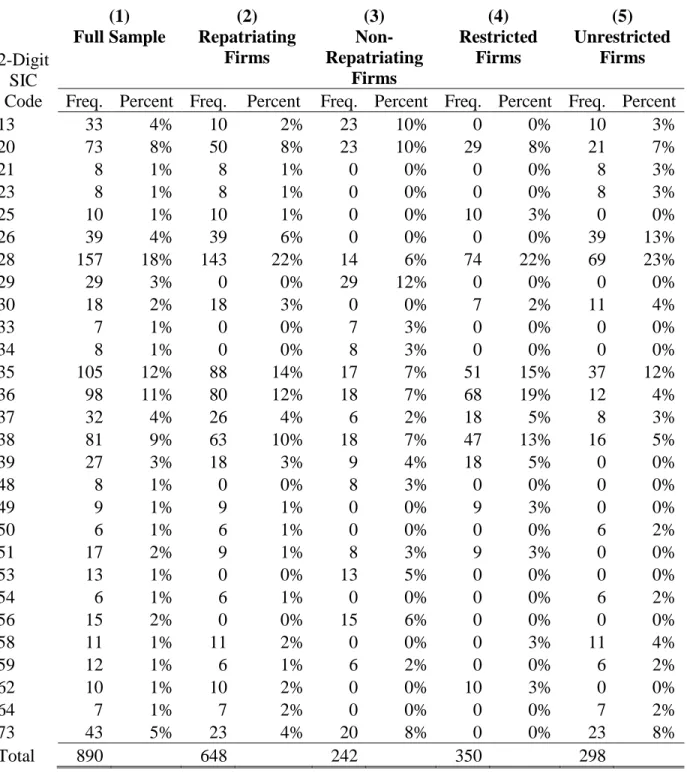
To determine whether industry effects are influencing my results I examine the industry composition of my sample. Table 3 Panel A provides the number of firms in each 2-digit SIC code for the repatriating, non-repatriating, restricted, and unrestricted samples. Industries 28 (Chemicals and Allied Products), 35 (Industrial and Commercial Machinery and Computer Equipment), and 36 (Electronic and Other Electrical Equipment and Components, Except Computer Equipment) each account for more than 10 percent of the sample. To confirm that none of these industries are driving the results in Table 2 I rerun the regression for the
21
FY09 coefficient is significantly lower for the restricted firm group, suggesting that restricted firms made relatively smaller changes to PRE in 2009.
It is worth noting that the industry 28 group contains six of the top 15 repatriations identified in the Majority Staff report (Bristol-Myers Squibb, DuPont, Eli Lilly, Johnson & Johnson, Pfizer, and Procter & Gamble).22 Therefore, I continue my analysis by examining the top repatriating firms.
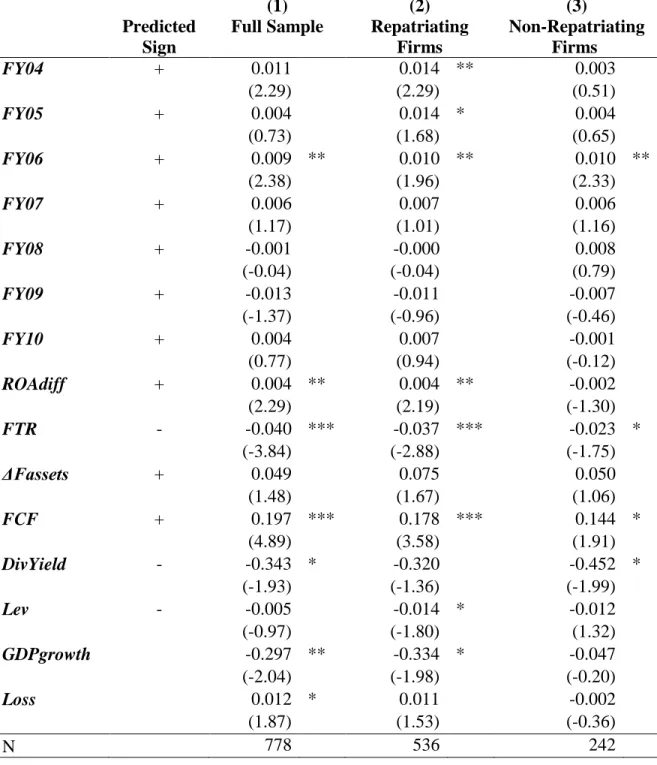
In addition to the six chemicals firms mentioned earlier, the other top 15 repatriating firms in the sample are Hewlett-Packard, IBM, PepsiCo, Intel, Coca Cola, and Altria. The top 15 firms accounted for over half of the total amount repatriated under the Act, so to ensure my results are not driven by solely by these large firms I eliminate them from my sample and rerun my tests. The results in Table 4 Panel A columns 2 and 3 show that the FY06 coefficients for both the repatriating and non-repatriating firms are significantly positive. Interestingly, the repatriating firm group now also has significant coefficients for FY04 and FY05 (and the non-repatriating firm sample’s coefficients remain insignificant). Therefore, I test for differences in
the coefficients for all the year indicator variables. However, for all years the chi-squared test (results untabulated) fails to reject that the coefficients for the two groups are the same. Results for the restricted and unrestricted samples in Table 4 Panel B are similar to the results in earlier tables with unrestricted firms making significantly larger changes to PRE than unrestricted firms during the recent financial crisis.
Next I separate my sample into observations from top 15 and all other firms.23 As seen in Table 4 Panel C, the FY04 and FY06 coefficients are only positive and significant for non-top 15
22
Only 12 of the top 15 firms appear in my sample. I cannot include the remaining three top 15 firms, Schering Plough, Oracle, and Merck, in my sample because of lack of necessary data.
22
firms (and are actually negative for the top 15 firm group). The chi-squared test indicates that the coefficients are statistically significantly different from each other for both years. These results indicate that the significant increase in FY06 seen in the earlier tables was not driven by the firms with the largest repatriations under the Act. In addition, it seems that firms also increased their changes to PRE in FY04. However, given the very small sample for the top 15 firm group it is possible that low power is driving this result.
Although my results suggest an increase in changes in PRE specifically in 2004 and 2006, it is possible that this increase is simply part of a continuing time trend. To determine whether that is the case I examine 1999 through 2003 separately and look for an upward trend occurring even before the Act. I create indicator variables for 2002 and 2003, which serve as my pseudo-post period here.
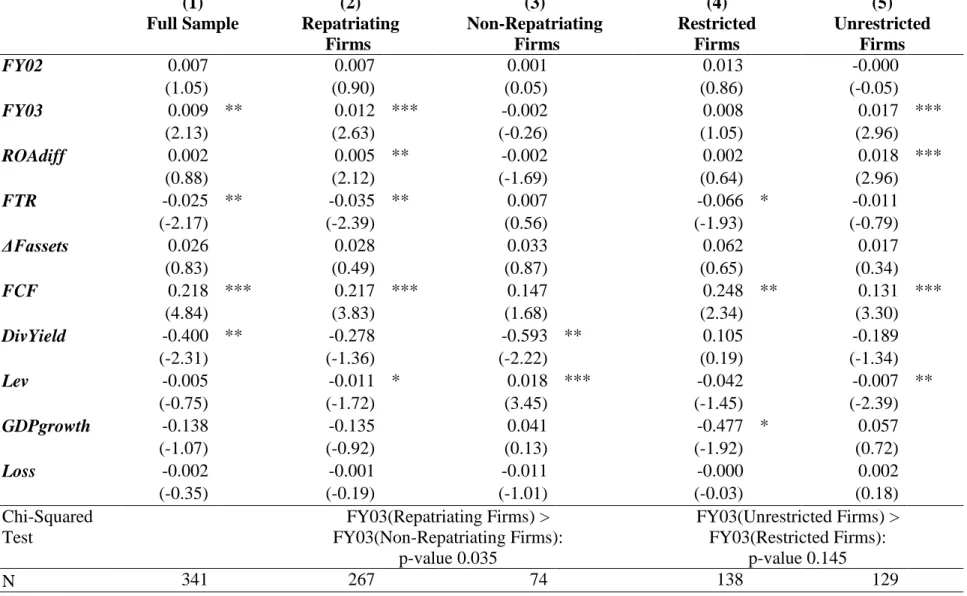
Column 1 of Table 5 Panel A shows the regression results for the whole sample. The coefficient on FY02 is insignificant, but the coefficient on FY03 is significant, indicating that firms began increasing their changes to PRE as legislation for the Act was first introduced. Columns 2 and 3 show that the FY03 coefficient is only significant for the repatriating firm group. A chi-squared test confirms that the coefficients are significantly different from each other, indicating that repatriating firms significantly increased their annual changes to PRE in 2003, as legislation related to the Act was introduced, but before the Act was passed. Columns 4 and 5 show that only the unrestricted firm group has a significant FY03 coefficient, but the chi-squared test fails to reject that the coefficients of both groups are the same.
23
years. These results contrast reports from the media and legislators that the Act led to a
widespread “hording” of PRE in anticipation of another similar tax holiday. Rather it seems that
recent increases to PRE are related to expanding international operations and tax factors that were related to PRE even before the Act.
SECTION 5.2: MARKET VALUATION ANALYSIS
Table 6 provides the results of equation (3).24 Column 1 provides the results of the model without the post-Act variables. Similar to Oler et al. (2007) the coefficients on DNI, FNI, CS,
RE, and PRE are all positive and significant. The coefficient on Tax is negative and significant. Columns 2 through 4 contains a Post indicator variable and a Post*Tax interaction term. Since Oler et al. (2007) show a less negative tax valuation beginning in 2003 in column 2 Post equals one for all years 2003 through 2010. With the addition of these variables the coefficient on Tax
is now positive and insignificant and the coefficient on Tax*Post is negative and significant. These puzzling results indicate that the PRE-related tax liability has a more negative valuation in the post-Act period. It seems possible that rather than the Act permanently adjusting investor valuation, investors only adjust valuation when a repatriation tax holiday is likely, as investors respond in the pre-AJCA period in Oler et al. (2007). If that is true, the post period in column 2 may be dominated by years where investors had a “normal” negative valuation of the tax
liability, not a less negative valuation in anticipation of a tax holiday. Therefore, in column 3 I set Post equal to one only for 2010, as legislation for another tax holiday was introduced. The coefficient on Tax is negative and significant and the coefficient on Tax*Post is positive and significant, indicating that although investors negatively value the tax liability related to PRE
24Following Oler et al. (2007) I scale by total assets. Results are similar if I scale by total shares outstanding as in
24
25 SECTION 6: CONCLUSION
26
FIGURE 1: PRE FOR FIRMS WITH THE 15 HIGHEST REPATRIATIONS UNDER THE ACT
In millions of U.S. dollars. Total reported PRE from the firms with the 15 highest repatriations under the Act: Pfizer, Merck, Hewlett-Packard, Johnson & Johnson, IBM, Schering-Plough, DuPont, Bristol-Myers Squibb, Eli Lilly, PepsiCo, Procter & Gamble, Intel, Coca-Cola, Altria, and Oracle. Note that PepsiCo began reporting PRE in 2002 and Altria stopped reporting PRE in 2007.
0 50,000 100,000 150,000 200,000 250,000 300,000 350,000
27
FIGURE 2: U.S. CORPORATE TAX RATE COMPARED TO OECD AVERAGES
Based on data from Tax Foundation
0.0% 10.0% 20.0% 30.0% 40.0% 50.0% 60.0% 19 81 19 83 19 85 19 87 19 89 19 91 19 93 19 95 19 97 19 99 20 01 20 03 20 05 20 07 20 09 United States Simple Average
28
TABLE 1: DESCRIPTIVE STATISTICS
Panel A – Full Sample (N =890)
Mean Median
Cumulative PRE 4,228 1,513
Change in PRE 710 236
Foreign Assets 5,816 1,236
Total Assets 24,563 12,631
FTR 0.26 0.24
Panel B – Repatriating and Non-Repatriating Samples
Repatriating Sample Non-Repatriating Sample
N = 648 N = 242
Mean Median Mean Median
Cumulative PRE
4,231 1,600 4,220 1,240
Change in PRE
774 254 *** 539
182
Foreign Assets
3,515 1,082 *** 11,976
1,468 Total Assets
19,656 10,900 *** 37,702
17,339 FTR 0.23
0.22 *** 0.31
0.29
29 Panel C – Restricted and Unrestricted Samples
Restricted Sample Unrestricted Sample
N = 350 N = 298
Mean Median Mean Median Cumulative
PRE
4,435 1,897 3,990 1,326
Change in PRE
939 361 *** 581
172
Foreign Assets
2,392 931 *** 4,835
2,211 Total Assets
18,534 12,274 20,973
10,000 FTR
0.20
0.18 ***
0.28
0.26
30
TABLE 2: CHANGES IN FIRM PRE
Panel A – Pre- vs. Post-Act Comparison
1999-2003 (Pre-Act)
2004-2010 (Post-Act)
Mean ΔPRE 0.030 0.038
T-test Mean ΔPRE Post-Act > Mean ΔPRE Pre-Act:
31
Panel B – Regression with Only Post-Act Indicator Variables
(1) Full Sample
(2)
Repatriating Firms
(3)
Non-Repatriating Firms
(4)
Restricted Firms
(5) Unrestricted
Firms
FY04 0.007 0.008 0.008 0.002 0.015
(1.34) (1.29) (1.43) (0.24) (1.61)
FY05 0.000 0.013 0.008 0.017 0.005
(0.06) (1.51) (1.56) (1.36) (0.54)
FY06 0.010 *** 0.012 ** 0.013 *** 0.010 0.013 **
(2.81) (2.55) (3.42) (1.38) (2.50)
FY07 0.013 *** 0.016 *** 0.010 ** 0.025 *** 0.004
(3.21) (3.05) (2.58) (4.43) (0.40)
FY08 0.006 0.005 0.011 0.000 0.010
(1.22) (0.91) (1.52) (0.01) (1.14)
FY09 0.008 * 0.014 *** -0.004 0.011 0.012
(1.76) (2.75) (-0.44) (1.56) (1.55)
FY10 0.005 0.008 0.000 0.006 0.009
(1.01) (1.29) (0.01) (0.58) (1.32)
N 890 648 242 350 298
32
Panel C - Regression Analysis with Control Variables: Full, Repatriating, and Non-Repatriating Firm Samples
Predicted Sign (1) Full Sample (2) Repatriating Firms (3) Non-Repatriating Firms (4) Chi-Squared Test: (3) > (2)
FY04 + 0.007 0.008 0.003 0.714
(1.46) (1.37) (0.51)
FY05 + 0.002 0.013 0.004 0.838
(0.47) (1.64) (0.65)
FY06 + 0.007 ** 0.008 * 0.010 ** 0.361
(2.04) (1.67) (2.33)
FY07 + 0.006 0.007 0.006 0.577
(1.38) (1.24) (1.16)
FY08 + -0.001 -0.002 0.008 0.227
(-0.20) (-0.18) (0.79)
FY09 + -0.009 -0.006 -0.007 0.515
(-1.12) (-0.67) (-0.46)
FY10 + 0.003 0.005 -0.001 0.755
(0.68) (0.87) (-0.12)
ROAdiff + 0.003 ** 0.004 ** -0.002
(2.15) (2.16) (-1.30)
FTR - -0.047 *** -0.044 *** -0.023 *
(-4.31) (-3.35) (-1.75)
ΔFassets + 0.061 ** 0.095 *** 0.050
(2.02) (2.71) (1.06)
FCF + 0.206 *** 0.190 *** 0.144 *
(5.12) (3.83) (1.91)
DivYield - -0.179 -0.139 -0.452 *
(-1.15) (-0.72) (-1.99)
Lev - -0.008 -0.017 * -0.012
(-1.38) (-1.97) (1.32)
GDP- growth
-0.231 (-1.69)
* -0.237 (-1.53)
-0.047 (-0.20)
Loss 0.012 ** 0.007 * -0.002
(2.02) (1.69) (-0.36)
33
Panel D – Regression Analysis with Control Variables: Restricted and Unrestricted Firm Samples Predicted Sign (1) Restricted Firms (2) Unrestricted Firms (3) Chi-Squared Test: (2) > (1)
FY04 + 0.004 0.011 0.270
(0.51) (1.32)
FY05 + 0.014 0.006 0.725
(1.10) (0.82)
FY06 + 0.001 0.012 ** 0.111
(0.12) (2.50)
FY07 + 0.007 0.002 0.678
(1.07) (0.17)
FY08 + -0.021 0.016 0.010 ***
(-1.68) (1.52)
FY09 + -0.032 ** 0.013 0.008 ***
(-2.19) (1.03)
FY10 + 0.004 0.008 0.353
(0.46) (1.06)
ROAdiff + 0.003 * -0.004
(1.82) (-0.38)
FTR - -0.041 * -0.038 **
(-1.74) (-2.27)
ΔFassets + 0.145 ** 0.078 **
(2.51) (2.15)
FCF + 0.200 ** 0.112 **
(2.43) (2.38)
DivYield - 0.149 -0.329
(0.52) (-1.21)
Lev - -0.060 ** -0.010 *
(-2.45) (-1.90)
GDPgrowth -0.664 ** 0.049
(-2.65) (0.34)
Loss 0.008 0.010
(0.95) (0.99)
N 350 298
34
TABLE 3: INDUSTRY ANALYSIS
Panel A – Industry Concentration
2-Digit SIC Code (1) Full Sample (2) Repatriating Firms (3) Non-Repatriating Firms (4) Restricted Firms (5) Unrestricted Firms
Freq. Percent Freq. Percent Freq. Percent Freq. Percent Freq. Percent
13 33 4% 10 2% 23 10% 0 0% 10 3%
20 73 8% 50 8% 23 10% 29 8% 21 7%
21 8 1% 8 1% 0 0% 0 0% 8 3%
23 8 1% 8 1% 0 0% 0 0% 8 3%
25 10 1% 10 1% 0 0% 10 3% 0 0%
26 39 4% 39 6% 0 0% 0 0% 39 13%
28 157 18% 143 22% 14 6% 74 22% 69 23%
29 29 3% 0 0% 29 12% 0 0% 0 0%
30 18 2% 18 3% 0 0% 7 2% 11 4%
33 7 1% 0 0% 7 3% 0 0% 0 0%
34 8 1% 0 0% 8 3% 0 0% 0 0%
35 105 12% 88 14% 17 7% 51 15% 37 12%
36 98 11% 80 12% 18 7% 68 19% 12 4%
37 32 4% 26 4% 6 2% 18 5% 8 3%
38 81 9% 63 10% 18 7% 47 13% 16 5%
39 27 3% 18 3% 9 4% 18 5% 0 0%
48 8 1% 0 0% 8 3% 0 0% 0 0%
49 9 1% 9 1% 0 0% 9 3% 0 0%
50 6 1% 6 1% 0 0% 0 0% 6 2%
51 17 2% 9 1% 8 3% 9 3% 0 0%
53 13 1% 0 0% 13 5% 0 0% 0 0%
54 6 1% 6 1% 0 0% 0 0% 6 2%
56 15 2% 0 0% 15 6% 0 0% 0 0%
58 11 1% 11 2% 0 0% 0 3% 11 4%
59 12 1% 6 1% 6 2% 0 0% 6 2%
62 10 1% 10 2% 0 0% 10 3% 0 0%
64 7 1% 7 2% 0 0% 0 0% 7 2%
73 43 5% 23 4% 20 8% 0 0% 23 8%
35
Panel B – Regression Analysis - Samples without Major Industries: Repatriating and Non-Repatriating Firm Samples
Excluding Industry 28 – Chemicals and Allied Products
Repatriating Firms
Non-Repatriating Firms
FY06 0.010 ** 0.008 *
(2.24) (1.78)
Chi-Squared Test Non-Repatriating Firms > Repatriating Firms FY06: p-value 0.648
N 505 228
Excluding Industry 35 –
Industrial and Commercial Machinery and Computer Equipment Repatriating Firms Non-Repatriating Firms
FY06 0.008 0.010 **
(1.59) (2.26)
Chi-Squared Test Non-Repatriating Firms > Repatriating Firms FY06: p-value 0.358
N 560 225
Excluding Industry 36 –
Electronic, Except Computer Equipment Repatriating
Firms
Non-Repatriating Firms
FY06 0.011 ** 0.009 *
(2.29) (2.02)
Chi-Squared Test Non-Repatriating Firms > Repatriating Firms FY06: p-value 0.625
36
Panel C – Regression Analysis - Samples without Major Industries: Restricted and Unrestricted Firm Samples
All variables in Panels B and C are calculated as described in Appendix A. Intercept, control variables, and other year indicator variables omitted for brevity. Firm-clustered standard errors. t-statistics in parentheses. *, **, and *** indicate significance at the 0.10, 0.05, and 0.01 levels, respectively.
Excluding Industry 28 – Chemicals and Allied Products
Restricted Firms
Unrestricted Firms
FY06 0.006 0.012 **
(0.76) (2.24)
FY09 -0.045 ** 0.018
(-2.60) (1.00) Chi-Squared Test
Unrestricted Firms > Restricted Firms
FY06: p-value 0.242 FY09: p-value 0.004
N 276 229
Excluding Industry 35 –
Industrial and Commercial Machinery and Computer Equipment Restricted Firms
Unrestricted Firms
FY06 0.001 0.012 **
(0.08) (2.70)
FY09 -0.023 0.006
(-1.64) (0.59) Chi-Squared Test
Unrestricted Firms > Restricted Firms
FY06: p-value 0.110 FY09: p-value 0.043
N 299 261
Excluding Industry 36 –
Electronic, Except Computer Equipment Restricted Firms
Unrestricted Firms
FY06 0.007 0.012 **
(0.80) (2.52)
FY09 -0.028 * 0.014
(-1.78) (1.10) Chi-Squared Test
Unrestricted Firms > Restricted Firms
FY06: p-value 0.273 FY09: p-value 0.016
37
TABLE 4: TOP REPATRIATING FIRMS
Panel A – Regression Analysis - Sample without Top 15 Repatriating Firms – Full, Repatriating Firm, and Non-Repatriating Firm Samples
Predicted Sign (1) Full Sample (2) Repatriating Firms (3) Non-Repatriating Firms
FY04 + 0.011 0.014 ** 0.003
(2.29) (2.29) (0.51)
FY05 + 0.004 0.014 * 0.004
(0.73) (1.68) (0.65)
FY06 + 0.009 ** 0.010 ** 0.010 **
(2.38) (1.96) (2.33)
FY07 + 0.006 0.007 0.006
(1.17) (1.01) (1.16)
FY08 + -0.001 -0.000 0.008
(-0.04) (-0.04) (0.79)
FY09 + -0.013 -0.011 -0.007
(-1.37) (-0.96) (-0.46)
FY10 + 0.004 0.007 -0.001
(0.77) (0.94) (-0.12)
ROAdiff + 0.004 ** 0.004 ** -0.002
(2.29) (2.19) (-1.30)
FTR - -0.040 *** -0.037 *** -0.023 *
(-3.84) (-2.88) (-1.75)
ΔFassets + 0.049 0.075 0.050
(1.48) (1.67) (1.06)
FCF + 0.197 *** 0.178 *** 0.144 *
(4.89) (3.58) (1.91)
DivYield - -0.343 * -0.320 -0.452 *
(-1.93) (-1.36) (-1.99)
Lev - -0.005 -0.014 * -0.012
(-0.97) (-1.80) (1.32)
GDPgrowth -0.297 ** -0.334 * -0.047
(-2.04) (-1.98) (-0.20)
Loss 0.012 * 0.011 -0.002
(1.87) (1.53) (-0.36)
38
Panel B – Regression Analysis - Sample without Top 15 Repatriating Firms – Restricted and Unrestricted Firm Samples
Predicted Sign (1) Restricted Firms (2) Unrestricted Firms (3) Chi-Squared Test: (2) > (1)
FY04 + 0.014 ** 0.012 0.579
(2.27) (1.15)
FY05 + 0.017 0.005 0.780
(1.19) (0.76)
FY06 + 0.005 0.012 ** 0.256
(0.67) (2.15)
FY07 + 0.008 0.000 0.708
(1.11) (0.04)
FY08 + -0.021 0.018 0.017 **
(-1.43) (1.46)
FY09 + -0.039 ** 0.014 0.011 **
(-2.29) (0.82)
FY10 + 0.008 0.008 0.486
(0.75) (0.83)
ROAdiff + 0.003 * -0.005
(1.90) (-0.38)
FTR - -0.035 -0.034 *
(-1.50) (-1.98)
ΔFassets + 0.099 0.078
(1.25) (1.58)
FCF + 0.209 ** 0.098 *
(2.49) (1.91)
DivYield - -0.041 -0.486
(-0.12) (-1.24)
Lev - -0.051 * -0.009 *
(-1.99) (-1.72)
GDPgrowth -0.835 *** 0.027
(-3.10) (0.14)
Loss 0.007 0.013
(0.71) (1.04)
39
Panel C – Regression Analysis - Top 15 Firms vs. Non-Top 15 Firms
(1) Top 15 Firms
(2)
Non-Top 15 Firms
FY04 -0.026 0.011 **
(-1.33) (2.30)
FY06 -0.011 0.009 **
(-0.98) (2.36)
FY07 0.004 0.006
(0.31) (1.17)
FY08 -0.010 -0.001
(-0.81) (-0.09)
FY09 0.008 -0.013
(0.45) (-1.41)
FY10 -0.003 0.004
(-0.30) (0.74)
Chi-Squared Test
FY04(Non-Top15 Firms) > FY04(Top15 Firms):
p-value 0.022 FY06(Non-Top15 Firms) >
FY06(Top15 Firms): p-value 0.035
N 111 737
40
TABLE 5: PRE-ACT PERIOD ANALYSIS
(1) Full Sample (2) Repatriating Firms (3) Non-Repatriating Firms (4) Restricted Firms (5) Unrestricted Firms
FY02 0.007 0.007 0.001 0.013 -0.000
(1.05) (0.90) (0.05) (0.86) (-0.05)
FY03 0.009 ** 0.012 *** -0.002 0.008 0.017 ***
(2.13) (2.63) (-0.26) (1.05) (2.96)
ROAdiff 0.002 0.005 ** -0.002 0.002 0.018 ***
(0.88) (2.12) (-1.69) (0.64) (2.96)
FTR -0.025 ** -0.035 ** 0.007 -0.066 * -0.011
(-2.17) (-2.39) (0.56) (-1.93) (-0.79)
ΔFassets 0.026 0.028 0.033 0.062 0.017
(0.83) (0.49) (0.87) (0.65) (0.34)
FCF 0.218 *** 0.217 *** 0.147 0.248 ** 0.131 ***
(4.84) (3.83) (1.68) (2.34) (3.30)
DivYield -0.400 ** -0.278 -0.593 ** 0.105 -0.189
(-2.31) (-1.36) (-2.22) (0.19) (-1.34)
Lev -0.005 -0.011 * 0.018 *** -0.042 -0.007 **
(-0.75) (-1.72) (3.45) (-1.45) (-2.39)
GDPgrowth -0.138 -0.135 0.041 -0.477 * 0.057
(-1.07) (-0.92) (0.13) (-1.92) (0.72)
Loss -0.002 -0.001 -0.011 -0.000 0.002
(-0.35) (-0.19) (-1.01) (-0.03) (0.18)
Chi-Squared Test
FY03(Repatriating Firms) > FY03(Non-Repatriating Firms):
p-value 0.035
FY03(Unrestricted Firms) > FY03(Restricted Firms):
p-value 0.145
N 341 267 74 138 129
41
TABLE 6: INVESTOR VALUATION
Predicted Sign
(1)
Without Post
(2)
Post: 2003-2010
(3)
Post: 2010
(4)
Post: 2003,
2004, and 2010
Intercept 0.753 *** 0.763 *** 0.750 *** 0.791 ***
(4.11) (4.34) (4.10) (4.30)
DNI + 4.986 *** 4.188 *** 4.951 *** 4.950 ***
(8.26) (7.21) (8.21) (8.21)
FNI + 7.965 *** 9.122 *** 8.292 *** 8.069 ***
(5.41) (6.37) (5.59) (5.47)
CS + 0.987 ** 0.823 ** 0.983 ** 0.904 **
(2.28) (1.97) (2.27) (2.08)
RE + 1.245 *** 1.356 *** 1.240 *** 1.216 ***
(3.07) (3.49) (3.06) (3.00)
PRE + 2.794 *** 2.638 *** 2.931 *** 2.717 ***
(4.56) (4.49) (4.76) (4.41)
Tax - -13.839 *** 4.815 -14.862 *** -15.132 ***
(-6.74) (1.53) (-6.83) (-6.97)
Post ? -0.150 *** -0.277 ** -0.035
(-1.85) (-2.00) (-0.45)
Tax*Post + -17.921 *** 4.040 * 3.159 *
(-6.88) (1.75) (1.86)
42
APPENDIX: VARIABLE DEFINITIONS
ΔPRE The change in permanently reinvested earnings reported in the notes to the financial statements from year t-1 to year t. ΔPRE is scaled by total worldwide assets.
ROAdiff The difference between the foreign and domestic after-tax return on assets
in year t- 1. The foreign after-tax return on assets equals foreign pretax income less current foreign taxes, divided by identifiable foreign assets. The domestic after-tax return on assets equals domestic pretax income less current domestic taxes, divided by domestic assets.
FTR The average foreign tax rate equal to year t foreign taxes divided by year t foreign earnings before taxes
ΔFassets The change in foreign from year t-1 to year t, scaled by year t total worldwide assets.
FCF Operating cash flow, scaled by year t total worldwide assets
DivYield Year t dividends paid divided by market value of equity at the end of year t.
Lev Total debt divided by market value of equity (MVE), both measured at the end of year t.
GDPgrowth U.S. Gross Domestic Product (GDP) year t minus U.S. GDP year t-1, scaled
by U.S. GDP year t-1
LOSS Indicator variable equal to 1 if the firm has a domestic after-tax loss for the
year, 0 otherwise.
POST Indicator variable equal to 1 in the post-Act period (fiscal year ending after
enactment of the Act), 0 otherwise.
MVE Market value of common equity three months after fiscal year-end.
DNI After-tax financial statement domestic income.
FNI After-tax financial statement foreign income.
CS Total common equity less total retained earnings at the end of the fiscal year.
RE Total retained earnings less PRE at the end of the fiscal year.
PRE Permanently reinvested earnings reported in the financial statement footnotes.
FETR The average foreign tax rate (current foreign taxes divided by foreign
earnings before taxes) from year t-2 to year t.
43 REFERENCES
Apple Inc. Response Letter to the U.S. Securities and Exchange Commission. 22 July 2013. Ayers, B., C. Schwab, and S. Utke. 2014. Noncompliance with Mandatory Disclosure
Requirements: The Magnitude and Determinants of Undisclosed Permanently Reinvested Earnings. The Accounting Review 90(1): 59-93.
Albring, S. M., L. F. Mills, and K. J. Newberry. 2011. Do Debt Constraints Influence Firms’ Sensitivity to a Temporary Tax Holiday on Repatriations? Journal of American Taxation Association 33(2): 1-27.
Blouin, J. and L. Krull. 2009. Bringing it Home: A Study of the Incentives
Surrounding the Repatriation of Foreign Earnings Under the American Jobs Creation Act of 2004. Journal of Accounting Research 47(4): 1027-1059.
Blouin, J. L., L. K. Krull, and L. A. Robinson. 2012. Is U.S. Multinational Dividend
Repatriation Policy Influenced by Reporting Incentives? The Accounting Review 87(5): 1463-1491.
Blouin, J. L., L. K. Krull, and L. A. Robinson. 2014. The location, composition, and investment implications of permanently reinvested earnings. Working Paper.
Browning, L. “A One-Time Tax Break Saved 843 U.S. Corporations $265 Billion.” The New York Times. 24 June 2008.
Bryant-Kutcher, L., L. Eiler, and G. Guenther. 2008. Taxes and Financial Assets: Valuing Permanently Reinvested Foreign Earnings. National Tax Journal 61(4): 699-720. Ciesielski, J. T. Testimony Before the U.S. Senate Permanent Subcommittee on Investigations of
the Committee on Homeland Security and Governmental Affairs. 20 September 2012. Clausing, K. 2005. Tax Holidays (and Other Escapes) in the American Jobs Creation Act.
National Tax Journal 58(3): 331-346.
Collins, J., J. Hand, and D. Shackelford. “Valuing Deferral: The Effect of Permanently Reinvested Foreign Earnings on Stock Prices.” In International Taxation and Multinational Activity, edited by James R. Hines, 143-166. Chicago: University of Chicago Press, 2001.
DeWaegenaere, A. and R. Sansing. 2008. Taxation of International Investment and Accounting Valuation. Contemporary Accounting Research 25(4): 1045-1066.
Dharmapala, D., C. Foley, and K. Forbes. 2011. Watch What I Do, Not What I Say: The Unintended Consequences of the Homeland Investment Act. The Journal of Finance
44
Donohoe, M. P., G. A. McGill, and E. Outslay. 2012. Through A Glass Darkly: What Can We Learn About A U.S. Multinational Corporation’s International Operations From Its Financial Statement Disclosures? National Tax Journal 65(4): 961-984.
Egan, M. “Wall Street wants tax holiday to be a QE4.” CNN Wire 31 July 2014.
Fleischer, V. “Overseas Cash and the Tax Games Multinationals Play.” New York Times Blogs – Dealbook 3 October 2012.
Foley, C., J. Hartzell, S. Titman, and G. Twite. 2007. Why do firms hold so much cash? A tax-based explanation. Journal of Financial Economics 86: 579-607.
Fontevecchia, A. “U.S. Companies Stashing More Cash Abroad As Stockpiles Hit Record $1.45T.” Forbes 19 March 2013.
Google Inc. Response Letter to the U.S. Securities and Exchange Commission. 20 December 2013.
Graham, J., M. Hanlon, and T. Shevlin. 2010. The Lockout Effect of U.S. Taxation of Worldwide Corporate Profits. National Tax Journal 63(4): 1111-1144.
Graham, J., M. Hanlon, and T. Shevlin. 2011. Real Effects of Accounting Rules: Evidence from Multinational Firms’ Investment Location and Profit Repatriation Decisions. Journal of Accounting Research 49(1): 137-185.
Gravelle, J. and D. Marples. 2011. “Tax Cuts on Repatriation Earnings as Economic Stimulus: An Economic Analysis.” Congressional Research Service report.
Hartman, D. 1985. Tax policy and foreign direct investment. Journal of Public Economic 26(1): 107-121.
Hanlon, M., R. Lester, and R. Verdi. 2014. The Effect of Repatriation Tax Costs on U.S. Multinational Investment. Journal of Financial Economics 116(1): 179-196.
Kocieniewski, D. “Companies Push for Tax Break on Foreign Cash.” New York Times 19 June 2011.
Krull, L. 2004. Permanently Reinvested Foreign Earnings, Taxes, and Earnings Management.
The Accounting Review 79(3): 745-767.
Mock, R. and A. Simon. 2008. Permanently Reinvested Earnings: Priceless. Tax Notes 121(7): 835-848.