Alterations in Nitrogen Cycling Resulting From Oyster Mediated Benthic-Pelagic Coupling
Ashley Rebecca Smyth
A dissertation submitted to the faculty of the University of North Carolina at Chapel Hill in partial fulfillment of the requirements for the degree of Doctor of Philosophy in the
Department of Marine Sciences.
Chapel Hill 2013
Approved by: Michael F. Piehler Marc J. Alperin
© 2013
ABSTRACT
ASHLEY REBECCA SMYTH: Alterations in Nitrogen Cycling Resulting From Oyster Mediated Benthic-Pelagic Coupling
(Under the direction of Michael F. Piehler)
Human activities have resulted in an array of stressors to coastal ecosystems. In the
context of ecosystem function, two prominent changes have been nutrient enrichment and
precipitous declines in the population of the eastern oyster, Crassostrea virginica. Although
historically valued as a fishery, oysters provide broader ecological functions, which include
filtering water thereby reducing turbidity as they feed and providing habitat for fish and
crabs. Despite decades of oyster research, we lack a comprehensive understanding of how
oysters influence nitrogen biogeochemistry in estuarine ecosystems. My research directly
assessed the role of oysters in enhancing sediment denitrification and the efficacy of oyster
reef restoration in alleviating nutrient pollution. I measured net N2 fluxes from five major
estuarine habitats: salt marshes, seagrass beds, oyster reefs and intertidal and subtidal flats.
Given the current habitat distribution in this study system, denitrification (N2 production)
removed approximately 76% of the estimated watershed nitrogen load. Microcosm
experiments were conducted to examine the direct effects of individual oysters on nitrogen
dynamics. Results indicated that biodeposit production and excretion shifted sediments from
a nitrogen source to a nitrogen sink. Experimental plots of live oysters, oyster shells and mud
flats were used to distinguish between the effects of oyster feeding and reef structure on
sediment denitrification. The production and accumulation of biotic material accounted for
effects of the reef structure. Fluxes measured from restored intertidal oyster reef sediments
demonstrated that oyster reefs prime sediments for enhanced denitrification in response to
anthropogenic nitrogen loading; however, the magnitude of this effect is dependent on the
habitat setting of the oyster reef. This research identified mechanisms by which oysters alter
sediment nitrogen dynamics and enhanced our understanding of oyster reef impacts on
ecosystem function. This information is critical for determining where to focus reef
restoration and preservation efforts to produce the greatest benefit. Results from my research
will inform management strategies, restoration projects and policies aimed at improving
ACKNOWLEDGEMENTS
To everyone who has offered help and support during the past six years, this
dissertation is as much yours as it is mine. First and foremost, I would like to thank my
advisor- Dr. Michael Piehler. Mike- you have been nothing but supportive and encouraging
throughout this entire process. Thank you for always finding time to talk science with me, or
help me work through the seemingly endless numbers of catastrophes. You have taught me
more about science and life than you could imagine. Thank you for letting me be independent
while providing enough guidance to keep me from getting into trouble. Throughout my time
in your lab I have become not only a better scientist but also a better person. I am honored to
have worked under your tutelage and look forward to our continued friendship and future
collaborations. To my committee- Dr. Marc Alperin, Dr. Jonathan Grabowksi, Dr. Charles
Peterson, Dr. Stephen Whalen- thank you for your comments and encouragement.
There are no words that can express my gratitude to Suzanne Thompson. She taught
me everything I know about the MIMS. I only hope that one day I can build a membrane as
well as she can. Suz- I cannot tell you enough how grateful I am for all your help. You were
always willing to lend a hand in the field or the lab and helped me from making many
ill-fated decisions, whether with shopping online or experimental design. Thank you for your
patience, support, enthusiasm and all the extra reading you did. You are an amazing scientist
To everyone at the Institute of Marine Science- you make IMS an extraordinary
place, thanks for everything. I am truly grateful to the Paerl lab for letting me work in the
back corner of 219 and for their guidance and resources.
To the Piehler Lab – thank you all for everything. Many thanks to Dr. Scott Ensign
for help in the lab and with the MIMS. Thanks to Dr. Dina Leech for always having an open
door; to Rebecca Schwartz, Teri O’Meara, Luke Dodd, Dana Gulbransen and Caitlin White
for help in the field, advice, and camaraderie; to Kaylyn Siporin for being a great car-buddy
and for GIS help. A special thanks to Laura Stephenson for making fieldwork fun and
reminding me that it is okay not to have a five-year plan.
To the other students who have passed through IMS- thanks for making these last six
years fun and memorable. To Dr. Tim Otten for teaching me about good beer; to Joey
Crosswell for random office visits and entertaining stories; to Beth VanDusen, for your daily
counsel, you are truly a wonderful friend and a great cook; to Dr. Nate Geraldi, thanks for
being my resident oyster expert and the big brother I never had. To Andrea Anton, Raul
Gonzalez, Laura Brown, Maria Vozzo, Emily Elliot, Greg Dusek, and Patrick Gibson- thank
you all for your friendship.
To my friends outside of UNC- thank you for helping me to keep my work-life
balance in check. To Ryan Garr, thank you for your constant reassurance, your editing, your
ability to make me laugh, but most importantly, thank you for weathering all the storms, big
and small, you have been my rock. To my family, thank you for your constant support and
PREFACE
This thesis is organized in manuscript format and includes material that has been
previously published and includes material that is co-authored. The text is divided into six
sections, four of which are formatted for journal articles. The second chapter of my
dissertation is a manuscript published in Estuaries and Coasts with authors A.R. Smyth, S.P.
Thompson, K.N Siporin, W.S. Gardner, M.J. McCarthy, and M.F. Piehler, and the copyright
owner (Springer-Verlag) granted permission for including this material in my thesis.
Additional information regarding the methods used in this thesis can be found in Appendix
TABLE OF CONTENTS
LIST OF TABLES ... xii
LIST OF FIGURES ... xiii
LIST OF SYMBOLS AND ABBREVIATIONS ...xv
Chapter I. INTRODUCTION ...1
Importance of Estuaries ...1
Nitrogen Dynamics in Shallow Coastal Ecosystems ...2
Loss of Suspension Feeding Bivalves ...3
Linking Oysters to Sediment Nitrogen Dynamics ...4
Significance of Research ...4
Study Objectives ...5
II. ASSESSING NITROGEN DYNAMICS THROUGHOUT THE ESTUARINE LANDSCAPE ...8
Abstract ...8
Introduction ...9
Methods ...11
Results ...16
Discussion ...20
Acknowledgements ...26
III. OYSTER MEDIATED BENTHIC-PELAGIC COUPLING MODIFIES NITROGEN POOLS AND PROCESSES ...35
Abstract ...35
Introduction ...36
Methods ...38
Results ...40
Discussion ...41
Acknowledgements ...44
IV. ENHANCED DENITRIFICATION IN OYSTER REEF SEDIMENTS IS A FUNCTION OF BOTH REEF STRUCTURE AND BIODEPOSIT PRODUCTION ...47
Abstract ...47
Introduction ...48
Methods ...50
Results ...56
Discussion ...58
Conclusions ...65
Acknowledgements ...65
V. HABITAT SETTING INFLUENCES NITROGEN REMOVAL BY RESTORED OYSTERS REEFS ...73
Abstract ...73
Introduction ...74
Methods ...76
Discussion ...84
Acknowledgements ...90
VI. CONCLUSIONS ...99
Summary of Results ...100
A Conceptual Model of Oyster Reef Nitrogen Removal ...102
Importance of Scale ...103
APPENDIX ...106
LIST OF TABLES
Table
2.1 Physical and chemical properties of water at each
sampling site for flux experiments ...27
2.2 Mean rates of potential DNRA in two seasons
and five habitats ...28
2.3 Hours inundated and habitat area ...29
4.1 Results from one-way ANOVA ...65
4.2 Fluxes of nitrate and ammonium and denitrification
efficiency for each treatment ...66
5.1 Results from three-way ANOVA testing the effects of reef presence, habitat stetting
and nutrient load ...88
5.2 Results from post-hoc comparison among levels
of habitat ...89
5.3 Results from post-hoc comparison among levels
LIST OF FIGURES
Figure
1.1 Conceptual diagram of the nitrogen cycle in oyster
reef sediments ...7
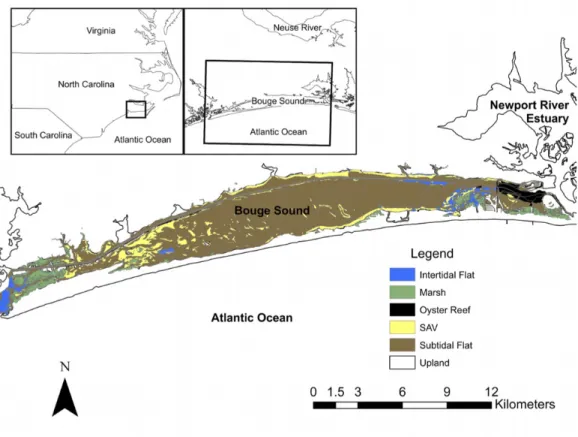
2.1 Location and habitat map of the study area ...30
2.2 Seasonal averaged fluxes in different habitats ...31
2.3 Net N2 flux as a function of SOD ...32
2.4 Annual areal rates of denitrification and annual removal rate for each habitat ...33
3.1 Mean dark, light and net daily O2 Demand and N2 gas fluxes from each treatment ...44
3.2 Mean dark, light and net daily NOx flux, NH4+ flux and N2 gas fluxes from each treatment ...45
4.1 Net N2 flux (a) and SOD (b) for each treatment ...67
4.2 Sediment carbon: nitrogen ratios and SOM for each treatment ...68
4.3 Mean porewater DIN (NOx+NH4+) concentration from the upper 7cm of sediment (a) and benthic chlorophyll biomass (b) for each plot ...69
4.4 Sediment net N2 flux as a function of SOD (a), Ammonium Flux (b), and SOM (c) for each treatment during each sampling period ...70
5.1 The experimental setup of this study ...91
5.2 Mean net fluxes of N2, NOx, and NH4+ before ((a) (c) (e)) and after ((b) (d) (f) experimental nitrogen additions for reef and control areas in each habitat (n=3) ...92
5.4 Mean sediment organic matter from the upper 2cm
of each sample during both sampling events ...94
5.5 Relationship between denitrification and oyster
density under before (a) and after (b) nitrogen addition ...95
6.1 Conceptual model showing how the locations of oyster reef restoration projects can affect the
removal and regeneration of nitrogen ...101
A.1 Comparison of denitrification determined by mass
LIST OF ABBREVIATIONS AND SYMBOLS
% Percent
° Degree
± Plus or minus
15NH4+ Ammonium with 15N stable isotope
1N One equivalent weight of solute per liter of solution
A Surface area
anammox Anaerobic ammonium oxidation
ANOVA Analysis of variance
Ar Argon
C Carbon
Chl. a Chlorophyll a
CHN Carbon, Hydrogen, Nitrogen
Ci Inflow solute concentration
cm Centimeter
Co Outflow solute concentration
DIN Dissolved inorganic nitrogen
DNRA Dissimilatory nitrate reduction to ammonium
Eff Denitrification efficiency
F Flow rate of water through the headspace of a core
HCl Hydrochloric acid
hr Hours
ioutflow Concentration of solutes in the outflow of each core
J Flux
km Kilometer
LD Detection limit
m Meter
MIMS Membrane inlet mass spectrometry
mmol millimoles
N nitrogen
N2 Di-nitrogen gas
N2O Nitrous oxide
NH4+ Ammonium
NO Nitric oxide
NO2- Nitrite
NO3- Nitrate
NOx Nitrate plus Nitrite
O2 Oxygen
ppt Parts per thousand
psu Practical salinity units
SAV Submerged aquatic vegetation
SOD Sediment oxygen demand
SOM Sediment organic matter
µM Micro-molar
1. INTRODUCTION
1.1 Importance of Estuarine Ecosystems
Estuaries are at the critical transition zone between the terrestrial and coastal
ecosystems. These areas provide a variety of ecosystem services including protection from
storm events, storage and cycling of nutrients, and nursery habitat for commercially
important species, while being heavily used for recreational activities (Costanza et al. 1997).
With 38% of the world’s population living within 100 km of the coast (Small and Nicholls
2003), estuarine ecosystems are among the most used and, consequently, the most degraded
systems in the world (Jackson et al. 2001a, Lotze et al. 2006). Estuaries are experiencing
multiple human impacts including dredging, pollution, introduction of invasive species,
over-harvesting, watershed development, and anthropogenic climate change (Vitousek et al.
1997a, Lotze et al. 2006, Worm et al. 2006, Duarte et al. 2009, Beck et al. 2011). The
interactions between these stressors have resulted in loss of several estuarine habitats, with
multiple negative consequences for the services provided by these systems (Duarte 2009,
Barbier et al. 2011, Boström et al. 2011). For example, the combined effects of
over-harvesting and eutrophication have lead to a drastic decline of oyster ecosystems (Lenihan
and Peterson 1998, Lenihan et al. 1999), while sea-level rise and human induced land-use
changes have affected salt marsh habitat (Bertness et al. 2002, Mattheus et al. 2010).
Excessive nutrient loading is a major cause of estuarine ecosystem degradation. Algal
Additional nitrogen inputs from fertilizer use and runoff has lead to eutrophication, the
formation of dead zones, harmful algal blooms, changes to energy flows and loss of
biodiversity (Galloway et al. 2003, Paerl et al. 2006, Conley et al. 2009, Sharp et al. 2009).
The impact of increased nitrogen inputs to the coast is far-reaching, affecting tourism,
recreational water activities and fisheries. Accordingly, regulatory agencies have put in place
policies regarding nitrogen inputs. However, the multiple sources and complexity of the
nitrogen cycle make controlling nitrogen particularly difficult. As such, reduction in nutrient
inputs alone is not enough to recover the lost services and restore ecosystem functions
(Duarte et al. 2009). One solution to combat the effects of increased nutrient loading is to
enhance the system’s overall capacity to remove nitrogen (Brush 2009). Restoring areas that
have high rates of denitrification, the microbially-mediated reduction of nitrate to N2 gas, is a
solution that has promise. Denitrification permanently removes nitrogen from the ecosystem,
thus counteracting eutrophication and reducing the effects of nitrogen pollution.
1.2 Nitrogen Dynamics in Shallow Coastal Ecosystems
Two opposing processes, nitrogen fixation and denitrification help regulate the
availability of nitrogen in estuarine systems. While nitrogen fixation converts atmospheric
nitrogen to bioavailable nitrogen, denitrification releases nitrogen back to the atmosphere as
nitrogen gas (NO, N2O, N2). Denitrification is a dissimilatory nitrate reduction process
performed by heterotrophic bacteria. Denitrifying bacteria are ubiquitous and denitrification
can occur under anoxic conditions when there is ample supply of labile organic matter and
nitrate (Seitzinger et al. 2006). When nitrate for denitrification is supplied through
nitrification, the oxidation of ammonium to nitrate by chemoautoptrohic bacteria, it is
the water column is referred to as direct denitrification. In most coastal systems, where the
concentration of nitrate dissolved in the water is less than 10 µM, the majority of
denitrification is coupled to nitrification (Seitzinger et al. 2006).
1.3 Loss of Suspension Feeding Bivalves
Oyster reef ecosystems have been reduced by 85% world-wide (Beck et al. 2011)and
fisheries landings of the eastern oyster, Crassostrea virginica (Gmelin 1791) in North
Carolina have declined by 90% in the last century (Lenihan et al. 2003, Beck et al. 2011).
The dramatic decline in oyster reef ecosystems is the result of interactive effects between
over-harvesting, destructive harvesting practices, increased spread of diseases and decline in
water quality (Lenihan and Peterson 1998, Burreson et al. 2000, Beck et al. 2011). Oysters
exert top down control on cultural eutrophication by removing phytoplankton biomass as
they feed (Jackson et al. 2001a, Cerco and Noel 2007). This action reduces turbidity and
allows light to penetrate deeper into the water column, which enhances the production of
seagrass and benthic algae (Dame et al. 1984, Newell 2004). Oysters can also have
bottom-up effects on eutrophication, where production and accumulation of biodeposits can change
nutrient processing within the sediment and stimulate denitrification (Newell et al. 2002,
2005). Consequently, restoration of these filter-feeding bivalves has been suggested as a way
to reduce phytoplankton biomass and mitigate nutrient loads (Jackson et al. 2001a, Cerco and
Noel 2007, Coen et al. 2007, Fulford et al. 2010). However, oysters may also recycle
nitrogen back to the water column, which may fuel primary production (Dame et al. 1984,
1989, Newell et al. 2002). Before oyster reef restoration can be included in nutrient
management plans, it is necessary to understand and quantify the effects of oyster reefs on
1.4 Linking Oysters to Sediment Nitrogen Dynamics
Studies of oysters have focused on the effects of suspension feeding and metabolism
by oyster reefs. As oysters feed and reduce phytoplankton biomass, water column
concentration of ammonium increases as a result of excretion (Dame et al. 1989, 1992). This
ammonium may be recycled back to the water column and used to further support
phytoplankton production (Dame et al. 1989, Newell 2004). However, the unassimilated
fraction of the nitrogen and carbon that was originally incorporated in phytoplankton is
released as biodeposits, a mucus aggregate of feces and pseudo-feces (Newell and Jordan
1983). Biodeposits accumulate on the sediment as particulate organic matter and serve as a
nutrient source for microbial metabolism (Newell et al. 2002, Giles and Pilditch 2006,
Higgins et al. 2013). When biodeposits settle on aerobic sediments, nitrogen removal can be
stimulated through increased coupled nitrification-denitrification (Newell et al. 2005). While
increased denitrification from oyster biodeposits has been found in laboratory experiments
(Newell et al. 2002), the effect of oysters on sediment nitrogen dynamics remains unclear
because measurements of denitrification have not previously been conducted on sediments
associated with oyster reefs. Figure 1.1 illustrates the interactions between oysters and the
sediment nitrogen dynamics.
1.5 Significance of Research
My dissertation research focused on understanding how the eastern oyster,
Crassostrea virginica, affects biogeochemical processes in shallow water coastal systems.
Research was conducted to evaluate the effects of the individual organisms and the
interacting effects between the oyster, the reefs they form and the ecosystem on nitrogen
of nutrients were measured from natural and restored oyster reefs as well as reference sites
and other estuarine habitats throughout North Carolina’s estuaries and sounds. This
information is critical for accurately assessing one of the most important ecosystem services
provided by oysters and determining where to focus restoration and preservation efforts to
produce the greatest benefit.
1.6 Study Objectives
1. Spatial and Temporal Variability in Sediment Nitrogen Dynamics
a. Objective: Characterize spatial and temporal patterns of sediment nitrogen
dynamics in shallow water estuarine habitats.
b. Hypothesis: Habitat type and temperature will affect rates of denitrification in
shallow water coastal systems.
2. Linking Oysters to Biogeochemistry
a. Objective: Quantify the direct effects of an oyster on nitrogen removal and
regeneration.
b. Hypothesis: Particulate organic matter from Crassostrea virginica will
enhance rates of denitrification by providing a source of high quality organic
matter and increasing availability of NH4+ for coupled
nitrification-denitrification.
3. The Influence of Ecosystem Engineering On Sediment Denitrification
a. Objective: Elucidate the relative importance of the accumulation of biotic and
abiotic material to the production of N2 from oyster reef sediments.
b. Hypothesis: Interactions between the biological function and physical
4. Importance of Landscape Position
a. Objective: Determine how the habitat setting of oyster reef restoration affects
oyster mediated sediment N2 production in response to nutrient pollution.
b. Hypothesis: Restored oyster reefs will increase N2 production relative to
2. ASSESSING NITROGEN DYNAMICS THROUGHOUT THE ESTUARINE LANDSCAPE1
2.1 Abstract
Assessing nitrogen dynamics in the estuarine landscape is challenging given the
unique effects of individual habitats on nitrogen dynamics. We measured net N2 fluxes,
sediment oxygen demand and fluxes of ammonium and nitrate seasonally from five major
estuarine habitats: salt marshes, seagrass beds (SAV), oyster reefs and intertidal and subtidal flats. Net N2 fluxes ranged from 332 ± 116 µmol N-N2 m-2 hr-1 from oyster reef sediments in
the summer to -67 ± 4 µmol N-N2 m-2 hr-1 from SAV in the winter. Oyster reef sediments
had the highest rate of N2 production and the highest rates of ammonium release from
the sediments of all habitats. Potential rates of dissimilatory nitrate reduction to
ammonium (DNRA) were measured during the summer and winter. DNRA was low during
the winter and ranged from 4.5 ± 3.0 in subtidal flats to 104 ± 34µmol 15NH4+ m-2 hr-1 in
oyster reefs during the summer. Annual denitrification, accounting for seasonal differences in
inundation and light, ranged from 161.1 ±19.2 mmol N-N2 m-2 yr-1 for marsh sediments to
509.9 ± 122.7 mmol N-N2 m-2 yr-1 for SAV sediments. Given the current habitat distribution
in our study system, an estimated 28.3 x 10⁶ mols of N are removed per year or 76% of
estimated watershed nitrogen load. These results suggest that restoration has the
potential to increase system-wide denitrification through selection of habitats with
high rates of N2 production per m2 and areas with favorable inundation regimes.
2.2 Introduction
Estuaries are complex ecosystems, influenced by marine, terrestrial and atmospheric
inputs of material and energy. Complex interactions within these ecosystems are important
determinants of the diversity and composition of the ecological community (Hosack et al.
2006). Dominant habitats in the temperate estuarine landscape include salt marshes, seagrass
beds (SAV), oyster reefs and intertidal and subtidal flats. Each habitat has a unique effect on
ecosystem function, such that the variety and areal extent of habitats influences the type and
amount of services provided by the estuary (Correll 1978, Jones et al. 1994, Cloern 2007,
Eyre and Maher 2010, Barbier et al. 2011).
Estuarine habitats provide many valuable ecosystem services, but these areas are
often threatened by human activities (Vitousek et al. 1997b, Lotze et al. 2006, Brush 2009,
Barbier et al. 2011, Beck et al. 2011). Eutrophication, which is accelerated by excessive
nitrogen loading, has many negative consequences including loss of biodiversity, increased
algal blooms, degradation of water quality, acceleration of species invasions and shifts in
dominant biogeochemical pathways (Howarth et al. 1988, Nixon et al. 1995, Jackson et al.
2001a, Lotze et al. 2006, Paerl et al. 2006, Burgin and Hamilton 2007). Once nitrogen enters
the estuary, it can be removed through burial, physical transport, or denitrification, the
microbial conversion of inorganic nitrogen to N2 gas (Vitousek et al. 1997b). N2 production
can result from the heterotrophic reduction of nitrate (classical denitrification) or through
anaerobic ammonium oxidation (anammox) by chemolithoautotrophs (Burgin and Hamilton
anammox (Dalsgaard et al. 2005, Koop-Jakobsen and Giblin 2009) and accounts for the
majority of nitrogen loss in estuarine ecosystems (Seitzinger and Nixon 1985, Seitzinger
1988).
Unfortunately, anthropogenic activities have disrupted the balance between nitrogen
inputs and exports, resulting in an increase in instances of eutrophication (Brush 2009).
Nutrient recycling within estuaries helps to maintain water quality and supplies essential
nutrients for the base of the food web. These services provide about $21,100 ha-1 (in 1994 US
dollars) nitrogen removal in estuaries annually (Costanza et al. 1997). However, the overall
amount of nitrogen removal depends on the distribution of specific habitats with some
habitats conferring a greater ecosystem service than others (Valiela and Bowen 2002,
Cardinale 2011). For example, the conversion of SAV to subtidal flat due to increased use of
shoreline hardening structures could result in a loss of $2,500 per acre per year worth of
nitrogen removal (Piehler and Smyth 2011).
To improve water quality, many management and restoration strategies aim to
enhance nitrogen removal within estuarine ecosystems (Galloway et al. 2003, Cerco and
Noel 2007, Brush 2009, Barbier et al. 2011). However, landscape-scale assessment of
nitrogen removal is complicated by the variety of estuarine habitats and temporal variability
in denitrification rates (Cornwell et al. 1999, Groffman et al. 2006, Seitzinger 2008). While
habitat type is a factor in determining transformations and exchanges of nitrogen in estuarine
ecosystems (Gutierrez and Jones 2006, Eyre et al. 2011b, Piehler and Smyth 2011, Eyre et al.
2011a), the areal extent and location of these habitats relative to tidal regime will also impact
nitrogen removal, influencing the time that sediments experience reduced conditions when
landscape-scale water quality benefits of estuarine restoration requires knowledge of the
location and elevation of habitats associated with rates of nitrogen removal.
2.2.2 Objectives
This study investigated nitrogen dynamics in the major habitats of a temperate
estuary. To evaluate the influence of habitat type on nitrogen dynamics, we examined
multiple nitrogen cycling processes, seasonally, in sediments from intertidal oyster reefs,
marshes, SAV and intertidal and subtidal flats. A model based on habitat area, elevation,
water level and irradiance was created to extrapolate denitrification through both space and
time. Using this approach, we were able to synthesize and adjust rate processes measured
from individual habitats to the landscape scale.
2.3 Methods
2.3.1 Site description
Bogue Sound is a medium sized sound in the southeastern region of North Carolina
(Figure 2.1). The mean water depth is 3m and semi-diurnal tides are approximately 0.7m.
The sound has low levels of dissolved inorganic nutrients (0.90 ± 1.32 µM NOx- + NH4+,
n=263) and water-column chlorophyll a (4.5 ± 2.3 µg/l, n=261; Thompson, unpublished).
Bogue Sound is a diverse ecosystem located at the convergence of the South Atlantic and
Mid-Atlantic biogeographic regions. A variety of habitats exist within the sound and include
oyster reefs, SAV (dominated by Halodule wrightii in the spring and Zostera marina in the
fall), salt marshes and intertidal and subtidal flats (Street et al. 2004). Habitats of each type
were sampled for this study. Subtidal and intertidal flats sampled were relatively
Representative habitat sampling sites were located on the southern shoreline of Bogue
Sound in the Roosevelt Natural Area and were sampled once per season during 2008
(January, March, July and November). In situ surface water temperature, salinity and
dissolved oxygen were measured at each sampling (YSI 600 Series Sonde and Model 650
data logger, Yellow Springs Instruments, Yellow Springs, OH).
2.3.2 Sample collection
Triplicate sediment cores were collected by hand from each habitat two hours prior to
low tide in clear polycarbonate core chambers (6.4cm diameter X 30 cm). Core chambers
were inserted directly into the sediment and pushed down so that each core contained 17 cm
of sediment with minimal disturbance to the upper layer of sediment. Cores from SAV and
marshes often contained roots and rhizomes as well as emergent vegetation. Cores were
collected within each habitat with the exception of the oyster reef, where cores were
collected immediately adjacent to the reef and did not include live oysters. In addition to
sediment cores, ~30 l of sound water was collected for continuous flow core incubations.
2.3.3 Analytical methods
Details regarding methods used in this study can be found in the appendix.
2.3.3.1 Membrane inlet mass spectrometry
Following collection, sediment cores and water were immediately (<1hr) transported
to an environmental chamber (Bailey, Inc.) set to in situ water temperature at The University
of North Carolina Institute of Marine Sciences (IMS) in Morehead City, NC. Dark conditions
were maintained throughout the course of the incubation to minimize the effects of
photosynthetic algae (An and Joye 2001, Tobias 2007, Hochard et al. 2010) and to prevent
the formation of bubbles that would affect gas concentrations in water (Reeburgh 1969).
and outflow port with ~400ml of water overlying each core and incubated in a continuous
flow system (Miller-Way and Twilley 1996, Lavrentyev et al. 2000, Ensign et al. 2008).
Unfiltered, aerated water from the reservoirs was passed over the cores at a flow rate of 1.0
ml min-1 (Miller-Way and Twilley 1996, Lavrentyev et al. 2000).
Following an 18-hour pre-incubation period (Eyre et al. 2002), samples were
collected from the outflow port of each core three times over a 48-hour period to ensure
steady state conditions were established (Miller-Way and Twilley 1996). A bypass line that
flowed directly into sample vials was used to determine the concentration of dissolved
constituents entering the cores was also sampled during each of the three times over
the 48-hour period. This line accounted for changes in water chemistry associated with
permeability of the tubing in the water entering the cores. Successive measurements from
each core were averaged to give core specific values and reduce pseudo-replication
associated with sample replication rather than treatment replication (Hurlbert 1984).
Samples were analyzed for N2, O2 and Ar dissolved gases in water using a Balzers
Prisma QME 200 quadruple mass spectrometer (MIMS; Pfeiffer Vacuum, Nashua, NH,
USA; (Kana et al. 1994). Concentrations of O2 and N2 were determined using the ratio with
Ar (Kana et al. 1994, Ensign et al. 2008). MIMS has a rapid analysis time, requires a small
sample volume and little sample preparation, and has good precision (CV of N2/Ar <0.05%,
CV of O2/Ar<0.04%). This method determines the net flux (production-demand) across the
sediment-water interface such that a positive N2 flux is assumed to be denitrification and a
negative N2 flux is assumed to be nitrogen fixation (An et al. 2001, Fulweiler et al. 2007).
This method does not discern between N2, production from denitrification, anammox or any
represent rates of sediment oxygen demand (SOD; (Kana et al. 1998, Piehler and Smyth
2011)).
2.3.3.2 Dissolved Nutrient Analysis
Water samples (50ml) were collected for nutrient analysis from the bypass line and
the outflow port of each core 24-hours after the incubation began. Water was filtered through
Whatman GF/F filters (25 mm diameter, 0.7 µm nominal pore size), and the filtrate was
analyzed with a Lachat Quick-Chem 8000 (Lachat Instruments, Milwaukee, WI, USA)
automated ion analyzer for nitrate (NO3- and NO2-) and ammonium (NH4+) (detection limits:
0.04 µM, 0.18 µM, respectively).
2.3.3.3 Dissimilatory Nitrate Reduction to Ammonium
Isotopic enrichment experiments were conducted to provide potential rates of
dissimilatory nitrate reduction to ammonium (DNRA). DNRA experiments were preformed
on cores collected during summer 2007 in conjunction with Piehler and Smyth (2011) and
during winter 2008 on cores collected as part of this study. In each case, after the initial 48
hours of sampling, the incubation water was enriched with 15N-NaNO3 to a final
concentration of about 100µmol l-1. Incubations were continued and samples were collected
at 24 and 48 hours after the enrichment for analysis. Concentration of 15NH4+ was measured
by HPLC (Gardner et al. 1995), and potential DNRA rates were calculated as production of 15NH4+ (An and Gardner 2002). Total ammonium and nitrate concentrations were measured
after enrichment using Lachat Quick-Chem 8000 (described above).
2.3.4 Calculations
Flux calculations were based on the assumption of steady-state conditions and a
well-mixed water column (Miller-Way and Twilley 1996). Benthic fluxes, including rates of
potential DNRA, were calculated using the following equation:
Equation 1: Formula used to calculate a flux from the continuous flow core incubation method.
where [i outflow] and [i inflow] is the concentration (µM) of any dissolved constituent leaving
and entering the core, respectively, F is the peristaltic pump flow rate (l hr-1), and A is the
surface area of the core (m2) (Miller-Way and Twilley 1996). [i outflow] is the average of
three measurements of samples collected over a 48-hour period; [i inflow] is the
average of the three measurements from the bypass line collected over a 48-hour
period. For nitrogen species, a positive flux indicates an exchange from the sediment to the
water column, and a negative flux indicates an exchange from the water column to the
sediment. For O2, a positive flux indicates an exchange from the water column and is
denoted as SOD. Habitat specific fluxes were calculated as the mean of core specific
values from replicates (n=3). Errors presented here are the standard error of the means (n=3).
2.3.4.2 Determination of inundation time
Average hours inundated per day were modeled based on water level and irradiance
(adjusted based on the season) for each day of the year. Elevation surveys were conducted at
three different individual habitats (including habitats where cores were collected) during low
tide on 16 October 2009, 25 October 2009 and 15 November 2009 to obtain mean elevation
for each habitat type (n=3). Habitat elevation was determined using an automatic laser level
(Model SAL24N, CST/Berger, Watseka, IL) with methods adapted from Storesund (2008). J=
(
[
ioutflow]
-[
iinflow]
)
*Fwater level data logger (Model: U20-001-01, Onset Corporation, Pocasset, MA) from 25
September 2009 to 23 October 2009, to encompass one spring-neap tidal cycle. Water levels
were corrected using in situ temperature and barometric pressure. Site-specific water level
was indexed to water level data obtained from a NOAA monitoring gauge at Beaufort, NC
collected during the same period. This relationship was then applied to NOAA water level
data for December 1, 2007 to November 30, 2008 to hind cast levels at the Bogue Sound
study site for the same period. Inundation was calculated as the duration when water levels
were greater than sediment surface elevation. Total hours inundated between sunset and
sunrise were calculated for each day and totaled for each season and each habitat. This value
was used to scale the average hourly rate of N2 production (positive N2 flux) measured once
during each season for each habitat under dark inundated conditions to annual rates. Annual
rates were extrapolated for Bogue Sound using habitat maps from the North Carolina
Division of Marine Fishers (NCDMF; (Chappell 2006)).
2.3.5 Data analysis
Analysis of variance (ANOVA) and Tukey’s post-hoc test were used to test whether
net N2 flux, SOD, ammonium flux, nitrate flux, and DNRA varied by site and season. If
necessary, data were transformed to meet the assumptions of ANOVA. Linear regressions
were used to assess the relationship between net N2 flux and SOD. Analysis of covariance
(ANCOVA) was used to determine if the regression lines were different between habitats.
All analyses were considered significant at the p<0.05 level and were conducted in JMP 7.0.1
statistical software (SAS 2007).
2.4 Results
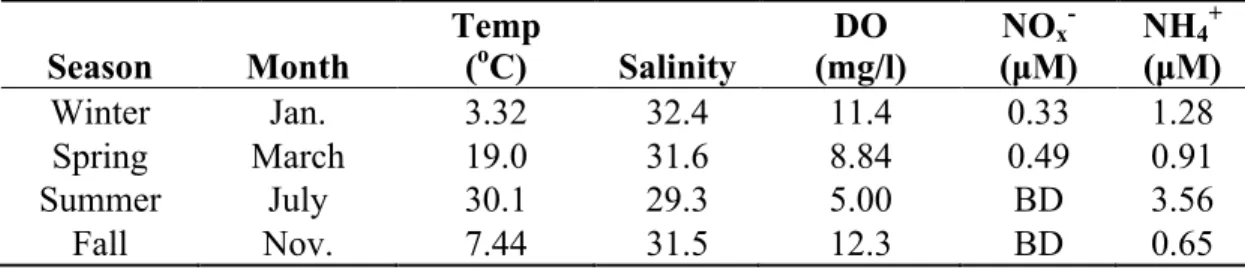
The lowest water temperature occurred in January 2008 at 3.32 oC, and the highest
was 30.1 oC in June 2008 (Table 2.1). Salinity ranged from 29.3 in July 2008 to 32.4 in
January 2008 with a mean salinity of 31.2. Dissolved oxygen ranged from 5 mg/l in the July
of 2008 to 12.3 mg/l in October 2008. Ambient nitrate concentration was consistently less
than 0.5 µM. Ammonium ranged from 0.65 µM in October 2008 to 3.56 µM during July
2008.
2.4.2 Dissolved Oxygen
SOD was lowest in the winter and fall and highest in the summer for all habitats (Figure 2.2a). SOD ranged from 33.61 ± 16 µmol O2 m-2 hr-1 during winter in SAV to 2556
± 11 µmol O2 m-2 hr-1 in the summer at oyster reefs. Significantly higher seasonal rates were
measured for all habitats during the summer (p<0.05). Oyster reefs had significantly more
oxygen demand than the other habitats, driven by rates measured during the spring and
summer.
2.4.3 Dissolved N2
Net N2 fluxes varied by site and season and the interaction was not significant (Figure 2.2b, p=0.086). N2 fluxes ranged from 332 ± 116 µmol N-N2 m-2 hr-1 for the oyster reef in
the summer to -67 ± 4 µmol N-N2 m-2 hr-1 for SAV in the winter. All N2 fluxes from the
oyster reef were positive with high variability during the summer, including a rate of 566.2
µmol N-N2 m-2 hr-1 in one core. In general there were positive N2 fluxes in the summer and
negative N2 fluxes during the other seasons. Negative N2 fluxes were observed in sediments
from the subtidal flat in spring and fall, intertidal flat in winter and spring, marsh and SAV in
winter, spring and fall. Oyster reefs were the exception with positive N2 fluxes occurring
high production in the summer and marshes had the lowest flux (-4 ± 18 µmol N-N2 m-2 hr-1,
n=12). Net N2 fluxes varied significantly with SOD (Figure 2.3, R2=0.63, p<0.001). This
relationship was observed for all habitats and all seasons, except fall, when variability among
rates was the highest.
2.4.4 Dissolved Inorganic Nitrogen
Nitrate fluxes were not affected by habitat type but did vary by season (Fig 2.2c,
p=0.0028). There was no uptake or efflux of nitrate during the summer or fall for any habitat
(i.e. no difference between concentration of nitrate leaving and entering the cores). All
habitats exhibited an efflux of nitrate during the winter and demand during the spring, except
SAV sediments, which had an efflux of nitrate during winter and spring. In general nitrate
fluxes were low and highly variable, consistent with the low ambient nitrate concentration
found in this study area.
Ammonium fluxes were also variable and exhibited no seasonal pattern (Figure 2.2d)
but oyster reef sediments were significantly higher than other habitats (p=0.0002). The
interaction between season and habitat was also significant (p<0.0001). The single largest
efflux of ammonium occurred in oyster reef sediments during the summer (198 ± 114 µmol
NH4+ m-2 hr-1) when all oyster reef cores showed an efflux of ammonium greater than 100
µmol NH4+ m-2 hr-1; the highest efflux was 332.9 µmol NH4+ m-2 hr-1. Seasonal differences
were not detected for SAV or marsh habitats, while subtidal and intertidal flats had
significantly more uptake of ammonium during the summer compared to the other seasons
(p=0.008 and 0.0004, respectively).
2.4.5 Dissimilatory Nitrate Reduction to Ammonium (DNRA)
Potential DNRA rates were higher in the summer than the winter (Table 2.2,
34.3 µmol 15NH4+ m-2 hr-1). On average, DNRA used 4.2% of the nitrate flux directed into
the sediment during the summer. Given the small nitrate fluxes prior to the addition for
DNRA, it was assumed that 15NO3- comprised the majority of the NO3- flux was compared to
the 15NH4+ fluxes (An and Gardner 2002). The percent of the nitrate flux for DNRA was
calculated as the proportion of the added nitrate flux that was 15NH4+. Despite high DNRA
rates in the oyster reefs, this process only accounted for 11.2% of the nitrate flux during this
time, however a very large ammonium efflux was detected for each habitat after the addition.
2.4.6 Extrapolations
Subtidal habitats (SAV and subtidal flats) were constantly inundated (Table 2.3). For
habitats with variable inundation, intertidal flats were inundated the longest, followed by
oyster reefs and marshes. Annual N2 production (adjusted for illumination and inundation)
ranged from 146.0 ±17.4 mmol N-N2 m-2 yr-1 from the marsh habitat to 509.9 ± 122.7 mmol
N-N2 m-2 yr-1 from SAV (Figure 2.4). The low rates from the marsh habitat are the result of
few instances of N2 production coupled with the high elevation relative to water level.
Annual N2 areal production, adjusted for inundation, from oyster reef sediments was not
significantly different from SAV sediments.
The annual rate of nitrogen removal (mol N yr-1) was determined by extrapolating the
annual N2 production rates to the estuary using total area comprised by each habitat (Table
2.3). Assumptions of this extrapolation are that similar habitats exhibit similar effects on
ecological processes and are affected by light and tide the same as the habitats used in this
study. Results from this extrapolation indicated that subtidal flat habitats remove
significantly more nitrogen per year than the other habitats because of the large area of these
2.5 Discussion 2.5.1 Net N2 Fluxes
Negative N2 fluxes, which indicate nitrogen fixation, (Fulweiler et al. 2007) were
found in sediments from SAV, marsh, subtidal flat and intertidal flat habitats during several
seasons. Nitrogen fixation rates exceeding denitrification are not uncommon in estuaries
(Joye and Paerl 1994, Currin et al. 1996, An and Joye 2001, Fulweiler et al. 2007, Fulweiler
and Nixon 2011). Because incubations were conducted in the dark, heterotrophic bacteria
were likely responsible for nitrogen fixation in these habitats (Howarth et al. 1988, Currin et
al. 1996). High rates of nitrogen fixation are likely inversely related to ammonium
concentrations; fixation is inhibited when sediments have high concentrations of extractable
and soluble ammonium (Howarth et al. 1988). Although we did not measure porewater
ammonium concentrations, there was low ammonium in overlying water and ammonium
uptake by the sediments from these habitats. Therefore, in these N-limited systems, the
additional nitrogen demand may be met through nitrogen fixation (Howarth and Marino
2006). In contrast, the high concentration of ammonium associated with oyster biodeposits
(Newell et al. 2005, Higgins et al. 2011) was reflected in large ammonium fluxes and greater
N2 production from the oyster reef habitat.
Oyster reef sediments had the largest flux of ammonium from the sediment to
the water column. High ammonium production from oyster reef sediments, especially
during the summer, probably resulted from elevated oyster filtration rates (and thus
organic matter deposition on the sediments) during this time (Grizzle et al. 2008,
Pomeroy et al. 2006, Dame et al. 1992, Dame et al. 1985). High ammonium
production suggests that heterotrophic bacteria were actively using the deposited
contribute to high ammonium production; however, this was not a source in this
study since oysters were not included in the sediment incubations.
The largest positive N2 fluxes, (denitrification) occurred in the summer for all
habitats. Seasonal differences in denitrification rates are common (Thompson et al. 1995,
Eyre and Ferguson 2005, Piehler and Smyth 2011, Fulweiler and Nixon 2011), with higher
rates in warmer months, when metabolism is higher (Brown et al. 2004). While the majority
of N2 fluxes measured over the course of an annual cycle for SAV, subtidal flat and intertidal
flat sediments were negative in cooler months; high positive N2 fluxes in the summer made
average N2 fluxes positive. For the marsh habitat, positive N2 fluxes in the summer and large
negative N2 fluxes in cooler months resulted in average fluxes that were not significantly
different from zero, suggesting a balance between denitrification and nitrogen fixation. This
result agrees with previous studies that have documented higher rates of nitrogen fixation
relative to denitrification from sandy fringing marshes (Currin et al. 1996, Davis et al. 2004).
Nitrate required for denitrification can diffuse from the water column into the
sediments (direct denitrification) or be produced in sediment through nitrification (coupled
nitrification-denitrification). The low nitrate concentration in the overlying water (less than
0.5 µM) and small fluxes of nitrate into the sediment make direct denitrification unlikely in
our study system (Seitzinger et al. 2006). Nitrate fluxes were low, but within the range of
values measured from other oligotrophic systems with low ambient nitrate concentrations
(Weston et al. 1996, Fear et al. 2005, Eyre et al. 2011a). The lack of a seasonal or habitat
effect on nitrate fluxes suggests that coupled nitrification-denitrification was the dominant N2
production pathway for all habitats. We found nitrification to support on average about 98%
Oyster reefs had the highest rates N2 production per area. Studies of denitrification in
oyster reef sediments are rare (Piehler and Smyth 2011), particularly when compared to SAV
and marsh habitats. Current understanding of oyster-mediated denitrification stems from
laboratory experiments using pelletized phytoplankton to simulate biodeposits, suggesting
that the presence of oysters increases coupled nitrification-denitrification in the sediment
(Newell et al. 2002). Our results support this hypothesis and suggest that denitrification was
limited by the availability of nitrate. However, the elevated ammonium production and high
SOD suggests that nitrification was limited by oxygen (Cornwell et al. 1999).
2.5.2 Sediment Oxygen Demand
SOD was highest for the oyster reef sediments, indicating that the organic matter in
this habitat is more rapidly metabolized compared to the other habitats. This difference is
probably the result of the biodeposits associated with the oysters’ feeding process (Newell et
al. 2005). SOD from the marsh was low compared to other studies (Caffrey et al. 2007).
Marshes in this study area were fringing marshes with sandy sediments (Mattheus et al.
2010). Habitats with sandy sediments have been associated with lower quality carbon despite
large amounts of organic matter (Vance-Harris and Ingall 2005, Morgan et al. 2009),
resulting in lower SOD.
We found a strong positive relationship between SOD and N2 fluxes for all habitats.
In estuarine sediments, SOD is primarily from organic matter mineralization, nitrification
and sulfide oxidation. High sediment SOD is often associated with high organic matter and
decreased sediment oxygen penetration depth (Cornwell et al. 1999). Additionally, the
positive relationship between SOD and denitrification has been found in coastal ecosystems
where denitrification is coupled to nitrification and is controlled by the availability of organic
negative N2 fluxes when SOD was lowest, suggesting nitrogen fixation could occur despite
the increase in sediment oxygen penetration depth (Paerl and CARLTON 1988, Fulweiler
and Nixon 2011). Nitrogen fixation and denitrification have been found to co-occur in coastal
systems (Joye and Paerl 1994, Fulweiler et al. 2007), but process-based links between
oxygen demand and nitrogen cycling are still being developed (Burgin et al. 2010, Burgin
and Groffman 2012).
2.5.3 Potential DNRA
Previous studies that have examined DNRA in coastal ecosystems report that DNRA
can account for 0% to 75% of the nitrate flux (Tobias et al. 2001, An and Gardner 2002, Ma
and Aelion 2005, Gardner and McCarthy 2009). We expected that the high amount of
organic matter and anoxic and sulfidic sediments in a nitrate-limited environment would
create conditions favorable for DNRA over denitrification (Tiedje 1988, Kelso et al. 1997,
Silver et al. 2001, Tobias et al. 2001, Gardner et al. 2006, Burgin and Hamilton 2007,
Koop-Jakobsen and Giblin 2010). However, we found DNRA to be negligible during the winter
and to account for 0.7% to 11.2% of the added nitrate flux in subtidal flats and oyster reefs,
respectively, during the summer. This low percentage would leave a large portion of nitrate
available for other processes, including denitrification.
We found higher rates of potential DNRA in oyster reef sediment compared to the
other habitats. Oyster reef sediments had high SOD, indicating reduced conditions that may
favor DNRA over denitrification. In a marine aquaculture system with significant and
sustained organic matter production DNRA was also found to occur at relatively high rates
than denitrification (Christensen et al. 2000). Previous studies suggest that denitrification is
bivalve aquaculture (Carlsson et al. 2012). It is possible that a proportion of the ambient
ammonium flux from the oyster reef could result from DNRA associated with 14 NO3-, which
was unaccounted for in this study. However, the low nitrate in the overlying water (<
1µM, Table 2.1) suggests that this is minor. To our knowledge, ours is the first study to
measure potential DNRA in natural oyster reef sediments and more data are necessary to
fully assess the pathways of nitrate reduction in these systems.
These values may underestimate actual rates because our method did not measure
DNRA rates from 14 NO3- that occurs naturally and did not consider losses of 15NH4+ due to
cation exchange reactions in the sediments. It is possible that 15NH4+ produced through
DNRA was exchanged in the sediments with 14NH4+. This exchange would cause an increase
in 14NH4+ release and an underestimate of DNRA (Gardner et al. 1991, Seitzinger et al. 1991,
Gardner et al. 2006). Unfortunately, we have neither measurements of porewater ammonium
nor ammonium affinity from these sediments. However, we observed an increase in total
NH4+ release after the enrichment of 15NO3-, suggesting a greater potential for DNRA than
we detected (Gardner et al. 2006). Moreover, these data suggest that nitrogen retention
through DNRA could increase in response to anthropogenic nutrient loading.
2.5.5 Extrapolations
Spatial and temporal variability in denitrification make it difficult to extrapolate rates
to the landscape scale (Cornwell et al. 1999). In order for denitrification to be assessed at
such a level, measurements must be made over many seasons, across a range of habitats, and
account for tidal inundation (Seitzinger 2000). We used a model based on water level,
elevation and light to scale rates of N2 production. These rates represented a lower limit
The purpose of our extrapolation was to assess nitrogen removal on the ecosystem scale;
therefore, only positive fluxes were included.
Our results suggest that the amount of nitrogen removed by denitrification for an
estuary depends on the amount and type of habitats located within the estuary, as each habitat
has a unique effect on sediment nitrogen dynamics (Eyre and Maher 2010, Eyre et al. 2011b,
Piehler and Smyth 2011, Eyre et al. 2011a). We found that oyster reefs and SAV provided
disproportionately large amounts of nitrogen removal per unit area, while subtidal flats
removed the largest amount of nitrogen within the ecosystem due to the area of these habitats
within the estuary. Recent studies have examined how habitat area in tropical oligotrophic
ecosystems affects nitrogen budgets and found seagrass beds to have the highest rates of
nitrogen removal while flats served as important connectors (Eyre et al. 2011a). Results from
our study also show that intertidal and subtidal flat habitats help to maintain the balance and
function of estuarine ecosystems; however, these habitats do not provide the same quantity of
ecosystem services as oyster reefs, SAV or marsh habitats and are generally considered to be
of less value (Costanza et al. 1997, Barbier et al. 2011, Boström et al. 2011). Commonly,
restoration strategies convert intertidal and subtidal flats to habitats that provide a greater
number of services per area.
2.6 Conclusions
Given the current habitat distribution of Bogue Sound, an estimated total of 28.3 ±
4.8 x 10⁶ mols N are removed per year. Based on annual nitrogen load data from coastal
streams within this area (Schwartz 2010), impervious surface coverage and watershed area
(11.82%; USGS), we estimate the nitrogen load to Bogue Sound to be about 37.3 x 10⁶ mols
76% of the total estimated nitrogen load and does not account for other sources of
nitrogen (e.g. oceanic and non-point sources). This high nitrogen removal capacity of
Bogue Sound contributes to maintaining water quality within this system. Although
analyzing a complex system by adding rates from the individual compartments does not take
into account the interactions, it is the first step in assessing landscape scale nitrogen removal.
Rates of denitrification (N2 production only), which have been modified by the
assumptions of the extrapolation, were not different; however, the mean of the
measured net N2 fluxes, suggest that hourly areal fluxes are different by habitat type.
Annual areal denitrification in oyster reefs is less than SAV and comparable to
intertidal flats (Fig. 2.4); however oyster reefs have the highest areal denitrification in the summer (Fig. 2.2). Thus, restoration of habitats with positive mean net N2 fluxes and favorable inundation regimes have the potential to increase system-wide
denitrification. This information will help in our understanding of how changes in the
amount and types of habitats in the estuarine landscape impact ecosystem functions and
services. Such knowledge is essential for management strategies aimed at mitigating the
negative effects of increased nutrient inputs.
2.6 Acknowledgments
We thank the NOAA Ecological Effects of Sea Level Rise Program, North Carolina
Sea Grant, NSF EAR- 0815627 and NSF OCE-0961929 for funding that supported this work.
We thank Scott Chappell providing habitat coverage data, and Joey Crosswell for help with
GIS data. Many thanks go to Laura Stephenson, Scott Ensign, Rebecca Schwartz, and Dina
comments of 3 anonymous reviewers whose input significantly enhanced all aspects of this
Table 2.1 Physical and chemical properties of water at the sampling site for all nitrogen flux experiments (BD=Below Detection).
Season Month
Temp
(oC) Salinity
DO (mg/l)
NOx -(µM)
NH4+ (µM)
Winter Jan. 3.32 32.4 11.4 0.33 1.28
Spring March 19.0 31.6 8.84 0.49 0.91
Summer July 30.1 29.3 5.00 BD 3.56
29 Table 2.2 Mean rates of potential DNRA in two seasons and five habitats. Values are mean ± 1 SE. Significant differences are
indicated by *. There were no measures of ammonium and nitrate fluxes during the winter. Percent of nitrate flux was calculated as recovery of 15NH4+ assumingthat all of the NOx flux was from the added 15NO3-.
Season Habitat
DNRA
(µmol 15NH4+ m-2 hr-1) Ammonium Flux (µmol NH4+ m-2 hr-1) (µmol NOx mNitrate Flux -2 hr-1) % of Nitrate Flux that was
15NH4 Summer Subtidal Flat 4.5 ± 3.00 46.5 ± 5.5 -688 ± 61.3 0.70
2007 Intertidal Flat 12.6 ± 5.40 124 ± 37.5 -737 ± 105 1.62
SAV 26.3 ± 5.20 275 ± 87.7 -596 ± 81.2 4.54
Marsh 11.4 ± 7.00 199 ± 14.0 -560 ± 21.8 2.94
Oyster Reef 104* ± 34.3 443 ± 154 -1010 ± 281 11.2
Winter Subtidal Flat None Detected 2008 Intertidal Flat None Detected
SAV None Detected
Marsh 0.40 ± 0.30
Table 2.3 Hour inundation during the dark, based on seasonal differences in light and water level and total habitat area in the study system.
Habitat Average Hours Submerged per day in the Dark
Total Area (km2) in Bogue Sound
Subtidal Flat 12 ± 0.8 67.9
Intertidal Flat 8.2 ± 0.8 3.7
SAV 12 ± 0.8 21.1
Marsh 6.1 ± 0.8 8.2
Figure 2.4 Annual areal rates of denitrification based on hourly rates that were adjusted for light and inundation for each habitat and annual rate of removal based on the total amount of habitat area in Bogue Sound.
3. OYSTER MEDIATED BENTHIC-PELAGIC COUPLING MODIFIES NITROGEN POOLS AND PROCESSES2
3.1 Abstract
Anthropogenic nitrogen loading has led to eutrophication of many estuaries. Removal of nitrogen through enhanced denitrification has been identified as an ecosystem service provided by oysters. In this study, we assessed the effects of an individual oyster on nitrogen dynamics. Net fluxes of N2, O2, nitrate (NOx) and ammonium (NH4+) were measured in continuous-flow microcosms that contained a live oyster, sediment, or a live
oyster+sediment. Net N2 fluxes were indicative of nitrogen fixation in the sediment treatment and denitrification in the oyster and oyster+sediment treatments. This difference probably resulted from increased organic matter deposition and ammonium production associated with excretion and biodeposit production. Our results suggest that oyster-mediated denitrification may be most apparent in carbon-limited systems. Despite high rates of ammonium
production associated with the oysters, oyster-mediated denitrification accounted for 40% of the total inorganic nitrogen efflux in the oyster microcosms and 16% in the oyster+sediment microcosms. Despite high rates of ammonium production, the inclusion of the eastern oyster did not affect the pool of bioavailable nitrogen but shifted the microcosms from a nitrogen source to sink.
3.2 Introduction
Human activities have drastically altered the structure and function of estuarine ecosystems. Two of the most troubling changes have been nutrient enrichment (Nixon et al. 1995) and loss of bivalves (Frankenberg 1995, Jackson et al. 2001a). Estuarine ecosystems are typically nitrogen limited (Paerl 1997, Howarth and Marino 2006)and phytoplankton growth stimulated by increased inputs of reactive nitrogen have led to eutrophication (Vitousek et al. 1997b). Nitrogen loss in estuaries occurs primarily through denitrification, the microbial conversion of nitrate or nitrite to N2 or N2O (Seitzinger 1988, Nixon et al. 1995). However, development, deforestation and overharvesting have changed the estuarine landscape, reducing areas where conditions are favorable for denitrification (Lotze et al. 2006, Brush 2009). The loss of natural nitrogen sinks coupled with increased nitrogen inputs has exacerbated the imbalance in the estuarine nitrogen cycle further contributing to
eutrophication.
processes (Newell et al. 2002, Porter et al. 2004, Newell et al. 2005, Piehler and Smyth 2011, Smyth et al. 2013).
Oysters may enhance denitrification by modifying oxygen, carbon and/or nitrate availability. Oysters, like other bivalves, contribute to anoxic conditions favorable for denitrification through respiration and decomposition of organic material in biodeposits (Gelda et al. 2001, Bruesewitz et al. 2008). Biodeposition of carbon rich biodeposits could enhance denitrification, particularly in carbon-limited systems (Kimmel and Newell 2007, Higgins et al. 2013). When nitrate limits denitrification; increased ammonium associated with oyster excretion and remineralization of biodeposits may fuel nitrate production through nitrification (Dame et al. 1984, Lavrentyev et al. 2000, Newell et al. 2005). Additionally, bivales may stimulate nitrification by filtering out bactivorous protozoa that would otherwise consume nitrifying bacteria, leading to increased rates of nitrification because of decreased predation (Lavrentyev et al. 2000). However, ammonium produced in excess of nitrification probably returns to the water column, and is used to meet nitrogen demands for
phytoplankton growth (Dame et al. 1984, 1985, Kemp et al. 1990).
Previous studies designed to examine oyster effects on nitrogen transformations have focused on adjacent sediments (Piehler and Smyth 2011, Smyth et al. 2013) or mimicked oyster-mediated biodeposition (Newell et al. 2002). We conducted a microcosm experiment to examine the direct effects of an individual oyster on nitrogen dynamics. The inclusion of live oysters in continuous-flow microcosms allowed us to quantify the extent to which oyster-mediated benthic-pelagic coupling influences the availability and processing of
3.3 Methods
3.3.1 Sample Collection
The experiment was conducted in microcosms (polycarbonate 6.4 cm diameter X 30cm) that contained a live oyster, sediment, or a live oyster+sediment and incubated in a continuous-flow system. Intertidal oysters (Crassostrea virginica) were collected from Calico Creek, NC (34.728, -76.722), at low tide and stored in saltwater flow-through tanks for three days. Prior to the start of the incubation, the outside shell of each oyster was scrubbed with a brush to remove algae and biofilms and isolate the impacts of the oyster. Average oyster shell width in our experiment was 9.34 ± 0.45 cm and the average weight of oyster tissue was 1.0 ± 2.5 g.
Sediments samples (17 cm depth) were collected on 4 August 2009 during low tide from a homogenous intertidal flat in Bogue Sound, NC (a site suitable for oyster restoration) by pushing a microcosm chamber directly into the sediment. In addition, water (30l) was collected for use as reservoir water in the continuous-flow incubation. Surface water temperature, salinity and dissolved oxygen were measured prior to sample collection (YSI 600 Series Sonde and Model 650 data logger, Yellow Springs Instruments, Yellow Springs, OH).
3.3.2 Benthic Flux Incubations
Immediately after collection of sediment and water, all microcosm chambers were submerged in a water bath in an environmental chamber (Bally Inc.) set to in situ temperature (24.7°C). Microcosms were randomly assigned a treatment (oyster, sediment,
gas tight lid equipped with an inflow and outflow port and incubated in a continuous-flow system, where a peristaltic pump connected microcosms to the water reservoir. Aerated, unfiltered water was constantly passed through each microcosm at a flow rate of 2ml min-1 with a turnover time of approximately 3 hours. After an initial 20-hour acclimation period in the dark, microcosms were incubated over 24-hrs in a 10:14 hr, dark:light cycle. A light intensity of approximately 50 µ einsteins was maintained using dual spectrum compact florescent lights. Oxygen in the reservoir water was monitored throughout the incubation and remained about 6 mg/l. During the incubation, oysters were actively feeding as indicated by a gap between the valves of the oyster shells. All oysters were alive at the conclusion of the experiment.
3.3.3 Analytical Techniques
N2, O2 and Ar were measured using a Balzers Prisma QME 200 quadruple mass spectrometer (MIMS; Pfeiffer Vacuum, Nashua, NH, USA) and concentrations of N2 and O2 were determined using the ratio with Ar (Kana et al. 1994, Ensign et al. 2008). Samples for nutrient analysis were filtered through Whatman GF/F filters (25 mm diameter, 0.7 µm nominal pore size), and the filtrate was analyzed for nitrate (nitrate plus nitrite; NOx) and ammonium (NH4+) with a Lachat Quick-Chem 8000 (Lachat Instruments, Milwaukee, WI, USA) automated ion analyzer (detection limits: 0.04 µM NOx, 0.18 µM NH4+).
divided by the flow rate, and expressed relative to the area of the microcosm (Lavrentyev et al. 2000). A positive flux indicates production in excess of demand and a negative flux is a demand in excess of production within the microcosm. Fluxes from each microcosm were averaged for each treatment to calculate mean values and standard error (n=3). Daily fluxes were calculated as the sum of the light rate multiplied by 14 hours and the dark rate
multiplied by 10 hours. For consistency, daily fluxes were divided by 24 hours and expressed per hour. Net dissolved inorganic nitrogen fluxes (DIN) were calculated as the sum of
ammonium and nitrate fluxes plus nitrogen fixation minus denitrification. 3.3.4 Statistical Analysis
The effect of treatment and illumination (dark or light) on fluxes of N2, O2, NOx, NH4+ and net DIN was tested separately using a mixed effect analysis of variance (ANOVA). Treatment was a fixed factor and illumination was nested within microcosm. Within factor significance was tested using Tukey’s HSD. All analyses were considered significant at the p<0.05 level and were conducted using JMP 7.0.1 statistical software (SAS 2007).
3.4 Results
N2 fluxes were significantly different between each treatment (F2,2=40.88, p<0.0001; Fig 3.1) and ranged from 426 ± 55 µmol N-N2 m-2 hr-1 for the oyster treatment in the light to -294 ± 35 µmol N-N2 m-2 hr-1 for the sediment treatment in the light. The effect of light was not significant (F3,3=0.1093, p=0.8523). Daily N2 fluxes from the sediment treatment were negative, indicating net nitrogen fixation while fluxes from the oyster and oyster+sediment treatments were positive, indicating net denitrification.
NOx fluxes were highly variable and mostly negative (Fig 3.2). Fluxes ranged from -23 ± 5.2 µmol NOx m-2 hr-1 in the oyster treatment in the light to 2.3 ± 9.1 µmol NOx m-2 hr-1 in the oyster+sediment treatment in the light. NOx fluxes were not affected by oyster
presence (F2,2=2.191, p=0.154) or light (F3,3=0.3243, p=0.808).
The oyster and oyster+sediment treatments had positive fluxes of NH4+ while fluxes in the sediment treatment were negative (Figure 3.2). NH4+ fluxes ranged from -51 ± 57 µmol NH4+ m-2 hr-1 in the light for the sediment treatment to 588 ± 83 µmol NH4+ m-2 hr-1 in the light for the oyster treatment. Light did not affect NH4+ fluxes for either treatment
(F3,3=0.1840, p=0.9052). NH4+ fluxes were higher in the oyster and oyster+sediment treatments than the sediment treatment (F2,2=19.634, p=0.0002).
Oyster mediated denitrification accounted for an average of 18% of the total
dissolved inorganic nitrogen efflux, ranging from 16% from the oyster+sediment microcosm to 40% from the oyster only microcosm. Net DIN fluxes were not different between
treatments (F2,2=0.3272, p=0.7272, Figure 3.2) or illumination (F3,3=1.622, p=0.2362).
3.5 Discussion