A Study of Visual and Sensory Performance, Collision Anticipation, and Head Impact Biomechanics in College Football Players
Jacqueline A. Harpham
A thesis submitted to the faculty of the University of North Carolina at Chapel Hill in partial fulfillment of the requirements for the degree of Master of Arts in the Department of Exercise and Sport Science (Athletic Training) in the College of Arts & Sciences.
Chapel Hill 2013
Approved by:
Jason P. Mihalik, PhD, CAT(C), ATC Kevin M. Guskiewicz, PhD, ATC Ashley C. Littleton, MA, ATC
ii © 2013
iii ABSTRACT
JACQUELINE A. HARPHAM: A Study of Visual and Sensory Performance, Collision Anticipation, and Head Impact Biomechanics in College Football Players
(Under the direction of Jason P. Mihalik)
iv
ACKNOWLEDGEMENTS
v
TABLE OF CONTENTS
LIST OF TABLES ... VIII
CHAPTER I ... 1
RESEARCH QUESTIONS ... 4
RESEARCH HYPOTHESES ... 4
DEFINITION OF TERMS ... 4
OPERATIONAL DEFINITIONS ... 5
ASSUMPTIONS ... 6
LIMITATIONS ... 7
DELIMITATIONS ... 7
CLINICAL SIGNIFICANCE ... 7
CHAPTER II ... 8
DEFINITION ... 8
EPIDEMIOLOGY ... 8
PATHOPHYSIOLOGY ... 10
SPORT-RELATED CONCUSSION:BIOMECHANICS ... 11
PREVENTION ... 18
RATIONALE FOR STUDY ... 25
vi
PARTICIPANTS ... 28
INSTRUMENTATION ... 28
Head Impact Telemetry System ... 29
Visual and Sensory Performance Assessment ... 30
Reaction Time Assessments ... 30
Video Evaluation ... 32
PROCEDURES ... 32
DATA REDUCTION ... 34
DATA ANALYSES ... 36
CHAPTER IV ... 40
INTRODUCTION ... 40
METHODS ... 42
Participants ... 42
Instrumentation ... 43
Visual and Sensory Performance Assessment ... 44
Reaction Time Assessments ... 44
Video Evaluation ... 46
PROCEDURES ... 47
DATA REDUCTION ... 48
DATA ANALYSES ... 50
RESULTS ... 51
vii
Visual and Sensory Performance ... 51
Level of Collision Anticipation ... 53
DISCUSSION ... 53
Reaction Time ... 53
Visual and Sensory Performance ... 54
Visual and Sensory Performance Following Concussion ... 56
Anticipation ... 57
Conclusion ... 58
APPENDIX A ... 61
THE PLAYER-TO-PLAYER COLLISION TYPE EVALUATION FORM ... 61
viii
LIST OF TABLES
Table 2.1. Nike SPARQ Sensory Station Evaluation... 27 Table 3.1. Data analysis plan ... 38 Table 3.2. Stroop Test ... 39 Table 4.1. Frequency (percentage) of recorded impacts sustained by high
and low performers of visual and sensory assessments by an ordinal level of head impact severity based on linear and rotational
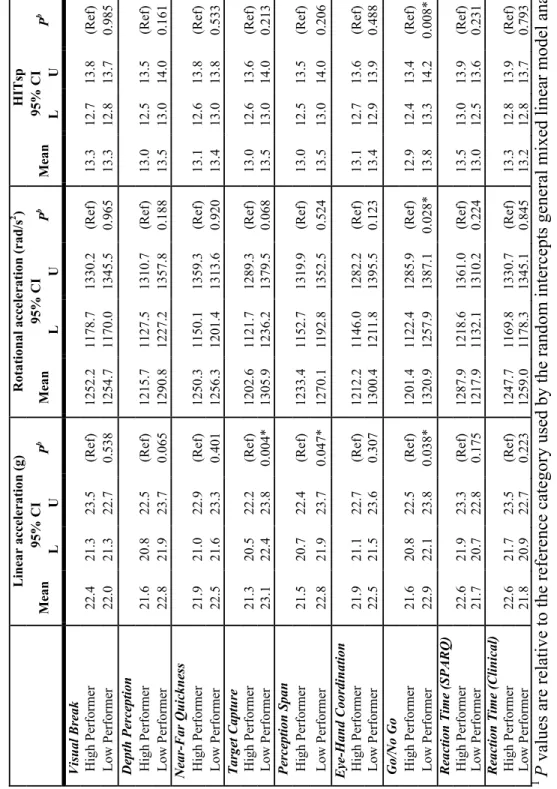
accelerations ... 59 Table 4.2. Mean resultant linear acceleration, rotational acceleration, and HITsp
of head impacts sustained by high and low performers of visual and
sensory performance assessments. ... 60
CHAPTER I INTRODUCTION
Concussion has been defined as a complex pathophysiologic process affecting the brain, induced by traumatic biomechanical forces that typically result in an impairment of
neurologic function and clinical symptoms such as disturbances of vision and equilibrium
(McCrory, Meeuwisse et al. 2009). Sport-related concussions have become a major
public health concern, with approximately 3.8 million sports-related traumatic brain injuries occurring in the United States each year (Langlois, Rutland-Brown et al. 2006). Concussions can occur in any sport, but it is widely accepted that the majority of sport-related concussions occur in contact or collision sports, such as football. Football is one of the most popular sports among high school and collegiate males, with approximately 1.1 million high school participants and 60,000 collegiate male participants in programs nationwide (Bracken 2007; 2011). Concussions account for a high percentage of overall injuries at both the collegiate and high school level of football. In collegiate athletes, concussions accounted for 6.8% of injuries sustained during fall games, second only to knee internal derangements (Dick, Ferrara et al. 2007). A similar trend is seen at the high school level, with concussions accounting for 8.9% of all total injuries (Gessel, Fields et al. 2007)
2
coming into contact with it (Guskiewicz and Mihalik 2011). Direct and indirect impacts are caused by a combination of two types of forces: linear and rotational (Bailes and Cantu 2001). As with other injuries, it is believed that the severity of a concussion is related the magnitude, direction, and distribution of the forces applied to the brain (Guskiewicz and Mihalik 2011). Although the exact role of linear and angular
accelerations on head impact severity is not entirely clear, it is thought that the ability to dissipate these forces associated with high magnitude impacts would decrease a person’s risk of sustaining a concussion.
3
transferable to the performance of athletes (Stine, Arterburn et al. 1982). In addition to the athlete’s performance on the field, it is plausible that an athlete’s visual and sensory performance is also related to their ability to anticipate and react to impending head impacts on the field; thus, addressing a new area of research with the goal of preventing injury while concurrently improving athlete performance.
Evaluating visual and sensory performance may be used to identify at-risk athletes, and lead to prospective interventions designed to reduce injury and decrease an athlete’s overall risk of sustaining injurious head impacts. Along this same underlying tenet, an evaluation of visual and sensory performance includes an assessment of an athlete’s functional reaction time. It is believed that the functional impairments associated with prolonged reaction time could put an athlete at increased risk for an injurious head impact (Eckner, Lipps et al. 2011). Traditionally, we have recorded
reaction time using computerized neurocognitive testing using tasks that are far dissimilar to those that are ultimately experienced by athletes in their sports. Identifying
relationships between traditional measures of reaction time and visual sensory reaction time as measured by the Nike SPARQ Sensory Station, we will be better positioned to develop more appropriate testing batteries to evaluate an athlete’s level of visual and sensory performance to be used for injury prevention interventions. Therefore, the
4 Research Questions
Research Question 1 (Prospective): Is there a significant correlation between reaction
time scores on traditional reaction time measures (CNS Vital Signs, ANAM, Clinical Reaction Time Apparatus), and reaction time as measured by the Nike SPARQ Sensory Station?
Research Question 2 (Prospective): Is there a significant association between level of
visual and sensory performance (high vs. low) and head impact severity (mild, moderate, or severe) in college football players?
Research Question 3 (Retrospective): Is there a significant association between collision
anticipation (anticipated vs. unanticipated) and head impact severity (mild, moderate, or severe) in college football players?
Research Hypotheses
1) There will be a significant correlation between scores on traditional measures of reaction time and reaction time as measured by the Nike SPARQ Sensory Station. 2) A high level of visual and sensory performance will be associated with less severe
head impacts compared to a low level of visual and sensory performance.
3) Unanticipated collisions sustained during a college football game will be associated with more severe head impacts compared to anticipated collisions.
Definition of Terms
5
2) Rotational Acceleration: the rate of change of the angular velocity of an object over time, which is reported in radians/seconds2.
3) Head Impact Technology Severity Profile (HITsp): a weighted composite score encompassing linear and rotational accelerations, Gadd Severity Index, Head Injury Criterion, and impact location.
4) Anticipated collision: the athlete was looking in the direction of the collision at the time of impact and was in a position of athletic readiness.
5) Unanticipated collision: the athlete was not looking in the direction of the collision at the time of impact and was not in a position of athletic readiness.
6) High Level Visual and Sensory Performer: individuals scoring in or above the 51st percentile within our sample of subjects on the Nike SPARQ Sensory Station evaluation of visual and sensory performance
7) Low Level Visual and Sensory Performer: individuals scoring in or below the 49th percentile within our sample of subjects on the Nike SPARQ Sensory Station evaluation of visual and sensory performance
Operational Definitions
Head impact: A head impact will be defined as those head impacts measuring greater
than or equal to 10g (Guskiewicz, Mihalik, et al., 2007; McCaffrey, et al., 2007; Mihalik, et al., 2007; Schnebel, et al., 2007).
Severe linear acceleration head impact: A severe head impact will be defined as those
6
Moderate linear acceleration head impact: A moderate head impact will be defined as
those head impacts measuring greater than 66 g and less than 106 g in linear acceleration (Zhang, et al., 2004).
Mild linear acceleration head impact: A mild head impact will be defined as those head
impacts measuring less than or equal to 66 g in linear acceleration (Zhang, et al., 2004). Severe rotational acceleration head impact: A severe rotational head impact will be
defined as those head impacts measuring greater than or equal to 7900 rad/s2 in rotational acceleration (Zhang, et al., 2004).
Moderate rotational acceleration head impact: A moderate head impact will be defined
as those head impacts measuring greater than 4600 rad/s2 and less than 7900 rad/s2 in rotational acceleration (Zhang, et al., 2004).
Mild rotational acceleration head impact: A mild head impact will be defined as those
head impacts measuring less than or equal to 4600 rad/s2 in rotational acceleration (Zhang, et al., 2004).
Assumptions
1) The helmets were fitted properly at the beginning of the season and remained properly fitted throughout the season.
2) All athletes put forth maximal effort during the initial testing of visual and sensory performance and reaction time.
7
4) The Head Impact Telemetry System is a reliable measure of head impact biomechanics.
Limitations
1) This single football team represents a small sample size that may not represent a larger population of athletes.
Delimitations
1) The length of data collection was limited to one football season.
2) Only athletes from the University of North Carolina football team were used in this study.
3) The Nike SPARQ Sensory Station was the only test of visual and sensory performance used.
Clinical Significance
If there is a relationship between level of visual and sensory performance, collision anticipation, and head impact biomechanics, then visual and sensory
CHAPTER II
REVIEW OF THE LITERATURE
Definition
Concussion has been defined as a complex pathophysiologic process affecting the brain, induced by traumatic biomechanical forces that typically result in an impairment of
neurologic function and clinical symptoms such as disturbances of vision and equilibrium
(McCrory, Meeuwisse et al. 2009)
Epidemiology
9
(18.3%), men’s ice hockey (7.9%), women’s lacrosse (6.3%), men’s football fall season (6.0%), and men’s football spring season (5.6%) (Hootman, Dick et al. 2007).
Concussions account for a high percentage of overall injuries at both the
collegiate and high school levels of football. At the collegiate level, concussions account for 6.8% of injuries in fall games, 5.5% of injuries in fall practices, and 5.6 % of injuries in spring practices(Dick, Ferrara et al. 2007). At the high school level, concussions account for 5.6-8.9% of injuries (Guskiewicz, Weaver et al. 2000; Gessel, Fields et al. 2007). Guskiewicz et al. found differences in concussion incidence among Division I, II, and III collegiate football programs with the highest incidence rate found in Division III programs (5.5%), followed by Division II (4.5%) and Division I (4.4%) (Guskiewicz, Weaver et al. 2000).The literature supports differences in concussion rates among the different player positions and play types, although there is inconsistency in which
positions are at the greatest risk. In one study involving high school athletes, linebackers and running backs accounted for 40.9% and 29.4% of the concussions sustained by defensive and offensive players, respectively. Most concussive injuries occurred during running plays, specifically tackling or being tackled accounted for 67.6% of concussions (Gessel, Fields et al. 2007).
10
2007; 2011). The increasing injury rates for concussion at the collegiate and high school level make it clear that developing prevention strategies is of the upmost importance.
Pathophysiology
The pathophysiology of brain injury has been divided into two types of trauma: focal and diffuse. Focal trauma is the result of a direct blow, resulting in penetrating or tearing of the cerebral tissue and associated bleeding. These injuries include cortical or subcortical brain contusions, and subdural and epidural hematomas. Concussions are characterized as a diffuse axonal injury, which involves shearing of the white matter fiber tracks throughout the cerebral tissue. Cognitive, memory, and motor deficits
post-concussion are associated with the degree of disruption at the axonal level in particular areas of the brain (Bailes and Cantu 2001).
Following biomechanical injury to the brain, a series of neurometabolic events occur that together account for the pathophysiology of concussion. First, there is an abrupt release of neurotransmitters followed by a period of unchecked ionic influx. Binding of excitatory neurotransmitters results in continued neuronal depolarization and a consequential efflux of potassium and influx of calcium. This results in an ionic shift at the cellular level leading to acute and subacute changes in cellular physiology(Giza and Hovda 2001).
11
decreased cerebral blood flow following injury. This imbalance leads to an energy crisis due to the inability to supply the glucose needed to maintain membrane potential. It is thought that this could be the cause of the brain’s increased vulnerability; the brain is unable to respond to a second injurious mechanism and as a result faces longer lasting deficits (Giza and Hovda 2001). Following the initial jump in glucose metabolism comes a period of depressed glucose utilization. Calcium begins to accumulate and results in impaired mitochondrial oxidative metabolism and neural connectivity due to
neurofilament and microtubule disruption. Calcium also activates cellular pathways that eventually lead to cell death (Giza and Hovda 2001).
Sport-Related Concussion: Biomechanics
Just like with all injuries, a sound understanding of the biomechanics of
12
moving object. Rotational forces affect the brain because of the brain’s attachment at the foramen magnum and spinal cord. Both linear and rotational forces can be present during an injurious mechanism to the brain, however it is believed that usually one force is the main cause (Bailes and Cantu 2001).
Researchers have attempted to develop a more sophisticated understanding of the causes and factors that are related to concussion through empirical and analytical
methods of biomechanical analysis. Accelerometers can be inserted into helmets to collect data on head impact acceleration, magnitude, frequency, and location. Empirical methods usually involve linear and angular accelerometry along with video footage collected during sporting events, while analytical methods involve laboratory replication of observed impacts to predict the body’s biomechanical response (Guskiewicz and Mihalik 2011).
13
direction, and velocity. Further, the crash test dummies use a head-neck-torso model that is less than the size of an average NFL player. While the error levels for calculating angular accelerations fell within the expected boundaries of a reliable study, a more sound method is needed to fully expand our knowledge of head impact biomechanics if we want to be able to develop appropriate prevention methods (Newman, Beusenberg et al. 2005).
The second method used to study head impact biomechanics is empirical. Many researchers have begun using a combination of video footage and linear/angular
accelerometry to measure head impacts in vivo. This provides a way to capture head impact biomechanical data in real time. Researchers have tried various methods to capture this data, including mounting accelerometers in mouthguards or more commonly into the helmets of collision sport athletes.
14
with mouthguard accelerometry before it can be accepted as an appropriate way to measure head impact biomechanics.
A much more common empirical method uses in-helmet accelerometry with the use of the Head Impact Telemetry System (HIT System). Researchers can use a
combination of video footage and linear/angular accelerometry to measure head impacts in vivo. This provides a way to capture head impact biomechanical data in real time. There are a series of head impact biomechanical measures that have been studied including linear acceleration, rotational acceleration, Head Impact Technology Severity Profiles (HITsp), frequency of head impact, and location of head impact. Researchers have implemented the HIT system to broaden their knowledge of head impact
biomechanics and how it relates to various aspects of concussions.
15
reconstruction analytical methods. (Duma, Manoogian et al. 2005; Brolinson, Manoogian et al. 2006)
The HIT System has been used with aims of identifying differences in head impact biomechanics between different positions and event types in football. Player position and event type differences have been found in frequency and location of the impact (Broglio, Sosnoff et al. 2009; Crisco, Fiore et al. 2010), head linear accelerations (Mihalik, Bell et al. 2007), and head rotational accelerations (Broglio, Sosnoff et al. 2009) of head impacts sustained by football players. While several studies have found that a greater number of head impacts are sustained during games than practices (Crisco, Chu et al. 2004; Broglio, Sosnoff et al. 2009), there are conflicting results on whether higher linear and rotational accelerations occur during impacts sustained practices or games (Mihalik, Bell et al. 2007; Broglio, Sosnoff et al. 2009; Crisco, Fiore et al. 2010). These previous studies have shown that there is likely a relationship between head impact frequency, magnitude, and event type, however more research is needed to determine the exact relationship that exists.
16
defensive backs and offensive backs and linebackers sustain higher acceleration impacts than defensive linemen and defensive backs. There was a strong association between position and high-magnitude impacts, with offensive backs being more likely to sustain an impact of greater than 80g than defensive linemen, defensive backs, offensive linemen, linebackers, and wide receivers (Mihalik, Bell et al. 2007).
There are also differences in location of impact between position types in football. Most impacts occur to the front of the helmet (Broglio, Sosnoff et al. 2009), followed by the back of the helmet (Crisco et al., 2010)(Mihalik, Bell et al. 2007). Defensive backs, defensive linemen, linebackers, and offensive linemen had more impacts to the front of the helmet than the back; with offensive linemen sustaining the most impacts to the front compared to other positions. Quarterbacks had more impacts to the back of the helmet than to the front (Crisco et al., 2010). Head impacts to the top of the helmet have high accelerations than impacts to other locations on the helmet (Mihalik, Bell et al. 2007; Broglio, Sosnoff et al. 2009). There is a strong association between high-magnitude impact and location of impact, with athletes more likely to suatin an impact of greater than 80g to the top of the helmet (Mihalik, Bell et al. 2007).
17
Another area of interest is the relationship between head impact biomechanics and clinical outcome after subconcussive head impacts. College football players sustain approximately 1000 subconcussive hits throughout a single season, however there is little to no impact on clinical measures in concussion tests (Gysland, Mihalik et al. 2011), postural stability, or cognitive scores (McCaffrey, Mihalik et al. 2007) following these subconcussive head impacts. However, a slight increase in symptoms has been
associated following high-magnitude impacts sustained by college football players (McCaffrey, Mihalik et al. 2007).
The HIT System has been implemented to relate head impact biomechanics to clinical measures of concussion. This has been studied at both the collegiate
(Guskiewicz, Mihalik et al. 2007) and high school (Broglio, Eckner et al. 2011) levels. No relationship was found between head impact biomechanics and injury severity. Additionally, no relationship was found between head impact biomechanics and symptom scores, cognitive function, and postural stability. This particular area of research is difficult and lacks statistical support because of small number of concussions sustained throughout a testing period (Guskiewicz, Mihalik et al. 2007; Broglio, Eckner et al. 2011).
18
principal component score (similar to the HIT severity profile: HITsp) (Greenwald, Gwin et al. 2008). There appears to be no cumulative effect of prior non-concussive impacts on the injury threshold (Eckner, Sabin et al. 2011). There has been no identified concussive injury threshold, with the main limitation being the small number of concussions that occur over the course of a data collection period that does not allow for sufficient statistical evidence.
Prevention
Although the direct role of linear and angular accelerations on head impact severity is not entirely clear, it is thought that the ability to dissipate these forces would decrease an athlete’s risk of sustaining a concussion. It is believed that addressing factors related to an athlete’s ability to dissipate force could be used as a means of prevention. It appears there are many factors that may affect the body’s ability to withstand head impact forces, including appropriate protective equipment, muscular strength, and anticipation (Guskiewicz and Mihalik 2011).
19
that there is a possibility for anticipation to be addressed as a means of prevention, and more research is needed to be able to apply this concept to other sports.
In order to use anticipation as a means of prevention, we need to determine which aspects of anticipation in sport can be best observed, measured, and thus modified. Cervical muscle strength is one aspect of anticipation that researchers have begun to investigate. Cervical muscle strengthening could decrease the risk of concussion based on the principal that tensing the cervical musculature increases the effective movable mass of the head, neck, and torso, thus increasing the ability to overcome the force of a possibly injurious head impact (Mihalik, Guskiewicz et al. 2011). While it is commonly mentioned during the discussion of anticipation in athletics, there is little research on the ability to quantify cervical muscle strength in dynamic on-field situations. One study investigated the relationship between cervical muscle strength and head impact biomechanics in youth ice hockey players and found no significant relationships (Mihalik, Guskiewicz et al. 2011). The current standard for measuring cervical muscle strength is a laboratory “break test” using a handheld dynamometer. The ability to transfer these measurements to make connections to on-field dynamic cervical muscle strength is not yet known. Until we can develop a more sport-appropriate way to
measure cervical muscle strength in athletes, we must continue to look at other factors of anticipation that perhaps we can more accurately measure.
20
Individuals with higher levels of visual and sensory performance, including the characteristics of visual acuity and contrast sensitivity, are able to respond to their environment in a more efficient and appropriate way (Zimmerman, Lust et al. 2011). Much of the previous research on visual and sensory performance in athletics has focused on identifying differences between experts and novices or athletes and non-athletes. Some aspects that have been addressed by researchers include visual search behavior and fixation patterns. Experts tend to have more pertinent search strategies and more frequent fixations of shorter duration early on in the task (Williams, Davids et al. 1994; Martell and Vickers 2004), giving themselves just enough time to extract the appropriate
information (Savelsbergh, Van der Kamp et al. 2005). A fixation of longer duration on a particular target may limit an athlete’s ability to anticipate and prepare for an impending impact (Van der Kamp 2011).
Early research of visual and sensory performance used closed skills such as computerized or pen and paper laboratory tests. Researchers are realizing the importance of using more open skills in order to make their results more transferable to athletics. Studies involving soccer (Williams, Davids et al. 1994) and ice hockey (Martell and Vickers 2004) athletes have started incorporating open skill assessments. The Nike SPARQ Sensory Station is an evaluation and training tool of visual and sensory
performance for athletes that could easily be used in a clinical setting. This program uses sport-relevant assessment tools that have the potential to be more applicable to athletics than small-screen computerized or pen and paper tests. It comprises tests to evaluate the following ten components of visual and sensory performance. See Table 2.1 for
21
If an athlete is found to have deficits on certain components of the test, then the Nike SPARQ Sensory Station can be used as a training tool to improve identified deficits. It is quite possible that the level of visual and sensory performance identified by the Nike SPARQ Sensory Station is not only related to the athletic performance, but is also related to anticipation and level of awareness on the field.
Anticipation is a commonly discussed factor throughout the current research in visual and sensory performance. However, despite the identified relationship between collision anticipation and head impact severity in youth ice hockey players (Mihalik, Blackburn et al. 2010), there has been little research on the interaction between visual and sensory performance and head impact biomechanics in athletes. Visual training in the following areas: extent of visual fields, fields of recognition, accuracy of depth
perception, and dynamic visual acuity, has been found to be transferable to the
performance of athletes (Stine, Arterburn et al. 1982). This suggests that there may be a way to use visual and sensory performance training as a means of injury prevention, if we can identify a relationship between visual and sensory performance and head impact biomechanics and can find an appropriate way to identify at-risk athletes with low levels of visual and sensory performance.
22
impact (Eckner, Lipps et al. 2011). As an adjunct to the Nike SPARQ Sensory Station, these tests could provide a more sensitive way to identify athletes with low levels of visual and sensory performance who could be more at risk to sustain injurious head impacts.
Reaction time is defined as the elapsed time between the presentation of a sensory stimulus and the associated motor or behavioral response (Vickers 2007). There are two types of reaction time: simple and choice. Simple reaction time involves a situation where there is only one response option. Choice reaction time involves a situation where there is more than one response option. Reaction time has been found to be trainable in a group of experiments that showed there was a practice effect and a carryover of that practice effect after a three week period (Ando, Kida et al. 2001; Ando, Kida et al. 2002; Ando, Kida et al. 2004). These results show the potential of using tests of reaction time to identify individuals with deficits who could benefit from training.
Traditional measures of reaction time include computerized tests and the Clinical Reaction Time Apparatus. The Nike SPARQ Sensory Station can also be used to
evaluate reaction time. There is little research on the relationship between the various measures of reaction time. If we can determine the relationship between these different measures we can develop the best way to evaluate reaction time to be able to better identify athletes with deficits in this aspect of visual and sensory performance.
23
domains: neurocognitive index (NCI), verbal memory standard score, visual memory standard score, processing speed standard score, executive function standard score, psychomotor speed standard score, reaction time standard score, complex attention standard score, and cognitive flexibility standard score (Gualtieri and Johnson 2006). Our study will only use the Stroop Test, as it is the only test required to calculate the clinical domain of reaction time.
Automated Neuropsychological Assessment Metrics (ANAM) is a computerized neurocognitive assessment tool that was developed by the United States Military’s Office of Military Performance Assessment Technology (Kabat, Kane et al. 2001). Our study will only use the simple reaction time and procedural reaction time tests.
The Clinical Reaction Time Apparatus was developed to give clinicians a simple and inexpensive measure of reaction time that could be used on the sideline or in an athletic training room. This device is a thing, rigid cylinder with a weighted disk attached to the bottom. The examiner holds and releases the apparatus while the
24
there was a correlation between the two performance measures (Eckner, Lipps et al. 2011).
The Nike SPARQ Sensory Station tests reaction time as one of the ten components addressed in the evaluation. The large touch screen creates a test that measures reaction time in a more functional and athlete-friendly way. This system could easily be used in a clinical setting, and also be used as part of a training program if an athlete is found to have a deficit in their skill level of reaction time.
There are identified advantages to traditional measures of reaction time. Computerized tests have a few advantages over functional measures of reaction time. The software allows for consistency in the administrating and scoring of tests, the ability to generate multiple forms of tests, the ability to track components of responses,
efficiency in testing a large number of subjects, and the ability to contribute to large databases for normative data (Gualtieri and Johnson 2006). The Clinical Reaction Time Apparatus provides a simple and inexpensive and could be an appropriate option for a clinician with a limited budget (Eckner, Lipps et al. 2011).
The Nike SPARQ Sensory Station may have an advantage of being a more functional test of reaction time. It is designed to include sport-relevant and athlete friendly assessments. These tests are often believed to be more intrinsically motivating than computerized neuropsychological tests (Eckner, Kutcher et al. 2010). It may be that these functional tests more closely relate to the type of situations these athletes will see on the field and for that reason they have the potential to be more accurate
25
reaction time and visual sensory reaction time as measured by the Nike SPARQ Sensory Station, we will be better positioned to develop more appropriate testing batteries to evaluate an athlete’s level of visual and sensory performance to be used for injury prevention interventions.
Rationale for Study
Developing strategies to prevent concussions is critical yet difficult due to the lack of knowledge of the exact mechanism of concussion. The role of anticipation in head impacts has been studied in other populations, but has not been extensively studied in collegiate football players. It is quite possible that the level of visual and sensory performance is not only related to the athlete’s performance on the field, but is also related to anticipation and level of awareness of impending head impacts during athletic competition.
If there is a relationship between level of visual and sensory performance, collision anticipation, and head impact biomechanics, then visual and sensory function evaluation and training devices could be used to identify at-risk athletes and create interventions to hopefully decrease their overall risk of injurious head impacts. Further, if we can determine the relationship between traditional measures of reaction time and reaction time as measured by the Nike SPARQ Sensory Station we can develop the most appropriate testing battery to assess an athlete’s level of visual and sensory performance that could be used to create a more effective preventative measure.
26
27 Tab le 2.1 . N ike S P A RQ S ens ory S ta ti on E va lua ti on Te st De sc ri p ti on Pa rt ic ipa nt Se t-Up Pr oc edur es Vi su al B re ak A te st o f vi su al en du ran ce. Ex am in er h ol ds a 2 4-cm ru le r up wi th th e ba se in b et we en th e su bj ect ’s ey es. T he ru ler h as a sl id in g co m po nen t w it h a si ng le bl ack li ne in th e s ub je ct’ s f ie ld o f v is io n. Pr io r to b eg in ni ng th e N ik e SPA R Q Se ns or y St at io n Ev al ua ti on , t he s ub je ct wi ll c omp le te th e v is ua l b re ak te st. T he s lid in g p ie ce is s ta rte d a t th e m ax im al d is ta nc e f or m th e s ub je ct’ s ey es, an d sl ow ly m ov ed cl oser . T he su bj ect in in st ru ct ed to f ocu s on th e li ne fo r as lo ng as pos si bl e, unt il it be gi ns to bl ur or s pl it to tw o bl ack li nes. Vi su al C la ri ty Ho w cl ea rl y at hl et es s ee di st ant de ta il s. Pa rt ic ip an t s ta nd s 16 f t fr om a 22 -in di spl ay hol di ng iP od T ouc h Bl ac k L an do lt r in gs ( C -sh ap ed r in g) w it h gap s at th e to p, b ot to m , l eft , an d ri gh t w il l ap pear in r an do m o rd er o n a w hi te back gr ou nd . P ar ti ci pan ts ar e in st ru ct ed to sw ip e th e iP od to uc h s cr ee n in th e d ir ec tio n o f th e g ap o f th e L an do lt r in
g. T
he r in gs a re p re se t a t va ryi ng ac ui ty de m ands . T he pr oc edur es inc lude bi noc ul ar a nd m onoc ul ar a ss es sm ent s. Th e ex am in er w il l i sol at e ea ch eye w it h a vi si on oc cl ude r. Co n tr as t Se ns it iv it y Ab il it y to p in po in t s ub tl e di ff er enc es in cont ra st . Pa rt ic ip an t s ta nd s 16 f t f ro m a 22 -in di spl ay hol di ng iP od T ouc h Fo ur b la ck c ir cl es a re p re se nt ed o n a li gh t b ac kg ro un d. A t r an do m , o ne o f th e ci rcl es w il l co nt ai n a pat ter n of r in gs. P ar ti ci pan ts w er e in st ru ct ed to sw ip e th e iP od to uch scr een in th e d ir ec tio n o f th e c ir cle w ith th e r in g p atte rn . De p th Pe rc ept io n Sp ee d an d ac cu ra cy in ju dg in g 2-ey ed d ep th in fo rm atio n th ro ug h m ultip le ga ze po si ti on s. Pa rt ic ip an t s ta nd s 16 f t f ro m a 22 -in di spl ay hol di ng iP od T ouc h w ea ri ng liq uid c ry sta l g og gle s ( N V ID IA 3 D Vi si on , S an ta C la ra , CA ) Th e go gg le s cr ea te a s im ul at ed d ep th in o ne o f th e fo ur r in gs th at w il l a pp ea r on th e scr een . T he par ti ci pan t i s ins tr uc te d to sw ipe the iP od touc h sc re en in the di re ct ion of the ri ng th at a pp ea rs c lo se r. Ne ar -Fa r Qu ic k n es s Qu ic kl y & ac cu ra te ly ch an ge vi sua l a tt ent ion be tw ee n ne ar an d far d ist an ces. Pa rt ic ip an t s ta nd s 16 f t f ro m a 22 -in di spl ay hol di ng the iP od touc h’s to p ed ge wi th th e fa r di sp la y’ s bot tom . A bl ac k L an do lt r in g wi ll b e pr es en te d al te rn at in g be twe en th e iP od to uc h sc re en a nd th e scr een o n N ik e S P A R Q S en so ry S tat io n di sp lay . T he par ti ci pan t i s in st ru ct ed to sw ip e th e iP od to uc h s cr ee n in th e d ir ec tio n of the ga p of the L andol t r ing. Ta rg et Ca p tu re Ab il it y fo r ra pi d vi su al sh ift in g an d reco gn it io n of pe ri phe ra l t ar ge ts . Pa rt ic ip an t s ta nd s 16 f ee t a w ay f ro m 42 -in ch d is pla y h old in g iP od T ou ch Th e pa rt ic ip an t w il l f oc us o n a ce nt ra l w hi te d ot u nt il a La ndol t r ing appe ar s br ie fl y in one of the c or ne rs on the N ike S P A R Q S ens or y S ta ti on di spl ay. T he pa rt ic ipa nt is ins tr uc te d to s w ip e in th e di rect io n of th e gap o f th e L an do lt r in g. Pe rc ept io n Spa n Vi su al q ui ck ne ss in acq ui ri ng cr it ical in fo rm atio n. Pa rt ic ipa nt s ta nds w it hi n ar m ’s le ng th o f 4 2-in ch d is pla y w ith c en te r of s cr ee n adj us te d to the ir he ight . Th e pa rt ic ip an t w il l f oc us o n a do t i n th e ce nt er o f a gr id p at te rn c om po se d of u p to 3 0 ci rcl es. A p at ter n of d ot s w il l f lash w it hi n th e gr id . T he par ti ci pa nt w il l us e the touc h scr een to r ecr eat e th e pat ter n of do ts. Ey e-Ha n d Co or d in at io n Ab il it y to ma ke q ui ck a nd accu rat e vi su al ly -gui de d ha nd re spons es to ra pi dl y ch an gi ng tar get s. Pa rt ic ip an t h ol ds a rm s pa ra ll el to gr ound at s houl de r he ight w it hi n ar m ’s le ng th o f 4 2-in ch d is pla y th at is a dj us te d to th eir h eig ht. A gr id wi ll b e pr es en te d wi th e ig ht c ol umn s an d si x ro ws o f eq ua ll y si ze d an d sp ac ed ci rcl es. A d ot w il l ap pear w it hi n on e ci rcl e of th e gr id . P ar ti ci pan t w il l b e in st ru ct ed to to uc h th e d ot a s qui ckl y as pos si bl e w it h ei the r ha nd. A s soon as the y touc h the dot , an ot her d ot w il l b e pr esen ted . 96 d ot s w il l ap pear in a pseu do ran do m ized seq uen ce. De ci si on Ma k in g (G o/ N o-Go ) Qu ic k & ac cu ra te de ci si on re sp on se s to r ap id ly ch an gi ng tar get s. Pa rt ic ip ant hol ds a rm s pa ra ll el to gr ound at s houl de r he ight w it hi n ar m ’s len gt h of 4 2-in d is pla y. An id en ti ca l g ri d as E ye -Ha nd C oo rd in at io n te st a pp ea rs . A gr ee n or r ed dot wi ll ap pear . If th e do t i s gre en , t he p art ic ip an t i s in st ru ct ed to to uc h it . I f th e do t i s red , t he par ti ci pan t i s in str uc te d n ot to to uc
h it. 9
6 d ots w ill a pp ea r in a p se ud or an do m iz ed s eq ue nc e. Re ac ti on T im e Sp ee d an d qu ic kn es s of a n at hl et e’ s han d react io n in re sp on se to a v is ua l s ti m ul us . Pa rt ic ip an t s ta nd s w it hi n ar m ’s le ng th o f 4 2-in ch d is pla y w ith c en te r of s cr ee n adj us te d to the ir he ight . Tw o an nu la r pa tt er ns a pp ea r on th e sc re en . P ar ti ci pan t p lace s dom ina nt ha nd fi ng er ti ps on in ne r c ir cle o f p atte rn . T his c ha ng es ci rcl e to g reen . P ar ti ci pan t f ocu ses on the c ent er of the an nu lar p at ter n in f ro nt o f th em
. A
CHAPTER III
METHODOLOGY Participants
We recruited 38 Division I college football players from the University of North
Carolina at Chapel Hill Fall 2012 football team (age = 20.4±1.4 years; height = 190.2±6.7
cm; mass = 109.3±17.8 kg). Participants were selected based on input from the coaching
and sports medicine staff to include a variety of player positions including 2
quarterbacks, 3 wide receivers, 3 offensive backs, 12 offensive linemen (including tight
ends), 12 defensive backs (including linebackers), and 6 defensive linemen. All
participants signed an informed consent approved by the University of North Carolina’s
Institutional Review Board prior to participation in study. Inclusion criteria required that
participants must be a University of North Carolina at Chapel Hill Division I collegiate
football player during the Fall 2012 season, who wore a helmet equipped with the Head
Impact Telemetry System, and consented to the study. Exclusion criteria included anyone
who has a history of permanent vision loss or is currently symptomatic from a head,
neck, or eye injury that would negatively affect scores on visual and sensory performance
29 Instrumentation
Head Impact Telemetry System
The Head Impact Telemetry System (Simbex, Lebanon, NH) was used to collect
data on linear acceleration, rotational acceleration, and Head Impact Technology severity
profile (HITsp). The HIT System is comprised of six spring-loaded single-axis
accelerometers inserted into Riddell VSR4 (sizes: L or XL), Revolution (sizes: M, L, or
XL), or Revolution Speed (sizes: M, L, or XL) football helmets (Riddell Corporation)
and the Sideline Response System. The in-helmet accelerometers are strategically placed
to allow for measurement of linear and rotational acceleration and impact location. Up to
100 separate head impacts can be stored in the memory built into the accelerometer. The
accelerometers collect data at 1 kHz for a period of forty milliseconds; eight milliseconds
are recorded before the data collection trigger and thirty-two milliseconds of data are
collected after the trigger. The HIT System can collect data from up to 64 players over a
distance greater than the length of a football field.
The Sideline Response System was located on the sideline during games and
practices. This unit receives time-stamped, encoded data from the in-helmet
accelerometers through a radiofrequency telemetry link. The data are processed through
a novel algorithm to determine location and magnitude of impacts (Crisco, Chu et al.
2004). The user can access these data through the Head Impact Telemetry Impact
Analyzer software on laptop in the Sideline Response System unit. The HIT System
measures linear acceleration (measured in terms of gravitational acceleration, g),
30
(HITsp). The HITsp is a weighted composite score encompassing linear and rotational
accelerations, Gadd Severity Index, Head Injury Criterion, and impact location. The HIT
System is a valid measure of head impact biomechanics (Duma, Manoogian et al. 2005).
Visual and Sensory Performance Assessment
The Nike SPARQ Sensory Station is an evaluation and training tool of visual and
sensory performance designed for athletes. The Nike SPARQ Sensory Station is an
interactive touch screen device consists of a single computer that controls two
high-resolution LCD monitors (one twenty-two inch and one forty-two inch monitor). An
Apple iPod touch is also used for some of the assessments (Erickson, Citek et al. 2011).
See Table 2.1 for description and testing procedures for each evaluation component.
The Nike SPARQ Sensory Station has been found to be a reliable measure of
visual and sensory performance with no significant changes in performance between
multiple sessions on visual clarity, contrast sensitivity, depth perception, target capture,
perception span, and reaction time. However, an expected learning effect was found for
performance on Near-Far Quickness, Eye-Hand Coordination and Go/No Go across two
testing sessions separated by a period of about one week (Erickson, Citek et al. 2011).
Reaction Time Assessments
The subjects underwent a series of reaction time assessments including the
computerized tests CNS Vital Signs and Automated Neuropsychological Assessment
Metrics (ANAM), and the Clinical Reaction Time Apparatus. The Nike SPARQ Sensory
Station also includes a test of reaction time. Subjects completed the entire test on the
Nike SPARQ Sensory Station, but reaction time scores were used in the comparison to
31
CNS Vital Signs (CNS Vital Signs, LLC, Chapel Hill, NC) is a series
computerized neurocognitive test that was can detect changes in neurocognitive
performance over time. Participants only completed the Stroop test, which measures the
ability to react to a simple, but increasingly difficult set of directions. See Table 3.1 for a
complete description of the procedures for this test. The reaction time domain score is
calculated using the following equation: [Stroop Test (ST) Complex Reaction Time
Correct + Stroop Reaction Time Correct] /2. CNS Vital Signs has been found to be valid
and reliable (Gualtieri and Johnson 2006).
Automated Neuropsychological Assessment Metrics (Vista LifeSciences,
Washington D.C.) is a series of computerized neurocognitive tests that was developed by
the United States Military’s Office of Military Performance Assessment Technology to
detect changes in neurocognitive performance overtime. (Kabat, Kane et al. 2001). Our
study used the simple reaction time test, in which the individual is instructed to press the
mouse key upon the presentation of a simple stimulus of an asterisk on the screen. Our
study also used the procedural reaction time test, in which the individual is tested on both
reaction time and processing speed. The individual is presented with one of the numerals
2, 3, 4, and 5 and respond by clicking the left mouse button if the stimulus is a 2 or 3 and
clicking the right mouse button if the stimulus is a 4 or 5. ANAM has been found to be
valid and reliable (Kabat, Kane et al. 2001; Segalowitz, Mahaney et al. 2007).
The Clinical Reaction Time Apparatus was developed to give clinicians a simple
and inexpensive measure of reaction time that could be used on the sideline or in an
athletic training room. This device is a thin, rigid cylinder with a weighted disk attached
32
and catches it as quickly as possible using a pinch grip. Subjects completed two practice
trials followed by eight trials in which the examiner released the apparatus at
pre-determined randomized time intervals ranging from two to five seconds. The examiner
noted the measured distance at which the most superior portion of the subject’s pinch grip
makes contact with the apparatus. A trial in which the subjects dropped the apparatus
was noted as a “drop” and was not included as part of the calculation of clinical reaction
time. The Clinical Reaction Time Apparatus has been found to be a valid and reliable
measure of reaction time (Eckner, Whitacre et al. 2009).
Video Evaluation
The retrospective analysis of collision anticipation used previously analyzed
video footage and head impact biomechanical data from the Fall 2010 season. Impacts
were evaluated using the Player-to-Player Collision Type Evaluation Form that we
developed for our previous research in this area. Intrarater reliability was tested by
selecting and evaluating a subset of cases using the form, and then re-evaluating them
thirty days after initial evaluation (k=.88) (Ocwieja, Mihalik et al. 2012). The
Player-to-Player Collision Type Evaluation Form evaluates the following components: play type,
closing distance, starting stance of player and opponent, whether the player was striking
or being struck, whether the player was looking ahead or in the direction of the collision,
ball possession, infraction type, movement of player and opponent, and overall
impression of the level of anticipation based on these factors. (See Appendix A: The
33 Procedures
Subjects underwent a single testing at the beginning of the Fall 2012 season. A
trained clinician administered the testing session in a quiet controlled environment at the
Matthew Gfeller Sport-Related Traumatic Brain Injury Research Center (Chapel Hill,
NC). All subjects completed the tests in a counterbalanced order and received
standardized directions given by the administering clinician. The testing session took
approximately 30-45 minutes. Subjects were not given any feedback regarding
performance during the testing session. The testing session included the following
assessments: Nike SPARQ Sensory Station, and reaction time tests on CNS Vital Signs,
ANAM, and the Clinical Reaction Time Apparatus.
The team’s professional equipment manager fit subjects with an
MxEncoder-equipped Riddell helmet at the beginning of the Fall 2012 season. Head impact data were
collected during practices and games throughout the course of the season. The HIT
System and Sideline Response System were checked on a weekly basis and prior to all
games and practices, to ensure proper functioning.
The retrospective analysis of collision anticipation used previously analyzed
video footage and head impact biomechanical data from the Fall 2010 season. Video
footage was collected during all games and was filmed from two positions on the field:
sideline and end zone. During the Fall 2010 season, a research assistant was responsible
for setting up a video camera to record the game clock during competition and for
synchronizing the time to ensure that the video footage could be linked to the head
34
Collision Type Evaluation Form. The principal investigator was blinded to the
biomechanical data during impact video analysis to allow for an unbiased analysis. Each
impact was categorized as anticipated or unanticipated and as mild, moderate or severe.
Data Reduction
For our first research question, we used data from the scores on traditional
reaction time tests (CNS Vital Signs, ANAM, and Clinical Reaction Time Apparatus) and
the reaction time component of the Nike SPARQ Sensory Station evaluation. These
scores were analyzed using Pearson correlations to determine the relationship between
traditional measures of reaction time and reaction time as measured by the Nike SPARQ
Sensory Station. One participant sustained a season-ending injury during the first week
of practices, and another participant replaced his helmet with one incapable of supporting
the HIT System technology. For these reasons, we did not have sufficient head impact
biomechanical data and only used the scores from the initial testing session towards
answering our first research question. This created a sample size of 38 participants for
our first research question and 36 participants for our second research question.
For our second research question, we used raw data on visual and sensory
performance that was exported from the Nike SPARQ Sensory Station. Scores for each
individual test and the overall composite score were analyzed. We categorized subjects
into two groups based on their performance on each assessment of the Nike SPARQ
Sensory Station (High level of performance: ≥ 51st percentile; Low level of performance:
≤ 49th percentile). These percentiles were based on our study’s sample. The following
35
performance groups, and thus were included in our analyses: Depth Perception, Near-Far
Quickness, Target Capture, Perception Span, Eye Hand Coordination, Go/No Go, and
Reaction Time. We also categorized subjects into high and low performance groups
based on their performance on Visual Break and Reaction Time as measured by the
Clinical Reaction Time Apparatus. Raw head impact data from the games and practices
of the Fall 2012 season were exported from Sideline Response System using the Ridell
Export Utility into Matlab 7 (The Mathworks, Inc., Natick, MA). Linear acceleration (g),
rotational acceleration (rad/s2), and HITsp were the outcome measures of interest. All
impacts under 10 g were removed because they are considered negligible with respect to
head impact biomechanics and injury (Mihalik, Bell et al. 2007).
In order to allow for comparisons with previous research in this area, we
categorized the head impact severity based on linear acceleration as mild (<66g),
moderate (66-106g), or severe (>106g) and based on rotational acceleration as mild
(<4600g), moderate (4600-7900g), or severe (>7900g) for our chi-square analyses
(Zhang, Yang et al. 2004; Ocwieja, Mihalik et al. 2011). We used the two levels of
visual and sensory performance (high and low) and three levels of impact severity (mild,
moderate, severe) for our chi-square analyses to determine the association between level
of visual and sensory performance and head impact severity. The two levels of visual
and sensory performance (high and low) were also used in linear mixed model ANOVAs
to determine differences in head impact biomechanics between groups. Our third
research question was retrospective. We used previously analyzed video footage from
games played during the Fall 2010 season. The collisions were classified as
36
form. Raw head impact data from the Fall 2010 season were exported from Sideline
Response System using the Ridell Export Utility into Matlab 7 (The Mathworks, Inc.,
Natick, MA). Linear acceleration (g), rotational acceleration (rad/s2), and HITsp were the
outcome measures of interest. All impacts under 10 g were removed because they are
considered negligible with respect to head impact biomechanics and injury (Mihalik, Bell
et al. 2007). In order to allow for comparisons with previous research in this area, we
categorized the head impact severity based on linear acceleration as mild (<66g),
moderate (66-106g) or severe (>106g) for our chi-square analyses (Zhang, Yang et al.
2004; Ocwieja, Mihalik et al. 2011). We used two levels of collision anticipation
(anticipated, unanticipated) and three levels of head impact severity (mild, moderate,
severe) in our chi-square analyses to determine the association between level of collision
anticipation and head impact severity.
Data Analyses
All data were analyzed using SAS 9.3 statistical software with an a priori alpha
level of 0.05. Pearson correlational analyses were used to assess the relationship between
traditional measures of reaction time and reaction time as measured by the Nike SPARQ
Sensory Station. Three separate random intercepts general linear mixed models were fit
for linear acceleration, rotational acceleration, and HITsp. The large number of low
magnitude head impacts skewed the distribution of head impacts; therefore, we used the
natural logarithmic transformations for linear acceleration, rotational acceleration, and
37
Prospective Chi-Square analyses were used to assess the association between
level of visual and sensory performance (high and low) and an ordinal variable of impact
severity (mild, moderate, severe) based on linear acceleration and rotational acceleration
measures collected during head impacts that occurred during the Fall 2012 season.
Linear mixed model ANOVAs were performed to analyze the differences in head impact
biomechanics (linear acceleration, rotational acceleration, and HITsp) between high and
low visual and sensory performers in each of the visual and sensory performance
assessments.
Retrospective Chi-Square analyses were performed to assess the association
between level of anticipation (anticipated, unanticipated) and an ordinal variable of
impact severity (mild, moderate, severe) based on linear and rotational acceleration
measures that were collected during head impacts that occurred during the Fall 2010
season. Fisher’s Exact test was used in these Chi-Square analyses in order to account for
38 Table 3.1. Data analysis plan
Question Description Variables of Interest Comparison Method
1 Prospective Is there a
significant correlation between computerized and functional measures of reaction time and reaction time as
measured by the Nike SPARQ Sensory Station?
Traditional Measures
• CNS Vital
Signs Reaction Time Domain
• ANAM
Reaction Time
• Clinical
Reaction Time Apparatus Nike SPARQ Sensory Station
• Reaction Time
Test
Performance on traditional measures
Performance on Nike SPARQ Sensory Station reaction time test
Pearson Correlations
2 Prospective
Is there a significant association between level of visual and sensory performance and head impact severity in college football players?
Nike SPARQ Sensory Station
• Outcome
measures (10) HIT System
• Linear
Acceleration
• Rotational
Acceleration
• HITsp
Level of visual and sensory performance
• High level
• Low level
Head impact severity
• Mild
• Moderate
• Severe
Chi-Square
Linear mixed model ANOVA
3 Retrospective Is there a
significant association between collision anticipation and head impact severity in college football players?
Collision Anticipation
• Anticipated
• Unanticipated
HIT System
• Linear
Acceleration
• Rotational
Acceleration
• HITsp
Level of anticipation
• Anticipated
• Unanticipated
Head impact severity
• Mild
• Moderate
• Severe
39 Table 3.2. Stroop Test
Test Portion Description
1 A color word will appear at the bottom of
the screen in black font. Press the space bar as soon as you see a word appear on the screen.
2 A color word will appear at the bottom of
the screen. Press the space bar as soon as you see the color of the word match what the word says
3 A color word will appear at the bottom of
CHAPTER IV
MANUSCRIPT
Introduction
Concussion has been defined as a complex pathophysiologic process affecting the brain, induced by traumatic biomechanical forces that typically result in an impairment of
neurologic function and clinical symptoms such as disturbances of vision and equilibrium (McCrory, Meeuwisse et al. 2009). Sport-related concussions have become a major public health concern, with approximately 3.8 million sports-related traumatic brain injuries occurring in the United States each year (Langlois, Rutland-Brown et al. 2006). The majority of sport-related concussions occur in contact or collision sports such as football, which is one of the most popular sports among high school and collegiate males. (Bracken 2007; 2011). Sport-related concussions account for a high percentage of
injuries at both the collegiate and high school level of football (Dick, 2007;Gessel, 2007). Mechanisms of injury for concussions include both direct and indirect head
41
anticipation in an attempt to understand the causes and factors related to concussion. Anticipated collisions are associated with less severe head impacts in youth ice hockey players (Mihalik, Blackburn et al. 2010); however, this has not been extensively studied in collegiate football players. Visual and sensory performance, referring to the manner the brain receives sensory information from the eyes, integrates that with somatosensory and vestibular input from other sensors, and produces an appropriate motor response, may influence anticipation and affect an individual’s ability to withstand head impact forces. Individuals with higher levels of visual and sensory performance, including the characteristics of visual acuity and contrast sensitivity, are able to respond to their environment in a more efficient and appropriate way (Zimmerman, Lust et al. 2011). Visual training has been found to be transferable to the performance of athletes (Stine, Arterburn et al. 1982). Several tools exist to evaluate and train components of an individual’s level of visual and sensory performance. An athlete’s visual and sensory performance may not only be relevant to performance but also to their ability to anticipate and react to impending head impacts on the field, ushering in a new area of research with the goal of preventing injury while concurrently improving athlete performance.
42
Identifying the relationships between traditional measures of reaction time and visual sensory reaction time as measured by the Nike SPARQ Sensory Station will provide insight regarding the development of more appropriate testing batteries to evaluate an athlete’s level of visual and sensory performance to be used for injury prevention interventions. Therefore, the threefold purpose of this study was to determine: 1) the relationship between traditional measures of reaction time and reaction time as measured by the Nike SPARQ Sensory Station, 2) the association between level of visual and sensory performance and head impact severity in college football players, and 3) the association between collision anticipation and head impact severity in college football players.
Methods
Participants
We recruited 38 Division I college football players from the University of North Carolina at Chapel Hill Fall 2012 football team (age = 20.4±1.4 years; height = 190.2±6.7 cm; mass = 109.3±17.8 kg). Participants were selected based on input from the coaching and sports medicine staff to include a variety of player positions including 2
quarterbacks, 3 wide receivers, 3 offensive backs, 12 offensive linemen (including tight ends), 12 defensive backs (including linebackers), and 6 defensive linemen. All
participants signed an informed consent form approved by the university institutional review board prior to participation in the study. Inclusion criteria required that
43
participating in the study. Exclusion criteria included anyone who had a history of permanent vision loss or was currently symptomatic from a head, neck, or eye injury that would have negatively affected scores on visual and sensory performance tasks.
Instrumentation
Head Impact Telemetry System
The Head Impact Telemetry System (Simbex, Lebanon, NH) was used to collect helmet linear acceleration, rotational acceleration, and Head Impact Technology severity profile (HITsp) data. The HIT System is comprised of six spring-loaded single-axis accelerometers inserted into Riddell VSR4 (sizes: L or XL), Revolution (sizes: M, L, or XL), or Revolution Speed (sizes: M, L, or XL) football helmets (Riddell Corporation) and the Sideline Response System. The in-helmet accelerometers are strategically placed to allow for measurement of linear and rotational acceleration and impact location. Up to 100 separate head impacts can be stored in the on-board memory built into the
accelerometer. The accelerometers collect data at 1 kHz for a period of forty
milliseconds; eight milliseconds are recorded before the data collection trigger and thirty-two milliseconds of data are collected after the trigger. The HIT System can collect data from up to 64 players over a distance greater than the length of a football field.
The Sideline Response System was located on the sideline during games and practices. This unit receives time-stamped, encoded data from the in-helmet
44
measures linear acceleration (measured in terms of gravitational acceleration, g),
rotational acceleration (measured in rad/s2), and Head Impact Technology severity profile (HITsp). The HITsp is a weighted composite score encompassing linear and rotational accelerations, Gadd Severity Index, Head Injury Criterion, and impact location. The HIT System is a valid measure of head impact biomechanics (Duma, Manoogian et al. 2005). Visual and Sensory Performance Assessment
The Nike SPARQ Sensory Station is an evaluation and training tool of visual and sensory performance designed for athletes. The Nike SPARQ Sensory Station is an interactive touch screen device consisting of a single computer that controls two high-resolution LCD monitors (one twenty-two inch and one forty-two inch monitor). An Apple iPod Touch is also used for some of the assessments (Erickson, Citek et al. 2011). See Table 2.1 for description and testing procedures for each evaluation component. The Nike SPARQ Sensory Station has been found to be a reliable measure of visual and sensory performance with no significant changes in performance between multiple sessions on visual clarity, contrast sensitivity, depth perception, target capture, perception span, and reaction time. However, an expected learning effect was found for performance on Near-Far Quickness, Eye-Hand Coordination and Go/No Go across two testing
sessions separated by a period of about one week (Erickson, Citek et al. 2011). Reaction Time Assessments
45
Nike SPARQ Sensory Station, but reaction time scores were used in the comparison to the previously mentioned assessments.
CNS Vital Signs (CNS Vital Signs, LLC, Chapel Hill, NC) consists of a series of computerized neurocognitive tests capable of detecting changes in neurocognitive performance over time. Participants only completed the Stroop test, which measures the ability to react to a simple, but increasingly difficult set of directions. See Table 3.1 for a complete description of the procedures for this test. The reaction time domain score is calculated using the following equation: [Stroop Test (ST) Complex Reaction Time Correct + Stroop Reaction Time Correct] /2. CNS Vital Signs has been found to be valid and reliable (Gualtieri and Johnson 2006).
Automated Neuropsychological Assessment Metrics (Vista LifeSciences,
Washington D.C.) is a series of computerized neurocognitive tests that was developed by the United States Military’s Office of Military Performance Assessment Technology to detect changes in neurocognitive performance overtime. (Kabat, Kane et al. 2001). Our study used the simple reaction time test, in which the individual is instructed to press the mouse key upon the presentation of a simple stimulus of an asterisk on the screen. Our study also used the procedural reaction time test, in which the individual is tested on both reaction time and processing speed. The individual is presented with one of the numerals 2, 3, 4, and 5 and respond by clicking the left mouse button if the stimulus is a 2 or 3 and clicking the right mouse button if the stimulus is a 4 or 5. ANAM has been found to be valid and reliable (Kabat, Kane et al. 2001; Segalowitz, Mahaney et al. 2007).
46
athletic training room (Eckner, Whitacre et al. 2009). This device is a thin, rigid cylinder with a weighted disk attached to the bottom. The examiner holds and releases the
apparatus while the individual reacts and catches it as quickly as possible using a pinch grip. Subjects completed two practice trials followed by eight trials in which the examiner released the apparatus at pre-determined randomized time intervals ranging from two to five seconds. The examiner noted the measured distance at which the most superior portion of the subject’s pinch grip makes contact with the apparatus. A trial in which the subjects dropped the apparatus was noted as a “drop” and was not included as part of the calculation of clinical reaction time. The Clinical Reaction Time Apparatus has been found to be a valid and reliable measure of reaction time (Eckner, Whitacre et al. 2009).
Video Evaluation
47
overall impression of the level of anticipation based on these factors. (See Appendix A: The Player-to-Player Collision Type Evaluation Form).
Procedures
Subjects underwent a single testing at the beginning of the Fall 2012 season. A trained clinician administered the testing session in a quiet controlled environment in our clinical research center. All subjects completed the tests in a counterbalanced order and received standardized directions given by the administering clinician. The testing session took approximately 30-45 minutes. Subjects were not given any feedback regarding performance during the testing session. The testing session included the following assessments: Nike SPARQ Sensory Station, and reaction time tests on CNS Vital Signs, ANAM, and the Clinical Reaction Time Apparatus.
The team’s professional equipment manager fit subjects with an MxEncoder-equipped Riddell helmet at the beginning of the Fall 2012 season. Head impact data were collected during practices and games throughout the course of the season. The HIT System and Sideline Response System were checked on a weekly basis and prior to all games and practices, to ensure proper functioning.