i
NCResSys: A Geospatial Modeling Information System for the Identification of
Potential Municipal Water Supply Reservoir Locations across the State of North Carolina
Timothy P. Morrissey
A thesis submitted to the faculty of the University of North Carolina at Chapel Hill in partial fulfillment of the requirements for the degree of Master of Arts in the Department of Geography.
Chapel Hill 2013
Approved By: Dr. Stephen J. Walsh
ii
ABSTRACT
TIMOTHY MORRISSEY: NCResSys: A Geospatial Modeling Information System for the Identification of Potential Municipal Water Supply Reservoir
Locations across the State of North Carolina (Under the direction of Dr. Stephen J. Walsh)
iii
TABLE OF CONTENTS
ABSTRACT ... ii
TABLE OF CONTENTS ... iii
LIST OF FIGURES ... vi
CHAPTER 1: INTRODUCTION ... 1
1.1 Background & Problem Statement ... 2
1.2 Objectives ... 4
1.3.1 Data ... 8
1.3.2 Analysis ... 13
1.4. Structure ... 14
CHAPTER 2: STUDY AREA & DATA ... 15
2.0 Study Area ... 15
2.1 Data ... 17
2.2 Terrain ... 20
2.3 Hydrology ... 24
2.4 Socio-Economic ... 27
2.6 Conclusions ... 29
iv
3.1 Technical Design & System Architecture ... 31
3.2 Terrain Analysis ... 34
3.2.1 Sub-Catchment Processing ... 37
3.2.1.1 Reservoir Catchment Delineation ... 39
3.2.1.2 Reservoir Catchment Terrain Data ... 42
3.2.2 Reservoir Modeling ... 43
3.2.2.1 Stream Network Derivation ... 45
3.2.2.2 Stream Network Analysis – Dam Locating ... 46
3.2.2.3 Iterative Reservoir Inundation ... 47
3.3 Hydrologic Analysis ... 50
3.3.1 Safe Yield Analysis ... 51
3.3.2 Spatial Interpolation of Safe Yield ... 53
3.4 Socioeconomic Impact Analysis ... 56
3.5 Conclusions ... 57
CHAPTER 4: RESULTS & CONSIDERATIONS ... 58
4.1 Software Components ... 58
4.2 Reservoir Candidate Location Analysis – Specific Implementation... 59
4.2.1 Statewide Thematic Analysis ... 59
4.2.2 Reservoir Modeling ... 63
v
CHAPTER 5: FUTURE DIRECTION & CONCLUSION ... 68
5.1 Review ... 68
5.2 Future Direction ... 69
5.3 Conclusion ... 70
vi
LIST OF FIGURES
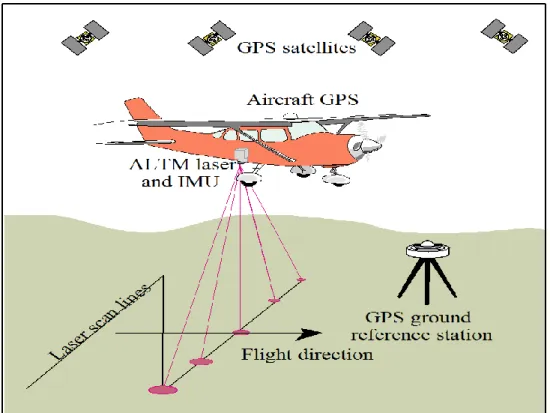
Figure 1.1 - Airborne LiDAR Collection System ... 10
Figure 1.2 - LiDAR Formats Discrete Return & Full Waveform (ESRI, 2012) ... 11
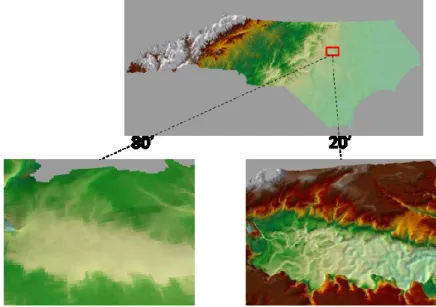
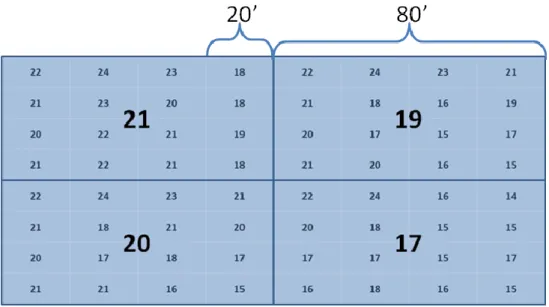
Figure 1.3: DEM Spatial Resolution - NC DOT 80ft vs. NCFMP 20ft. ... 12
Figure 2.1 - NCResSys Prototype Area - Population Growth ... 17
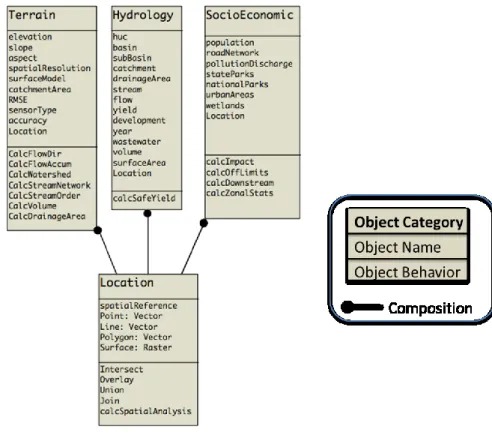
Figure 2.2: NCResSys Logical Object Model ... 18
Figure 2.3 - Amount of Information 20ft vs. 80ft DEM ... 21
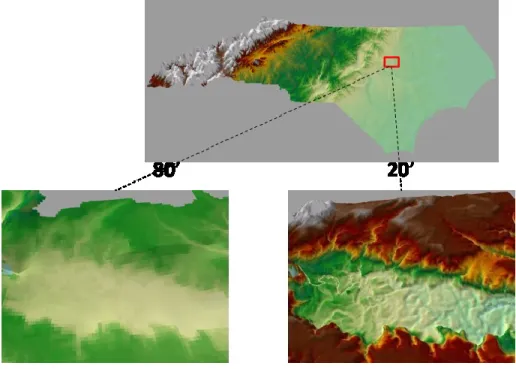
Figure 2.4 - Elevation Differences 80ft vs. 20ft in North Carolina ... 22
Figure 2.5 - USGS Hydrologic Unit Code areas North Carolina ... 26
Figure 2.6 - Socioeconomic Data sets NCResSys ... 29
Figure 3.1 - NCResSys Technical Architecture ... 32
Figure 3.2 - NCResSys System Design Diagram... 34
Figure 3.3 - NCResSys Terrain Processing Component Object Model UML ... 35
Figure 3.4 - NCResSys Terrain Processing Com High Level Processing Flow ... 37
Figure 3.5 - NCResSys Sub-Catchment Terrain Analysis Processing Algorithm ... 38
Figure 3.6 - USGS River Basins and River Sub Basins of North Carolina. ... 39
Figure 3.7 - Spatially partitioning statewide 80ft DEM 56 USGS Sub Basins. ... 40
Figure 3.8 - Terrain-derived River Sub Basin Catchments (Sub-Catchments). ... 41
Figure 3.9: Sub-Catchment Boundary used to Create 20ft Terrain Dataset (SubCatchment20). ... 43
Figure 3.10 - NCResSys Reservoir Modeling Terrain Analysis Algorithm ... 45
vii
Figure 3.12 - Reservoir Inundation Modeling at 1 Dam Location, varying Heights from 25ft to 150ft. ... 49 Figure 3.13 - Safe Yield Analysis Calculation (Moreau, 2009) ... 52 Figure 3.14 - Hydrologic Analysis Safe Yield Calculations (Moreau, 2009) ... 53 Figure 3.15 - Safe Yield IDW Interpolated Surface - 20 year safe yield at 2%
Development ... 54 Figure 3.16 - Safe Yield Kriging Interpolated Surface - 20 year safe yield at 2% Development ... 55 Figure 4.1 - NCResSys Reference Implementation – “PPP Off-limits” ... 60 Figure 4.2 - NCResSys Reference Implementation - Available Sub-Catchments .... 61 Figure 4.3 – Dynamic Socio-Economic Statewide Analysis of Potential Reservoir Locations ... 62 Figure 4.4 - NCResSys - Reservoir Modeling Output - Dam Locations & Dam
1
CHAPTER 1: INTRODUCTION
In recent years, the State of North Carolina has experienced drought conditions that have left municipal water supplies at alarmingly low levels across the State. These periods of drought, compounded by regional population growth and economic development, demonstrate the need for a statewide system to assess the potential for expanding municipal water supplies. Such an analysis would assess the spatial pattern and density of population, sensitive and protected environments, terrain conditions, land use and land cover patterns, existing reservoirs and water distribution systems, transportation networks, restricted areas, such as, existing urban centers, and the hydrologic capacity of the State of North Carolina to support additional, potential reservoir sites.
2
1.1 Background & Problem Statement
Communities across the State of North Carolina have experienced periods in which public water supply levels have fallen to alarmingly low levels in recent years. The regional drought of 2007 was the worst drought since record keeping began in 1895 (North carolina drought management advisory council activities report -
2008.2008). The National Weather Service identified 2007 as the driest year in North
Carolina in over 100 years, and the United States Geological Survey (USGS) reported the lowest stream flows in more than 110 years for many of the rivers in the State. These climatic and hydrologic conditions led to many public water supplies reaching record low levels across the State. Along with these climatic conditions, the State has seen rapid population growth and economic development in the past 15 years. With forecasts continuing this population growth trend for years to come
(Population Estimates and Projections - NC | OBSM, 2009), the already stressed
capacity of public water supplies will most likely experience increased levels of demand. The ability of government to maintain adequate water supplies is an essential component of public safety, security, and well-being. The public requires a reliable source of public water supply through variable climatic and population conditions to maintain safety and quality of life. The impacts of drought and population growth on public water supplies throughout the State of North Carolina are clear and the predictions are dire.
3
current capacity was in place by 1965, and 96% was in place by 1985. During the period from 1910 to 1965, population in the State increased by 2.6 million people and over 5 million acre feet (MAF) of reservoir storage was constructed. This represents an average of 1.9 acre-feet for each new resident. In the period since 1965, population has increased by over 4.4 million people, while only 0.89 MAF of water storage has been added. This is an investment of 0.19 acre-feet per new resident, 1/10 the rate from 1910 to 1965. Along with this slowdown in water supply development there exist a lack of a systematic process to identify sites where water can be stored specifically for the purpose of municipal water supply, given social and ecological constraints as well as places of compelling need and opportunity.
The most comprehensive study of reservoir sites was primarily for hydroelectric power. Congress directed the United States Army Corps of Engineers (USACE) in the “Rivers and Harbors Act of 1925” to identify potential sites for hydroelectric power and to suggest how those sites should be developed to best serve the interests of flood control, irrigation, and navigation, along with hydropower (Northwest Power and Conservation Council, 2012). Some of those sites were subsequently billed as multipurpose reservoirs that include public water supply as a component, but reports did not include sites that would be primarily used for public water supplies.
4
potential for expanding municipal water supplies across the State of North Carolina. This research addresses this need through the creation of a computational, geospatial, information system for the modeling of hydrologic yields, terrain conditions, and potential municipal water supply reservoirs sites across the State of North Carolina. The basic intent is to generate an exploratory, screening tool and analytical approach to conduct statewide analyses of potential reservoir sites across the State of North Carolina, given specific needs and opportunities that link people and the environment in explicit ways to terrain and hydrologic conditions.
1.2 Objectives
5
development, and management. This project will provide an approach to identifying potential sites for public water supply development as well as quantifying and spatially representing the potential impacts – benefitting not only public policy decision-making, but also contributing to public knowledge on water supply and impact. Further, this project will consolidate geospatial data for the State of North Carolina, particularly multi-resolution LiDAR data and other multi-thematic GIS data layers that are integrated into the analytical design and processing approach.
As a comprehensive geospatial modeling information system, NCResSys can be utilized to aid the various levels of municipal water resource management decision making across the entirety of the State of North Carolina. This research develops an information system that provides statewide analytical coverage in terms of the computation modeling of the physical characteristics of a reservoir, as well as the impact of that reservoir across a myriad of thematic categories, such as population, transportation, etc. As a terrain-based, extensible, computational reservoir identification system, NCResSys avoids making value judgments of the political feasibility of a potential reservoir location. Instead, this research addresses the need for a systematic process to identify sites to store water for use by public water suppliers. This analytical approach facilitates statewide analyses of potential reservoir sites across the State of North Carolina, in a comprehensive manner that allows for decision-makers and stakeholders to focus on the benefits and impacts of sites that might be developed.
6
information science. The NCResSys information system was designed and developed according to the object-oriented analysis and design (OOAD) software engineering approach. This iterative development approach allows for the identification of application components as objects containing state (attributes) and behavior (functions). Per this methodology, a series of data modeling exercises will be conducted to identify the ‘real-world’ components, or objects, that comprise the needed information involved with modeling potential reservoir locations. This methodology provides the informational framework in which to design the computational algorithms to accomplish the objectives of modeling a municipal water supply reservoir. This informational framework is detailed in chapter two of this thesis, but includes components such as River Basin, Catchment, Stream Network, Yield, Reservoir, Dam, etc. Each of these components has attributes (name, area, length, elevation, volume, etc.) and relationships to other components in the system (River Basin contains a Sub River Basin). In the context of a geospatial information system, these informational components include the generic geographical characteristic of location. This facilitates the ability to calculate the measurement of the spatial relationship between components of the NCResSys (Reservoir at location A intersects with Road Network B). From this information design and architecture a comprehensive database of geospatial data sets will be collected to perform the necessary computational spatial analysis for modeling the physical characteristics and impact of a potential reservoir location.
7
8
gauge record stations located throughout the State of North Carolina. These terrain and hydrologic analyses will provide the physical model of a reservoir at any given location, including volume, surface are, safe yield, and impacted area.
1.3. Data Processing and Analysis
1.3.1 Data
The primary datasets for the NCResSys fall into three broad categories: (1) terrain, (2) hydrology, and (3) thematic Socio-Economic. The State of North Carolina has an extensive inventory of publicly available geospatial data. Various state agencies, along with county and municipal governments, provide multi-thematic data freely available to the public. The North Carolina Center for Geographic Information and Analysis (NCCGIA) is a cost-recovery, public agency in North Carolina who is largely responsible for the generation, maintenance, and consolidation of multi-thematic geospatial data for the State of North Carolina.
9
10 Figure 1.1 - Airborne LiDAR Collection System
11
three-dimensional representation of vegetation structure. Discrete point data is post-processed to produce extremely accurate representations of the Earth’s surface.
NCResSys utilizes the discrete-return LiDAR data collected and processed into
DEMs by the NCFMP.
Figure 1.2 - LiDAR Formats Discrete Return & Full Waveform (ESRI, 2012)
12
facilitates the terrain-based hydrologic modeling for the NCResSys and presents a unique opportunity for water resource system management.
Figure 1.3: DEM Spatial Resolution - NC DOT 80ft vs. NCFMP 20ft.
Hydrography data sets include the National Hydrography Dataset (NHD+) for coarse scale hydrologic units such as river basin and sub basin. Hydrologic data from the United States Geological Survey (USGS) contains stream flow gauge data that are utilized to characterize stream reach inflow and gross hydrologic yield estimates.
13
analyzed to address mitigating impacts to potential reservoir site analysis based on the inundation zone created and the parameters of the reservoir.
1.3.2 Analysis
The methodology for the NCResSys involves a number of techniques including physical terrain analysis, spatial analysis, and software engineering. The process for identifying potential municipal water supply sites involves the calculation of the physical capacity of a reservoir at a given location or dam site. This physical capacity, in terms of volume, is derived from the terrain surrounding the given dam location. Through the analysis of terrain over multiple spatial scales, the following solution provides the ability to model individual reservoir locations using a series of recursive terrain and hydrologic analyses that are based on geographic scale, from coarse (statewide) to fine (reservoir site), explicitly driven from the LiDAR terrain data.
14
and rich data source, while still providing comprehensive statewide exploratory analysis.
Spatial analysis is conducted on the output of the physical reservoir identification to spatially reference the potential inundation zone of the site against the socio-economic datasets. This system is composed of a modular, component driven, object-oriented framework and application developed in the Python programming language.
1.4. Structure
15
CHAPTER 2: STUDY AREA & DATA
This chapter describes the geographic study area and corresponding data sets utilized in the NCResSys, the geospatial modeling information system for identifying potential municipal reservoir locations in the State of North Carolina. The design of the terrain processing algorithms of the NCResSys produces a data-driven computational geospatial modeling engine that is not constrained by a specific geographic study area. However, the spatial extent of the data sets analyzed in the specific implementation of these computational algorithms in NCResSys produces the geographic study area bounds, i.e., the State of North Carolina. As such, the study area and data sets are related in a spatially explicit manner, but the geospatial tool that is described can be used for any locale even beyond the State of North Carolina.
2.0 Study Area
16
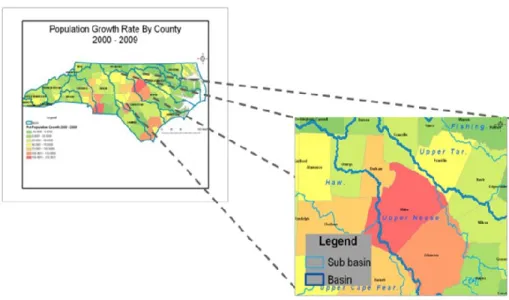
extent of the input data characterizes the study area under analysis. While the terrain-based computational algorithms have been designed to process data regardless of location, the specific implementation of the NCResSys utilizes spatial data for the State of North Carolina. While, the information system is comprehensive in providing statewide analysis for the modeling of municipal reservoir sites, a prototype area was selected to demonstrate the capabilities of the NCResSys. This prototype area has varying terrain, hydrologic, and dynamic socio-economic conditions to test the tool. Based on projected population growth numbers (Office of State Budget & Management, 2009).
17
Figure 2.4 - NCResSys Prototype Area - Population Growth
2.1 Data
18
imperative when modeling the abstract characteristics and behaviors associated with the development of a municipal water supply reservoir. These categories of information include the following: (1) terrain, (2) hydrology, and (3) multi-thematic socio-economic conditions. Together, these site descriptors or analytical dimensions form the logical data model for developing the NCResSys. The spatially explicit environment in which this information system functions is a key component in the logical data model. As such, the generic geographic characteristic of location is associated with each component of the data model. By providing an inherent characteristic of location in each component of the data model, the spatial relationship between components can be analyzed in the context of a GIS (Milne, Milton, & Smith, 1993; Raper & Livingstone, 1995) .
19
As Figure 2 indicates, adhering to the data modeling principles of the OOAD methodology produces the informational framework of attributes and behaviors for the components involved IN computationally modeling a municipal water supply reservoir. Each broad information category (i.e., terrain, hydrology, socio-economic descriptors) is further broken down into the logical objects, including associated attributes (nouns) and behaviors (verbs) that serve as the basis for the data and algorithms of the NCResSys.
20
(NCCGIA) is a cost-recovery, public agency in North Carolina who is largely responsible for the generation, maintenance, and consolidation of multi-thematic geospatial data for the State of North Carolina (NC Center for Geographic Information & Analysis, 2010). A number of the socioeconomic thematic data sets were provided from the NCCGIA.
2.2 Terrain
Terrain, the vertical and horizontal dimension of land surface, is the primary data set used in this study to identify the physical characteristics of a potential reservoir location. While a land surface coverage can change over time, the baseline surface terrain is considered a static dataset. As such, the NCResSys derives the physical characteristics of a potential reservoir location based on the static terrain data. These characteristics, such as volume and surface area, form the logical basis of what a reservoir is and changes in terrain determine how damning, inundating, and developing a location can be quantified and spatially analyzed against the other logical data categories, i.e., hydrology and socio-economic conditions ((Woolard & Colby, 2002).
21
contain a regular grid of cells, with each cell containing a singular value of elevation that is representative of the 80ft of land surface at that specific location. In contrast, a 20ft spatial resolution DEM will contain a single elevation value for every 20ft of land surface coverage (Woodcock & Strahler, 1987). Thus, as Figure 3 indicates, a 20ft DEM contains a much higher density of elevation values for a given area. In fact, for the same area of land surface, a 20ft DEM will contain a square of squares, or n to the 4th power (n4), the amount of elevation values as the 80ft DEM (Figure 3).
Figure 2.6 - Amount of Information 20ft vs. 80ft DEM
22
help to identify potential reservoir locations and drainage basins that might not have been identified at the coarser scale (Marks & Bates, 2000). However, the increase in data volume from the 20ft DEM also equates to increased complexities when computationally processing the terrain data over larger geographic areas. These challenges are detailed in Chapter 3.
Figure 2.7 - Elevation Differences 80ft vs. 20ft in North Carolina
23
24
As previously mentioned, the NCResSys, utilizes LiDAR derived DEMs from two sources: NCFMP and NC DOT. These data sources are representations of discrete-return LiDAR data that has been collected and processed into DEMs at the 80ft and 20ft spatial resolutions. NC DOT produces a more generalized Digital Elevation Model (DEM) at the statewide scale with a spatial resolution of 80ft. The NCFMP produces a more detailed DEM available at the county level with a spatial resolution of 20ft. The multiple-scale resolution of the terrain data for the State of North Carolina facilitates the design and implementation of the recursive algorithm and general analytical approached developed to site potential reservoir sites in North Carolina, as detailed in Chapter 3. As previously mentioned, the spatial resolution of the DEM determines how much ground coverage each pixel represents in terms of a single elevation measure. In this case, the NC DOT DEM contains one elevation value per 80ft x 80ft of horizontal ground coverage, while the NCFMP DEM contains one elevation value per 20ft x 20ft of horizontal ground coverage. Thus, the NCFMP DEM produces a much more detailed and accurate representation of terrain. While LiDAR derived data are highly accurate, it presents tremendous challenges for computational processing of terrain characteristics necessary to model reservoir capacity and potential site selection. This highly accurate elevation data on a statewide scale facilitates the terrain-based hydrologic modeling for the NCResSys
and presents a unique opportunity for water resource system management.
2.3 Hydrology
25
United States can be categorized through the United States Geologic Survey’s (USGS) Hydrologic Unit Code (HUC) designation. The USGS demarcates the US into successively smaller hydrologic units that are classified into four levels: region, sub-region, accounting units, and cataloging (U.S. Geological Survey, 2012c). Each of these smaller units is identified through its HUC designation. For example, the Upper Neuse River area of North Carolina is hydrologically identified according to the USGS schema as an 8-digit cataloging unit or HUC-8, “03020201” (Seaber, Kapinos, & Knapp, 1994). This is deconstructed through the hierarchy of HUCs, by region (03, South Atlantic-Gulf, HUC-2), sub-region (0302, Neuse-Pamlico, HUC-4), accounting unit (030202, Neuse, HUC-6) and finally by cataloging unit (03020201, Upper Neuse, HUC-8). Each of these HUCs is aggregated by area and drainage basin. Areas within each of these HUCs will drain to the same ultimate location, given the terrain within the HUC.
26
Figure 2.8 - USGS Hydrologic Unit Code areas North Carolina
Along with the HUC boundary data from the USGS, dynamic stream gauge data are utilized to calculate a measure of the yield from the potential reservoir location. This is a dynamic data source, as the stream gauge recordings are variable over time, based on the precipitation patterns throughout the recording period (U.S. Geological Survey, 2012b). As such, these data are calculated in a separate process from the terrain analysis processing engine, which is operating on data that are static over time. The aggregation of stream gauge recording stations over time produces the hydrologic record of a given area.
27
gauges serves as the computational input to determine the safe yield, or the maximum uniform rate of withdrawal from an impoundment over the historical record of stream flows for each gauge location. Spatially interpolating a continuous surface from the 118 stream gauges provides a measure of precipitation, as well as safe yield, over time and time for the entire State of North Carolina.
2.4 Socio-Economic
The third category of data, socio-economic, consists of a multitude of various spatially-explicit thematic data sets. These data are dynamic in nature and thus is utilized to identify, characterize, and quantify the development impacts of a potential reservoir location across the various themes. Based on the dynamic computational design of the NCResSys, any geo-referenced data set can be analyzed in a spatially explicit manner against the modeled reservoir. Due to the highly dynamic nature of these types of data this are key, as not only can new geo-referenced data be added for analysis, newer versions of thematic data can also be evaluated and inserted into the data system.
28
address mitigating impacts to potential reservoir site locations based on the inundation zone created and the parameters of the reservoir. Along with the hydrologic measures of HUC and yield, these various thematic datasets are analyzed for the potential reservoir flood inundation zone in a spatially explicit manner, thus identifying, characterizing, and quantifying the impacts at that location, such as, percent of land use inundated, length and type of roads inundated, and proportion of the parklands inundated when the flooding of land at a specified location to a set of reservoir specifications (Goodchild et al., 1992).
29 Figure 2.9 - Socioeconomic Data sets NCResSys
2.6 Conclusions
30
CHAPTER 3: METHODS & ANALYSIS
This chapter describes the analytical approaches and general methods of the
NCResSys, the geospatial modeling information system for identifying potential
municipal reservoir locations in the State of North Carolina. The overall system level design for the NCResSys employs a number of techniques from various disciplines such as software engineering, three-dimensional terrain processing, and spatial analysis. Continuing from the conceptual, logical, and physical data modeling processes of the Object-Oriented Analysis & Design (OOAD) software engineering methodology, described in Chapter 2 of this document, data-driven application components and algorithms have been designed to computationally model the development of potential reservoir locations in a spatially explicit manner. Each of the system level components of the NCResSys is described, as well as the overall system architecture and technical implementation details.
31
constant or static datasets, as well as dynamic data elements. Terrain data were chosen as the driver of all analyses due to its static nature. Spatial analysis is conducted on the output of the physical reservoir identification to spatially reference the potential inundation zone of the site against the socio-economic datasets.
As Chapter 2 detailed, through the OOAD data modeling process, three logical data component, subject areas were identified: terrain, hydrologic, and socio-economic. Location was also identified as a key component of modeling potential reservoirs in a spatially explicit manner. Building upon this informational data model, the computational algorithms and components were designed and implemented to analyze the primary data components of terrain, hydrology, and socio-economic conditions. This chapter details the software engineering elements of the technical architecture, design, and development of the NCResSys, as well as the analytical processing algorithms computed for the terrain, hydrologic, and socio-economic data layers, producing the comprehensive geospatial modeling information system for identifying potential municipal reservoir locations in the State of North Carolina, or
NCResSys.
3.1 Technical Design & System Architecture
32
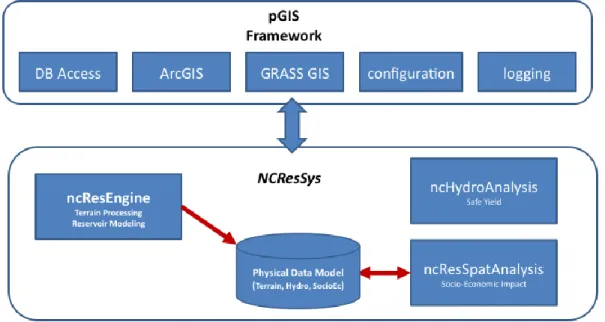
applications developed in the Python programming language. A high-level system diagram is shown in Figure 1.
To address the data intensive processing challenges associated with high-density terrain analysis, NCResSys was designed as an implementation of the pGIS geospatial analysis framework (Morrissey, 2010b). pGIS is an abstract processing framework developed in the Python programming language that incorporates the capabilities of multiple GIS systems, and extends those systems in a customizable and configurable framework for geospatial analysis and modeling implementations. pGIS provides modular implementation of the ArcGIS geoprocessing and GRASS GIS libraries in an application framework allowing for seamless inter-system processing, allowing the implemented application access to the strengths of each GIS system. Along with this inter-GIS capability, pGIS provides modular and
33
extensible functionality of the Python programming language, such as configurations, logging, email, file system management, data access, web output and visualizations, among others. NCResSys is a reference implementation of the pGIS framework that is thematically geared towards three-dimensional, multi-scale, terrain analysis (Morrissey, 2010a). This framework allows the ability to design and develop the above solution as a robust application that utilizes the computational efficiency of the binary raster processing of GRASS GIS for the terrain and hydrologic processing, while also utilizing the geographic transformations, vector processing, and display strengths of ArcGIS (Chairat & Delleur, 1993; Guo Xian-chun, Luo Ding-gui, Zou Shi-lin, Li Da-jun, & Zheng Wan-qing, 2009; Neteler & Mitasova, 2002). The pGIS framework provides abstraction between the computational processing libraries for performing spatially explicit analysis, such as GRASS GIS Python package (i.e., grass. script) and the specific implementation theme of the NCResSys.
System architecture and overall technical design was created through the OOAD approach for the design of system level components at multiple levels. The creation of UML diagrams such as system diagrams, object models, and processing flow charts were conducted through the OOAD methodology, from the high level architecture down to the individual terrain-processing algorithms (Dobing & Parsons, 2005). As described in Chapter 2, the three logical categories of information for the
NCResSys: terrain, hydrography, and socio-economic, form the base of the
34
three information domains. The components interact with other data and analyses through interfaces designed as part of the OOAD process. The process of modeling the individual components through UML object models diagrams and algorithm processing flow charts for the physical terrain analysis component are discussed below. The relationships of the hydro and socio economic components are also detailed. The high-level system diagram (Figure 2) provides the design connection between the logical data model and the computational system level components.
Figure 3.11 - NCResSys System Design Diagram
3.2 Terrain Analysis
The methodology for designing the terrain component of the NCResSys
35
and software engineering. Potential reservoir locations are identified through their physical capacity and general characteristics, such as surface area and volume, utilizing multi-scale terrain data (Band, 1986; More, Grayson, & Ladson, 1991). This geospatial modeling methodology involves a series of recursive terrain and hydrologic analysis based on geographic scale, from coarse (statewide) to fine (reservoir site), explicitly driven from terrain data. The logical information objects for the terrain-processing component of NCResSys are technically implemented via the creation of specific instances of these objects. UML object model diagrams help to identify the attributes, behaviors, and relationships of the logical objects (Figure 3). These objects are computationally processed via Python classes with attributes, methods, and relationships that comprise the terrain processing analysis component.
The necessary terrain processing routines for identifying potential municipal water supply sites across the large geographic region of the State of North Carolina requires a novel approach to balance computational efficiency and feasibility, while providing the most accurate models of reservoir capacity and characteristics. The
36
LiDAR elevation data sets utilized in the NCResSys present an extremely dense data source that, while is increasingly accurate than other DEM data sources, presents computational challenges for processing terrain-driven hydrologic characteristics, especially at scale (Band, Patterson, Nemani, & Running, 1993; Hopkinson, Hayashi, & Peddle, 2009; Marks & Bates, 2000). As such, the designed solution for identifying potential reservoir sites is a recursive algorithm that utilizes the coarser, 80ft DEM over larger geographical areas, such as River Sub Basin (8 digit USGS HUC), to derive smaller watershed boundaries to model potential reservoir sites utilizing the finer-grained 20ft DEM. This design results in a solution that utilizes the highly accurate LiDAR-derived terrain data over smaller areas, thus, mitigating the computational constraints of using such a dense and rich data source, while still providing comprehensive statewide analysis. Previous research efforts in the State of North Carolina have shown the value and challenges of utilizing LiDAR derived DEM data for performing terrain analysis (Mitasova, Drake, Bernstein, & Harmon, 2004; Mitasova, Overton, & Harmon, 2005; Mitasova, Overton, Recalde, Bernstein, & Freeman, 2009). The enhanced data capabilities of the available LiDAR data for conducting terrain analysis present a unique opportunity for modeling reservoir capacity across the State.
37
reservoir modeling. The Reservoir Modeling Processing algorithm performs fine-grained terrain analysis for modeling the physical capacity of a reservoir at given dam characteristics such as location and height. These algorithms form the computational and analytical processing for the terrain analysis component of the
NCResSys information system.
Figure 3.13 - NCResSys Terrain Processing Component High Level Processing Flow
3.2.1 Sub-Catchment Processing
38
processing flow chart details the computational routines involved in this algorithm (Figure 3.5). Python code has been developed according to the specification of the Terrain Processing object model (Figure 3.3) and this processing flow chart (Figure 3.5) (GRASS Development Team, 2008; Neteler & Mitasova, 2002). The Sub-Catchment Terrain Processing Algorithm flow chart details the recursive computational analysis of raster DEM data into smaller Sub-Catchment areas for fine-grained detailed analysis. Utilizing the GRASS raster processing engine, the hydrologic characteristics, such as flow direction, flow accumulation, watershed basin, drainage area, and stream network can be derived. By computationally controlling the processing area of interest, or masking, high density DEM data can be processed over increasingly smaller areas. This provides the balance between computational feasibility and accuracy. The details of this computational processing algorithm are described below.
39
3.2.1.1 Reservoir Catchment Delineation
The process of deriving catchments for potential reservoir sites across the State is a series of computational routines that start at the macro, statewide scale and become recursively finer-grained at the individual potential reservoir site. The State of North Carolina contains 18 River Basins (HUC 6) and 56 River Sub Basins (HUC 8) as defined by the United States Geological Survey (USGS) (Figure 6).
Figure 3.15 - USGS River Basins and River Sub Basins of North Carolina.
40
This results in 56 terrain data models at 80ft spatial resolution, one for each River Sub Basin (SubBasin80) (Figure 7).
Figure 3.16 - Spatially partitioning statewide 80ft DEM by the 56 USGS Sub Basins.
41
Basin that are characterized by drainage area size for further analysis (Figure 8) (Band, 1986). The number of Sub-Catchments produced for each River Sub Basin through this computation varies, dependent upon the characteristics of size (area) and relief (slope) of the input SubBasin80 DEM.
Figure 3.17 - Terrain-derived River Sub Basin catchments (Sub-Catchments).
42
and analysis. Each of these resulting Sub-Catchments represents a spatial boundary at the computationally efficient and feasible scale necessary for the detailed terrain-driven hydrologic analysis at the 20ft spatial resolution.
3.2.1.2 Reservoir Catchment Terrain Data
43
Figure 3.18: Sub-Catchment boundary used to create 20ft terrain dataset (SubCatchment20).
3.2.2 Reservoir Modeling
44
45
Figure 3.19 - NCResSys Reservoir Modeling Terrain Analysis Processing Algorithm
3.2.2.1 Stream Network Derivation
46
the dataset, it is now performed on the finer-grained 20ft terrain dataset (SubCatchment20). This recursion of terrain-based hydrologic analysis at varying spatial scales and spatial resolutions allows for the computationally efficient and accurate solution for modeling reservoir potential at the statewide scale. The pertinent output of this computational terrain analysis is the derivation of a stream network (Sub-Catchment Stream), as well as outflow point for the Sub-Catchment area (Ocallaghan & Mark, 1984; Tarboton, Bras, & Rodriguez-Iturbe, 1991).
3.2.2.2 Stream Network Analysis – Dam Locating
47
data set. The number of potential dam locations on a stream network is highly dependent on the terrain of the given area and the characteristics of size (area) and relief (slope) in the given Sub-Catchment.
Figure 3.20 - Terrain-derived stream network (Sub-Catchment Stream) and Dam Locations every 1 mile along Stream
3.2.2.3 Iterative Reservoir Inundation
48
49
Figure 3.21 - Reservoir inundation modeling at 1 Dam Location, varying Heights from 25ft to 150ft.
The results of this computational processing is a robust reservoir modeling algorithm that provides the ability to vary the scenarios of dam location and height, while utilizing highly accurate terrain datasets to determine the physical capacity and spatial implications of the potential reservoir site.
50
given dam location. Through the analysis of terrain over multiple spatial scales,
NCResSys provides the ability to model individual reservoir locations. The extensive
computational processing required to analyze the necessary terrain-derived hydrologic parameters at the statewide scale is detailed, including the recursive algorithm that was implemented to balance the computational efficiency and feasibility with data density and accuracy. The resulting solution allows the spatial modeling and analysis of potential reservoir locations throughout the State of North Carolina.
3.3 Hydrologic Analysis
51
terrain analysis component and thus interacts through computational interfaces and relationships.
3.3.1 Safe Yield Analysis
52
(“level of development”). This yield characteristic for a given stream reach is computed as a calculation dependent on the historical daily stream records for inflow, the modeled capacity of impoundment volume (“level of development”), and the failure frequency probability (“safe yield”) given a withdrawal rate (Figure 13).
Figure 3.22 - Safe Yield Analysis Calculation (Moreau, 2009)
53
Figure 3.23 - Hydrologic Analysis Safe Yield Calculations (Moreau, 2009)
3.3.2 Spatial Interpolation of Safe Yield
This hydrologic analysis provides an estimate of a safe yield characteristic for a subset of the stream flow gauges throughout the State of North Carolina. The computations provide a finely grained spatially explicit model of a safe yield characteristic for a given location. For the NCResSys, a more generalized, continuous safe yield surface is required to return the characteristic for any location throughout the State of North Carolina. To achieve this statewide coverage of the above safe yield calculations, a spatial interpolation routine has been computed. This continuous yield surface was created by utilizing various spatial interpolation approaches from deterministic inverse-distance weighting (IDW) to geo-statistical Kriging. (De Smith, Goodchild, & Longley, 2007).
Deterministic spatial interpolation IDW computes a continuous surface from discrete points in which there is a distance decay of the observed values by the distance it is from the target point raised to a power coefficient. IDW generated yield
Level of Development as Percent of Mean Annual Volume
Gage No. Name Lat Long D.A. # Yrs Avg Q 2 4 6 8 10 12 14 16 18 20 22 24 26 28 30 32 34 36 38 40
2053200 POTECASI CREEK NEAR UNION, NC36.37083 -77.0256 225 51 0.910 20-Yr 7.14 11.16 15.05 19.08 22.96 26.63 29.63 32.49 35.49 38.35 41.21 44.08 46.74 49.38 52.01 54.65 57.29 59.95 62.48 65.00 30-Yr 6.63 10.23 13.68 17.13 20.58 23.75 26.60 29.53 32.45 35.38 38.30 41.15 43.55 46.13 48.63 51.20 53.78 56.18 58.50 60.90 40-Yr 6.09 9.48 12.51 15.53 18.56 21.63 24.26 27.08 29.90 32.72 35.54 38.18 40.79 43.47 45.97 48.65 51.33 53.94 56.38 58.99 50-Yr 5.78 9.04 11.81 14.58 17.35 20.35 22.86 25.62 28.37 31.13 33.88 36.39 39.13 41.88 44.38 47.12 49.87 52.61 55.10 57.84
2053500 AHOSKIE CREEK AT AHOSKIE, NC36.28028 -76.9994 63.3 55 0.890 20-Yr 8.88 14.94 18.56 22.69 26.69 29.50 32.44 35.38 38.19 40.94 43.50 46.25 48.94 51.69 54.38 56.94 59.44 61.94 64.69 67.19 30-Yr 8.29 13.13 17.92 22.38 26.17 29.17 31.96 34.71 37.67 40.38 43.13 45.88 48.38 51.04 53.54 56.21 58.71 61.21 63.88 66.33 40-Yr 7.72 12.78 17.69 22.03 25.25 28.25 31.16 33.91 36.75 39.34 42.09 44.84 47.34 49.78 52.28 54.72 57.22 59.72 62.16 64.50 50-Yr 7.38 12.58 17.55 21.83 24.70 27.70 30.68 33.43 36.20 38.73 41.48 44.23 46.73 49.03 51.53 53.83 56.33 58.83 61.13 63.40
2068500 DAN RIVER NEAR FRANCISCO, NC36.515 -80.3031 129 78 1.427 20-Yr 41.43 47.93 52.18 55.90 58.95 62.90 66.88 69.70 72.70 75.63 78.80 81.53 84.05 86.58 89.08 91.60 93.90 96.43 98.93 0.00 30-Yr 39.45 45.65 50.40 54.40 58.40 62.00 65.45 68.75 71.75 74.20 76.80 79.40 82.05 84.70 87.10 89.75 92.40 94.95 97.35 39.40 40-Yr 37.38 43.14 48.63 53.35 58.04 61.75 64.74 67.74 70.74 73.48 76.21 78.96 81.46 83.96 86.21 88.71 91.20 93.45 95.71 98.20 50-Yr 36.40 42.26 47.65 52.18 56.38 59.80 62.69 65.69 68.69 71.33 73.97 76.72 79.22 81.72 83.97 86.47 88.86 91.11 93.47 95.86
54
surfaces were calculated based on the discrete gauge stations “safe yield” and “level of development” values, with a power coefficient of 0.75. This produces a set of safe yield IDW interpolated surfaces corresponding to failure probability and level of development, for example a surface of 20 year safe yield at 2% development (Figure 15)
Figure 3.24 - Safe Yield IDW Interpolated Surface - 20 year safe yield at 2% development
55
stations “safe yield” and “level of development” values were used to construct a continuous yield surface based on the Kriging approach.
Figure 3.25 - Safe Yield Kriging Interpolated Surface - 20 year safe yield at 2% development
56
3.4 Socioeconomic Impact Analysis
The development of the processing component for performing spatial analysis against a range of thematic socio-economic data is driven from the logical data model described in Chapter 2. The NCResSys contains a system-level component for identifying the relationship between the development of a potential reservoir location and a range of socio-economic conditions in a spatially explicit manner. A computational component for characterizing and quantifying the impact of a modeled reservoir location provides the ability to perform impact analysis against a dynamic range of socio-economic data sets, such as administrative boundaries, transportation and communication networks, urban and parklands, pollution zones, as well as population and demographics. Along with the computational processing impact analysis, broader scale analysis of the spatial relationships between the different logical data components is conducted, for example, population density by terrain-based hydrologic sub-catchments at the statewide scale. This multi-scale spatial analysis serves as an interface between the different system-level components of the NCResSys.
57
reservoir inundation zone area (polygon) to quantify point level data, such as waste water discharge sites (point in polygon), line level data, such as roads mileage (line in polygon), and areal level data, such as urban acreage (polygon in polygon) (De Smith, Goodchild, & Longley, 2007). These spatial analytical techniques provide the interface between the system and logical data components of the NCResSys, thus providing the ability to model potential reservoir development in a spatially explicit manner.
3.5 Conclusions
58
CHAPTER 4: RESULTS & CONSIDERATIONS
The output generated from the design and development of the NCResSys
consists of physical compiled software components and the analytical capabilities for potential reservoir siting in North Carolina. To showcase these generated results this chapter highlight the physical software components that have been developed in the
NCResSys. A reference implementation details the capabilities of how the
NCResSys is utilized for performing statewide analysis of potential municipal water
supply locations. The combination of the software components explained in Chapter 3 and the logical data model described in Chapter 2 produces a powerful geospatial modeling information system for the identification of potential municipal water supply reservoir locations across the State of North Carolina. These results are described here.
4.1 Software Components
The design and development of the NCResSys has produced a suite of physical software components, ranging from data to compiled code. The logical data model designed per the OOAD methodology has produced a physical database model that is composed of raster, vector, and tabular data sets representing terrain, hydrology, and socio-economic components. The software components of the
NCResSys consist of compiled code written in the Python language. This code is
59
the different components, such as Sub-Catchment, Dam, and Reservoir objects in the terrain analysis processing. Python code has been developed according to the suite of UML processing flow diagrams previously presented that implement algorithms for recursively deriving Sub-Catchments for modeling Reservoir development, described in Chapter 3. In total, the NCResSys information system results in over 5,000 lines of custom code developed in Python to perform the multi-scale spatial analysis needed to identify and model potential reservoir locations in a comprehensive, extendable, and data-driven manner.
4.2 Reservoir Candidate Location Analysis – Specific Implementation
To highlight the analytical capabilities of the developed software components described above, a reference implementation of the NCResSys has been conducted. This is a potential case study that showcases the power of this work for water resource management. This specific implementation performs a statewide analysis of potential reservoir locations using a set of areas deemed “off-limits” to potential reservoir development compared with population rates across North Carolina. By combining a specific thematic analysis, given a set of dynamic socio-economic conditions (off-limits & population) with the hydrologic and terrain analysis engines, the NCResSys provides coarse scale filtering with fine scale reservoir modeling capabilities. This system helps to inform water resource management.
4.2.1 Statewide Thematic Analysis
60
and “off-limit” areas. In this implementation, “off-limit” areas consist of US National Parks, North Carolina State Parks, developed urban areas, and wastewater discharge pollution sites. This Parks, People, Pollution (“PPP”) criteria for this reference implementation is dynamic and can be altered to include other types of locations. Performing spatial analysis on data sets representing parklands, urban areas, and pollution locations, creates a binary spatial designation of either “off-limits” or “available.” Any area that is “PPP” is deemed “off-“off-limits” (Figure 4.1).
Figure 4.26 - NCResSys Reference Implementation – “PPP Off-limits”
Sub-61
Catchments not in “off-limit” areas). This significantly reduces the available areas for subsequent analysis, given these “off-limit” criteria, for reservoir modeling. The coarse statewide scale analysis provides the first level of screening potential locations, given the dynamic socio-economic conditions under analysis.
Figure 4.27 - NCResSys Reference Implementation - Available Sub-Catchments
Sub-62
Catchment areas identified above (through the terrain analysis component of
NCResSys) further refines the areas for potential reservoir modeling based on
dynamic socio-economic conditions (See Figure 4.3). This statewide analysis combines the three logical information categories (i.e., terrain, hydrology, socio-economic) of the NCResSys, thus facilitating a comprehensive water resource management information system.
Figure 4.28 – Dynamic Socio-Economic statewide analysis of Potential Reservoir locations
63
important to the quality of the water source for the reservoir location. The LULC of the surrounding upstream catchment areas can be identified as a layer for a specific analytic implementation. For example, Sub-Catchment areas that contain higher percentages of urban land cover types could potentially produce reservoirs with poorer water quality due to the runoff associated with impervious surface. The spatial context of the reservoir location extends to the contributing areas of the potential reservoir location. Identifying the LULC of the Sub-Catchment area assists in the decision making process for locating new reservoir locations.
The statewide analysis on dynamic socio-economic conditions, informed by hydrologic and terrain processing components, allows for deeper fine-scaled reservoir modeling and analysis on the physical characteristics of a reservoir given a specific location and dam configuration. This fine-scaled analysis component of the
NCResSys extends the water resource management capabilities.
4.2.2 Reservoir Modeling
64
Figure 29.4 - NCResSys - Reservoir Modeling Output - Dam Locations & Dam Heights
65
Figure 4.30 - NCResSys - Terrain, Hydro, Socio-Economic Analysis Output
4.3 Conclusions
66
68
CHAPTER 5: FUTURE DIRECTION & CONCLUSION
The primary objective of this research is the development of a comprehensive, geospatial information system utilizing digital spatial datasets and technologies for the purpose of modeling potential municipal water supply reservoir sites across the State of North Carolina. To achieve this primary goal, a computational information system, NCResSys, has been designed by applying principles of software engineering, hydrology, and computational geography to conduct hydrologic and terrain analysis across the State in a spatially-explicit, Geographic Information System (GIS) environment. Software engineering principles provide the framework for designing and developing the NCResSys as an extensible, object-oriented, component-based, data-driven computational solution for modeling potential water supply reservoirs at multiple spatial and thematic scales. This type of comprehensive software solution can provide rich data analysis for water resource management and planning.
5.1 Review
69
management in North Carolina. The analytical problem solving framework and data components are also introduced in this Chapter. Chapter 2 discusses in detail the logical data model that drives the system-level design of the NCResSys solution. In this Chapter the physical data sets are described in terms of their data source, attributes, logical domain, and other metadata characteristics. Chapter 3 provides extensive description on the System Architecture and Technical Design of this application. The design and implementation of the computational algorithms for performing the multi-scale Terrain Analysis capabilities of the NCResSys are discussed. A reference implementation of the NCResSys dealing with parks, pollution, and people showcases the analytical capacity and outputs of this work in Chapter 4. Here, in Chapter 5 the document is reviewed, future directions are mentioned, and the project is concluded.
5.2 Future Direction
NCResSys in its current implementation is a comprehensive geospatial
70
Specifically the selection of criteria for constructing ‘off-limit’ areas for reservoir development could be designed as an additional component and extension of the system components described in this thesis. This would provide a level of customization, according to the stakeholder interests, for the statewide and local scale analysis of potential reservoir development locations. For example, an environmental group such as Trout Unlimited may want to consider specific areas as “off-limits” or identify the impact of reservoir development on specific stream reaches. Providing a web-based tool for interactively selecting a dam location and configuration will help to maximize the utility of the computational modeling engine developed in this research work. Empowering end-users to dynamically model reservoir locations through clicking a web mapping application to configure dam properties would provide an effective tool for identifying and quantifying the impact of reservoir development across a range of planning scenarios. The modular architecture and technical design of the NCResSys allows for interfaces to be developed for a range of interactive mapping applications. Analysis and research across a range of thematic conditions can utilize the processing power and capabilities of the NCResSys for identifying potential reservoir impact across the state.
5.3 Conclusion
71
72
REFERENCES
Baltsavias, E. (1999). Airborne laser scanning: Basic relations and formulas. Isprs Journal of Photogrammetry and Remote Sensing, 54(2-3), 199-214. doi: 10.1016/S0924-2716(99)00015-5
Band, L. (1986). Topographic partition of watersheds with digital elevation models. Water Resources Research, 22(1), 15-24. doi: 10.1029/WR022i001p00015
Band, L., Patterson, P., Nemani, R., & Running, S. (1993). Forest ecosystem processes at the watershed scale - incorporating hillslope hydrology. Agricultural and Forest Meteorology, 63(1-2), 93-126. doi: 10.1016/0168-1923(93)90024-C
Booch, G., Maksimchuk, R. A., Engle, M. W., Young, B. J., Connallen, J., & Houston, K. A. (2008). Object-oriented analysis and design with applications. ACM SIGSOFT Software Engineering Notes, 33(5), 11.
Campbell, J. B. (2002). Introduction to remote sensing Guilford Press.
Chairat, S., & Delleur, J. (1993). Effects of the topographic index distribution on predicted runoff using grass. Water Resources Bulletin, 29(6), 1029-1034.
De Smith, M. J., Goodchild, M. F., & Longley, P. (2007). Geospatial analysis: A comprehensive guide to principles, techniques and software tools Troubador Pub.
Dobing, B., & Parsons, J. (2005). Current practices in the use of UML. Perspectives in Conceptual Modeling, 3770, 2-11.
ESRI. (2012). Fundamentals about lidar - ArcGIS help 10.1
Goodchild, M. Haining, R., Wise, S., Arbia, G., Anselin, L., Bossard, E., .Openshaw, S. (1992). Integrating gis and spatial data-analysis - problems and possibilities.
International Journal of Geographical Information Systems, 6(5), 407-423. doi: 10.1080/02693799208901923
Grass Development Team. (2008). GRASS GIS 6.4.3svn reference manual
Guo Xian-chun, Luo Ding-gui, Zou Shi-lin, Li Da-jun, & Zheng Wan-qing. (2009). Developing the 3D flood model visualization system based on the ArcEngine. Paper presented at the Computer Science and Information Engineering, 2009 WRI World Congress On, , 5 352-356.
Hengl, T., & Reuter, H. I. (2008). Geomorphometry: Concepts, software, applications
73
Herring, J. (1992). Tigris - a data model for an object-oriented geographic information-system. Computers & Geosciences, 18(4), 443-452. doi: 10.1016/0098-3004(92)90074-2 Hopkinson, C., Hayashi, M., & Peddle, D. (2009). Comparing alpine watershed attributes from LiDAR, photogrammetric, and contour-based digital elevation models.
Hydrological Processes, 23(3), 451-463. doi: 10.1002/hyp.7155
Hornberger, G. M., Raffensperger, J. P., Wiberg, P. L., & Eshleman, K. N. (1998). Elements of physical hydrology Johns Hopkins University Press.
Jenson, S. (1991). Applications of hydrologic information automatically extracted from
digital elevation models. Hydrological Processes, 5(1), 31-44. doi:
10.1002/hyp.3360050104
Johnson, R. (2002). Object-oriented analysis and design - what does the research say?
Journal of Computer Information Systems, 42(3), 11-15.
Johnson, R., & Hardgrave, B. (1999). Object-oriented methods: Current practices and attitudes. Journal of Systems and Software, 48(1), 5-12. doi: 10.1016/S0164-1212(99)00041-2
Marks, K., & Bates, P. (2000). Integration of high-resolution topographic data with floodplain flow models. Hydrological Processes, 14(11-12), 2109-2122. doi: 10.1002/1099-1085(20000815/30)14:11/12<2109::AID-HYP58>3.0.CO;2-1
Milne, P., Milton, S., & Smith, J. (1993). Geographical object-oriented databases - a case-study. International Journal of Geographical Information Systems, 7(1), 39-55. doi: 10.1080/02693799308901938
Mitasova, H., Drake, T., Bernstein, D., & Harmon, R. (2004). Quantifying rapid changes in coastal topography using modern mapping techniques and geographic information system. Environmental & Engineering Geoscience, 10(1), 1-11. doi: 10.2113/10.1.1 Mitasova, H., Overton, M., & Harmon, R. (2005). Geospatial analysis of a coastal sand dune
field evolution: Jockey's ridge, north carolina. Geomorphology, 72(1-4), 204-221. doi: 10.1016/j.geomorph.2005.06.001
Mitasova, H., Overton, M. F., Recalde, J. J., Bernstein, D. J., & Freeman, C. W. (2009). Raster-based analysis of coastal terrain dynamics from multitemporal lidar data. Journal of Coastal Research, 25(2), 507-514. doi: 10.2112/07-0976.1
Moore, I., Grayson, R., & Ladson, A. (1991). Digital terrain modeling - a review of hydrological, geomorphological, and biological applications. Hydrological Processes, 5(1), 3-30. doi: 10.1002/hyp.3360050103
74 Morrissey, T. (2010a). NC res pGIS implementation
Morrissey, T. (2010b). pGIS python based GIS application framework
NC Center for Geographic Information & Analysis. (2010). NC CGIAnalysis. Retrieved, 2010, from http://www.cgia.state.nc.us/Home.aspx
Neteler, M., & Mitasova, H. (2002). Open source GIS: A GRASS GIS approach Kluwer Academic Pub.
North Carolina Drought Management Advisory Council Activities Report. (2008). North Carolina Division of Water Resources Department of Environment and Natural Resources.
Northwest Power and Conservation Council. (2012). Floods and flood control. Retrieved from http://www.nwcouncil.org/history/floods.asp
Ocallaghan, J., & Mark, D. (1984). The extraction of drainage networks from digital elevation data. Computer Vision Graphics and Image Processing, 28(3), 323-344. doi: 10.1016/S0734-189X(84)80011-0
Office of State Budget & Management. (2009). North carolina county population estimates |
NC | OSBM. Retrieved from
http://www.osbm.state.nc.us/ncosbm/facts_and_figures/socioeconomic_data/population _estimates/county_estimates.shtm
Raper, J., & Livingstone, D. (1995). Development of a geomorphological spatial model using object-oriented design. International Journal of Geographical Information Systems, 9(4), 359-383. doi: 10.1080/02693799508902044
Sangwan, R., Neill, C., Bass, M., & El Houda, Z. (2008). Integrating a software architecture-centric method into object-oriented analysis an design. Journal of Systems and Software, 81(5), 727-746. doi: 10.1016/j.jss.2007.07.031
Seaber, P., Kapinos, F., & Knapp, G. (1994). Hydrologic unit maps: US geological survey water-supply paper 2294, 63 p., 1 pl.
Shan, J., & Toth, C. K. (2008). Topographic laser ranging and scanning: Principles and processing CRC.
State of North Carolina. (2008). North carolina floodplain mapping program. Retrieved, 2008, from http://www.ncfloodmaps.com/top_about.htm
75
Tarboton, D. (1997). A new method for the determination of flow directions and upslope areas in grid digital elevation models. Water Resources Research, 33(2), 309-319. doi: 10.1029/96WR03137
Tarboton, D., Bras, R., & Rodriguez-Iturbe, I. (1991). On the extraction of channel networks
from digital elevation data. Hydrological Processes, 5(1), 81-100. doi:
10.1002/hyp.3360050107
U.S. Geological Survey. (2012a). U.S. geological survey - national hydrography dataset. Retrieved, 2010, from http://nhd.usgs.gov/index.html
U.S. Geological Survey. (2012b). USGS water data for USA . Retrieved, 2009, from http://nwis.waterdata.usgs.gov/nwis?
U.S. Geological Survey. (2012c). USGS water resource |<br />Hydrologic unit maps. Retrieved, 2008, from http://water.usgs.gov/GIS/huc.html
Wehr, A., & Lohr, U. (1999). Airborne laser scanning - an introduction and overview. Isprs Journal of Photogrammetry and Remote Sensing, 54(2-3), 68-82. doi: 10.1016/S0924-2716(99)00011-8
Woodcock, C., & Strahler, A. (1987). The factor of scale in remote-sensing. Remote Sensing of Environment, 21(3), 311-332. doi: 10.1016/0034-4257(87)90015-0
Woolard, J., & Colby, J. (2002). Spatial characterization, resolution, and volumetric change of coastal dunes using airborne LIDAR: Cape hatteras, north carolina. Geomorphology, 48(1-3), 269-287. doi: 10.1016/S0169-555X(02)00185-X
Worboys, M. (1994). Object-oriented approaches to geo-referenced information.