NON-MATERNAL INVOLVEMENT IN FEEDING AND THE DEVELOPMENT OF OBESOGENIC DIETS AMONG INFANTS AND TODDLERS
Heather M. Wasser
A dissertation submitted to the faculty of the University of North Carolina at Chapel Hill in partial fulfillment of the requirements for the degree of Doctor of Philosophy in the
Department of Nutrition of the Gillings School of Global Public Health.
Chapel Hill 2012
Approved by:
iii ABSTRACT
HEATHER M. WASSER: Non-maternal Involvement in Feeding and the Development of Obesogenic Diets among Infants and Toddlers
(Under the direction of Dr. Margaret E. Bentley)
The prevalence of overweight among infants and toddlers has increased by approximately 35% over the last 30 years. Concurrent to this rise, there was an increase in maternal employment and the use of non-maternal caregivers while the mother is working. Despite these important social changes, few studies have examined non-maternal involvement in feeding between birth and two years. Specific aims of the current research were: (1) to quantify longitudinal intakes of obesity-related foods and beverages during the period of complementary feeding; (2) to characterize the extent to which non-maternal caregivers share responsibility for feeding during the first two years of life; and, (3) to determine associations between non-maternal involvement in feeding and dietary intakes of infants and toddlers.
iv
sweets, fried potatoes) increased by 125% to 800% between six and 18 months, with the greatest increases occurring between nine and 12 months of age. Non-maternal
involvement in feeding was highly prevalent, with more than half of all households at each time point reporting the use of a non-maternal caregiver (NMC)—someone other than the mother responsible for feeding the infant ≥50% of his/her daily meals. Common NMCs were fathers, grandmothers, and licensed childcare providers. In longitudinal models, we found use of any NMC to be associated with decreased odds of breastfeeding and increased odds of infants and toddlers consuming fruit or juice. Thus, potentially obesogenic diets begin early, suggesting anticipatory guidance on healthy feeding
v
DEDICATION To my family:
John, Parker, and Clementine Harrison Jerry and Margie Wasser Jodi, Jordin, and Brittany Bingham Angie, Joe, Mia, and Julien DelaCruz
Shelli, Michael, Colton, Mason, Jackson, and Broderick Beals Paul Wasser
Megan Wasser
vi
ACKNOWLEDGEMENTS
This work was possible only through the love, support, and intellect of those in my UNC-Chapel Hill community. The person I must thank first is my advisor, Dr. Bentley, who has challenged and inspired me throughout my doctoral studies, both professionally and personally. I look forward to our continued work together and hope to always make you proud. I would also like to thank all of my committee members—Dr. Bentley, Dr. Adair, Dr. Hodges, Dr. Siega-Riz, and Dr. Thompson—for their time and thoughtful contributions throughout the dissertation process, as well as their support and encouragement during my father’s recent illness. I am also grateful to my
vii
TABLE OF CONTENTS
LIST OF TABLES ………...x
LIST OF FIGURES ………xii
LIST OF ABBREVIATIONS………xiii
I. INTRODUCTION……….1
Research Aims ………3
II. LITERATURE REVIEW ………4
Pediatric overweight has increased even among infants and toddlers ……….…………..4
Dietary factors associated with overweight and obesity emerge in infancy ……….4
Why study non-maternal caregivers? ………..6
Bronfenbrenner’s ecological systems theory: Theoretical rationale for studying non-maternal caregivers……… ………..7
What impact do we expect non-maternal caregivers to have on infant and toddler dietary intakes? ………9
Summary and significance ……….11
Tables and figures ………12
III. METHODS ………13
Dataset and study design……….13
Setting description ………..14
viii
Data collection procedures for key study variables ………15
Tables and figures ………..17
IV. OBESOGENIC DIETS BEGIN EARLY IN A COHORT OF INFANTS AND TODDLERS BORN TO LOW-INCOME, FIRST-TIME, AFRICAN-AMERICAN MOTHERS: THE INFANT CARE, FEEDING, AND RISK OF OBESITY STUDY ………19
Introduction ……….19
Methods ………..21
Results ……….24
Discussion ………...25
Conclusions ……….29
Tables and figures ………...…31
V. WHO’S FEEDING BABY? NON-MATERNAL INVOLVEMENT IN FEEDING AND ITS ASSOCIATION WITH INTAKES OF OBESITY-RELATED FOODS AMONG INFANTS AND TODDLERS ………39
Introduction ……….39
Methods ………..42
Results ……….47
Discussion ………...50
Conclusions ………57
Tables and figures ………..59
VI. SYNTHESIS ………...69
Overview of findings………...70
Limitations and strengths ………73
ix
Directions for future research ……….77
Tables and figures ………80
APPENDIX ………82
x
LIST OF TABLES
Table 1. Comparison of selected demographic and health characteristics between general national population, national WIC population,
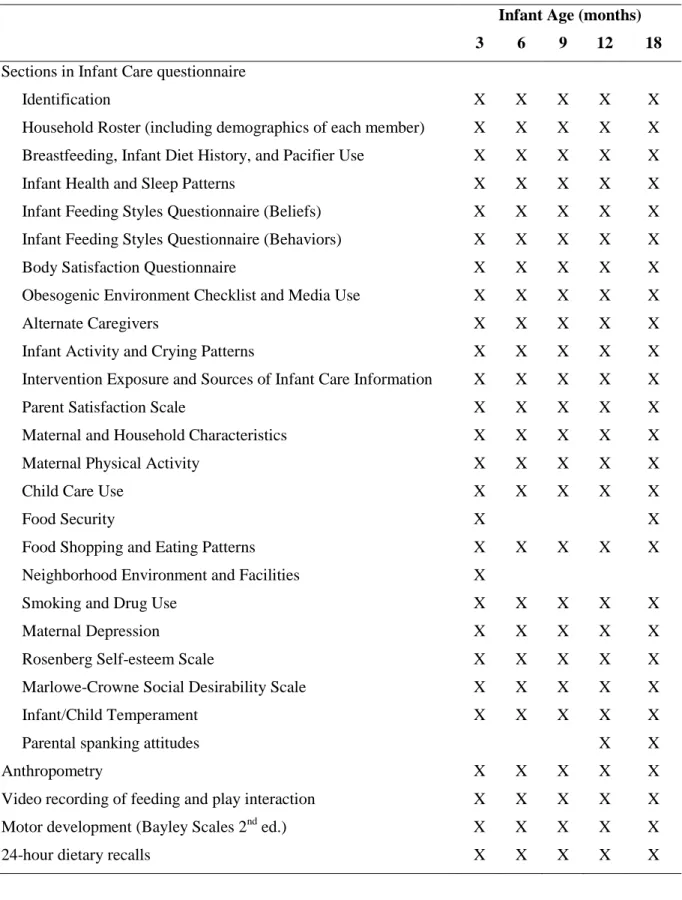
and North Carolina WIC population. ………...17 Table 2. Description of data collected in the Infant Care, Feeding, and
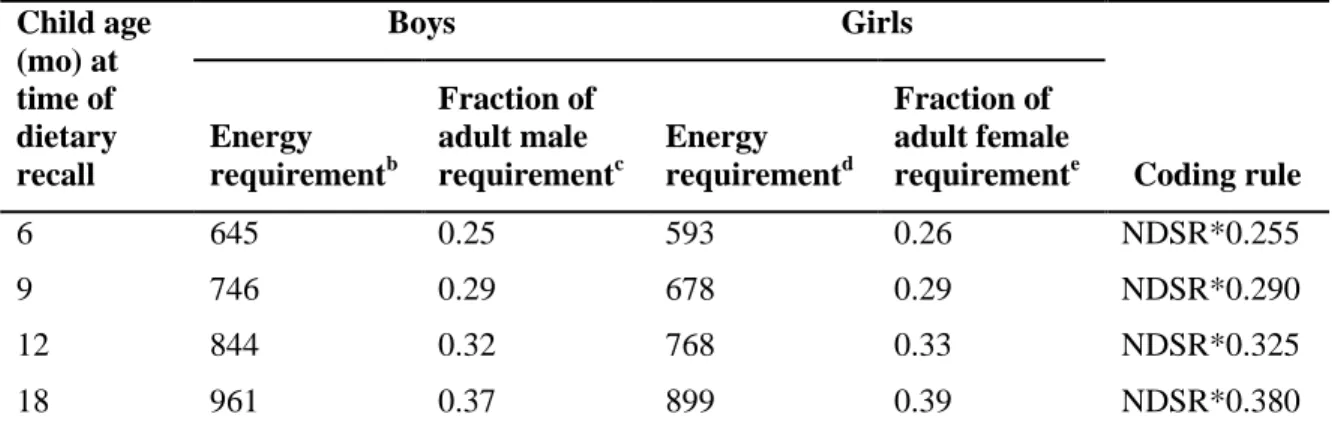
Risk of Obesity Study (Infant Care).………18 Table 3. Coding rules for converting adult-based NDSRa serving sizes
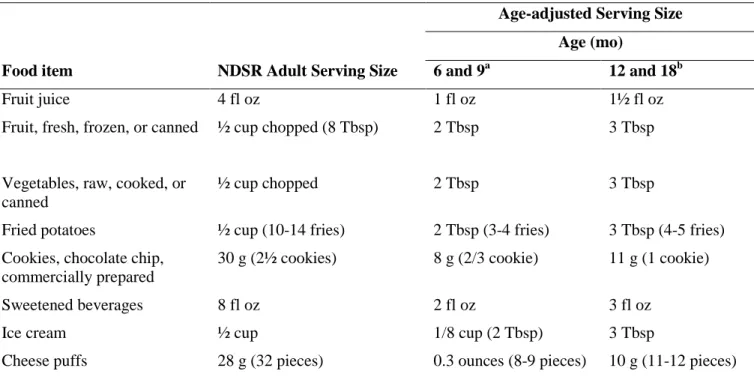
to those appropriate for infants and toddlers.………...31 Table 4. Examples of age-adjusted serving sizes for selected food items. ..…………..32 Table 5. Characteristics of mothers and infants participating in the Infant
Care, Feeding, and Risk of Obesity study...……….33 Table 6. Proportion of infants and toddlers consuming any amount of
selected foods and beverages in a day..………35 Table 7. Number of total daily servings of selected foods and beverages,
among consumers only....………...37 Table 8. Examples of age-adjusted serving sizes for selected food items.…………. ...59 Table 9. Characteristics of mothers and infants participating in the Infant
Care, Feeding, and Risk of Obesity study...……….60 Table 10. Longitudinal associations between maternal and household
characteristics and use of non-maternal caregivers (NMCs),
by any NMC and type of NMC.………...64 Table 11. Results of logistic regression models examining associations
between use of non-maternal caregivers (NMCs) and infant and
young child feeding practices...………....65 Table 12. Results of logistic regression models examining associations
between use of non-maternal caregivers (NMCs) and infant and
young child feeding practices...………66 Table 13. Results of longitudinal tobit models examining associations
between use of non-maternal caregivers (NMCs) and infant and
xi
Table 14. Results of longitudinal tobit models examining associations between use of non-maternal caregivers (NMCs) and infant and
toddler dietary intakes (n=173). ………...68 Table 15. Sections of the Infant Care questionnaire, by versions
xii
LIST OF FIGURES
Figure 1. Illustration of Urie Bronfenbrenner’s Ecological Systems
Theory. Adapted from Berk (2006). ………12 Figure 2. Use of non-maternal caregivers (NMCs), by infant age. ………...63 Figure 3. “Ecological model of predictors of childhood overweight”
xiii
LIST OF ABBREVIATIONS
24-hour DR 24-hour dietary recall BMI Body mass index
CACFP Child and Adult Care Food Program DGAs Dietary Guidelines for Americans DRI Dietary Reference Intake
EST Ecological Systems Theory
FITS Feeding Infants and Toddlers Study NDSR Nutrition Data System for Research NMC Non-maternal caregiver
US United States
WLZ Weight-for-length z-score
CHAPTER I INTRODUCTION
The prevalence of overweight among infants and toddlers has increased by approximately 35% over the last 30 years (Ogden, Flegal, Carroll, & Johnson, 2002; Ogden, Carroll, Kit, & Flegal, 2012). Concurrent to this rise, there has been an increase in maternal employment and the use of non-maternal caregivers, such as relatives and licensed childcare providers, while the mother is working (Anderson & Butcher, 2006; Mulligan, Brimhall, West, & Chapman, 2005). Yet, despite these important social changes, we find few studies have examined the extent of non-maternal involvement in feeding infants and toddlers and the impact of this involvement on the intakes of obesity-related foods and beverages.
2
grandmothers, and licensed childcare providers are influential to mothers’ decisions and abilities to initiate and continue breastfeeding(Britton, McCormick, Renfrew, Wade, & King, 2007; Gill, Reifsnider, & Lucke, 2007; Kim & Peterson, 2008; Lavender et al., 2005; Perez-Escamilla, Cobas, Balcazar, & Holland Benin, 1999; Pisacane, Continisio, Aldinucci, D'Amora, & Continisio, 2005; Rempel, 2004; Scott, Binns, Oddy, & Graham, 2006; Wolfberg et al., 2004), it seems imperative to also understand their influence on feeding decisions related to the quality of the complementary diet. This information would have important implications for determining whether to include non-maternal caregivers as additional targets in future interventions. To address this gap, the aims in the current proposal seek to establish the extent to which a variety of non-maternal caregivers are involved in feeding during the first two years of life and to determine the impact that their involvement has on the intake of complementary foods associated with the development of overweight.
To achieve these aims, we use data from the Infant Care, Feeding and Risk of Obesity Study (Infant Care), a prospective cohort of 217 African-American, first-time mothers aged 18 to 35 years recruited through the North Carolina Supplemental Nutrition Program for Women, Infants and Children (WIC)(M. Slining, Adair, Goldman, Borja, & Bentley, 2010; M. M. Slining, Adair, Goldman, Borja, & Bentley, 2009; A. L. Thompson et al., 2009; Wasser et al., 2011). Data were collected during in-home visits when the infant was approximately 3, 6, 9, 12, and 18 months old. Infant Care defined
3 Specific aims are:
Aim1. To quantify dietary intakes during the period of complementary feeding of food groups associated, either positively or negatively, with obesity among older children and adults. Food groups and items include low energy-dense foods (whole fruits and whole vegetables) and high-energy dense foods (100% juice, fried potatoes, desserts and sweets, sweetened beverages, and salty snacks).
Aim 2. To describe the extent to which NMCs are involved in feeding during the first two years of life and to identify the types of NMCs used at each time point.
Aim 3. To test for associations between use of NMCs and intakes of obesity-related foods during the period of complementary feeding.
Hypotheses. The effect of non-maternal involvement in feeding will vary according to the type of NMC involved. Father/male partner involvement will be associated with a decrease in the intake of fruits and vegetables and an increase in the intake of energy-dense snack foods. An increase in grandparent involvement will be associated with an increase in the intake of fruits and vegetables and a decrease in the intake of energy-dense snack foods. There will be no differences in intake by
4 CHAPTER II LITERATURE REVIEW
Pediatric overweight has increased even among infants and toddlers
The prevalence of overweight among United States (US) infants and toddlers has increased by approximately 35% in the past 30 years (Ogden, Flegal, Carroll, & Johnson, 2002; Ogden et al., 2012a). This increasing prevalence and disparity in overweight is concerning in light of research suggesting obesity has an intractable nature, with both large infant size and rapid postnatal growth being associated with subsequent child and adult overweight, hypertension, stroke, cardiovascular disease, and Type 2 diabetes (N. Cameron, Pettifor, De Wet, & Norris, 2003; Garn, 1985; Ong, Emmett, Noble, Ness, Dunger, & ALSPAC Study Team, 2006; Ong et al., 2009; Serdula et al., 1993)
Dietary factors associated with overweight and obesity emerge in infancy
5
Owen et al., 2005; Singhal & Lanigan, 2007) and timing of the introduction of
complementary foods (CF) (Baker, Michaelsen, Rasmussen, & Sorensen, 2004; Kramer et al., 1985; Ong, Emmett, Noble, Ness, Dunger, & Team, 2006)], as well as those applicable across life stages (Hill, 1998; Swinburn, Caterson, Seidell, & James, 2004). This latter category of factors includes recommendations to predominately consume foods and beverages low in energy density (i.e., those high in fiber and low in fat and sugar), such as whole fruit and vegetables; and, conversely, recommendations to limit those high in energy density, such as fruit juices, sweetened beverages, fried potatoes, desserts and sweets, and salty snacks (Swinburn, Caterson, Seidell, & James, 2004).
While many studies have examined determinants of breastfeeding and
6
increasing to 80.6% of toddlers consuming such foods at 21-23.9 months (Siega-Riz et al., 2010).
Why study non-maternal caregivers?
Concurrent to the increase in childhood overweight seen over the last thirty plus years, there have been dramatic shifts in both maternal employment and family
structures(Bianchi & Casper, 2000). Between 1970 and 2000, the rate of mothers in the labor force, either employed or looking for work, increased from 38% to 68%. This rise was even more dramatic, from 24% to 57%, among mothers with children under the age of three (Bianchi & Casper, 2000; Ehrle, Adams, & Tout, 2001). In addition to changes in maternal employment, the latter quarter of the 20th century witnessed several trends regarding family structure, including a decline in married couple households with a concurrent increase in same-sex cohabitation and single-parent families (Bianchi & Casper, 2000). When examined by race, the patterns of change in family structure and parental employment are quite different. The most striking difference is the substantially higher proportion of single-mother households among African-Americans versus whites, particularly those in which the mother is employed (Casper & Bianchi, 2002).
These changes in family structure and maternal employment have had
7
years of employed mothers spend an average of 25 hours per week in non-parental care (Ehrle et al., 2001; Mulligan et al., 2005). Despite these trends, we know very little about the type of individuals responsible for feeding infants and toddlers while the mother is working and how the use of these types of persons might change during the child’s first two years.
Importantly, the types of caregivers utilized while mothers are working vary by select maternal and household demographics (Ehrle et al., 2001; Mulligan et al., 2005), namely maternal employment, maternal education, and single-parent headed households. Several of these are the same characteristics associated with dietary intakes among the FITS sample. In FITS, higher maternal age, higher levels of maternal education, being married, not being enrolled in WIC, and having ever breastfed were generally associated with a higher prevalence of children consuming fruits and vegetables, but a lower prevalence of children consuming salty snacks, sweetened beverages, or desserts and candy (Hendricks, Briefel, Novak, & Ziegler, 2006). These characteristics are therefore important confounding factors to consider in analyses examining the effect of non-maternal involvement in feeding on infant diet.
Bronfenbrenner’s ecological systems theory: Theoretical rationale for studying non-maternal caregivers
8
development (Berk, 2006)(Figure 2) and public health ((Sallis, Owen, & Fisher, 2008)). According to EST, a child’s development is influenced by a system of relationships that form his or her environment. The environment in EST consists of four principle layers of nested systems, including the microsystem, the layer closest to the child and which contains the structures with which the child has direct contact (e.g. parental and non-parental caregivers); the mesosystem, a layer comprising connections between the structures in the child’s microsystem (e.g., communication between parental and non-parental caregivers); the exosystem, the layer encompassing influences from the larger social system in which the child does not function directly, but that impact the child’s development through some structure in his or her microsystem (e.g., flexible workplace policies); and the macrosystem, the outermost layer comprised of cultural values, customs, and laws (e.g. family medical leave laws).
Davison and Birch (2001) previously applied EST to the study of childhood obesity, using EST as the basis for a conceptual framework describing predictors of early obesity and opportunities for prevention (Davison & Birch, 2001). Despite this study’s publication ten years ago, we still know very little about the predictors of obesogenic diets among infants and toddlers. The few studies in this area that do exist have
9
What impact do we expect non-maternal caregivers to have on infant and toddler dietary intakes?
Hypotheses about the influence caregivers may have on the quality of the infant/toddler diet are difficult to make due to the lack of data. For fathers or male partners, there is evidence to suggest their influence will be negative. Among preschool-aged children, Hendy and colleagues (2009) found that fathers were less likely than mothers to place daily limits on snacks, to insure fruit and vegetable availability, or to use reduced fat cooking methods (Hendy, Williams, Camise, Eckman, & Hedemann, 2009). Fathers were also more likely to insist children eat food, and less likely to use positive persuasion during feeding. In a series of focus groups conducted among fathers identified as being significant caregivers of their preschool-aged children, a common theme was that fathers were not accustomed to thinking about nutrition and food, with a common sentiment being, “I just eat” (Gemlo et al., 1998; Gemlo, Keenan, Ruffing, & Sweet D., 1998). Indeed, this is reflected in national data showing men are less likely than women to consider nutrition as very important when shopping for food (69.8% vs. 55.2%: OR=0.54, 95% CI: 0.46-0.64) (Bowman, 2005). Men are also less likely than women to consume at least two servings of fruit per day (28.7% vs. 36.1%) or three or more servings of vegetables (21.4% vs. 30.9%) (Centers for Disease Control, 2010).
10
those 65 years of age and older: 41.3% vs. 30.8% and 29.0% vs. 20.1% of adults ≥65 years vs. 18-24 consume two or more servings of fruit or three or more servings of vegetables per day (Centers for Disease Control, 2010). Older adults are also more likely than younger adults to rate nutrition as very important when shopping for food: compared to adults 20-39 years of age, odds ratios for those 40-54 years and ≥55 years are 1.33 (95% CI: 1.12-1.57) and 1.97 (95% CI: 1.70-2.28), respectively (Bowman, 2005).
For childcare providers, the body of research specific to infant and toddler feeding is also very small, but the evidence suggests their role will be neutral (i.e. not
significantly better or worse than mothers). While non-parental childcare has been associated with decreased rates of breastfeeding at 3, 6, and 12 months, as well as a greater likelihood of solid feeding before 4 months (Hendricks, Briefel, Novak, &
11
Carolina is the requirement that all licensed facilities follow the meal pattern guidelines of the Child and Adult Care Food Program (CACFP) and that sweetened beverages and other foods of low nutritional value are limited (North Carolina Division of Child Development, 2010).
Summary and significance
Despite dramatic changes in maternal employment over the last several decades, there is a major gap in our understanding of the types of caregivers, other than the
12 Tables and figures
Figure 1. Illustration of Urie Bronfenbrenner’s Ecological Systems Theory. Adapted from Berk
13 CHAPTER III
METHODS
Dataset and study design
14
incomplete data, and two were dropped due to problems encountered with the respondent, rendering the data questionable.
Setting description
Infant Care participants were recruited through WIC clinics in central North Carolina. The population from which the sample was drawn was therefore quite different than the US population at large. Selected demographic and health characteristics are provided in Table 1, broken down by race where available. Key differences between the general US population and the population from which the Infant Care sample was drawn include a much higher prevalence of households below poverty, a higher proportion of overweight women prior to pregnancy, a higher prevalence of infant and toddler overweight, and a lower prevalence of ever breastfeeding. There are additional
differences by race/ethnicity even within the North Carolina WIC population: African-American women have a higher prevalence of overweight prior to pregnancy and the lowest prevalence of any breastfeeding.
Description of the Infant Care assessments
15
scale development assessment; and videotaped a feeding and play session.Table 2 contains a list of the assessments, by study visit/infant age.
Data collection procedures for key study variables
We describe here in detail the data collection procedures for the key study variables in this dissertation: infant dietary intake and use of non-maternal caregivers.
Infant dietary intake
The Nutrient Data System for Research (NDSR) (Nutrition Coordinating Center, University of Minnesota, Minneapolis, MN), the most accurate and comprehensive nutrient calculation software available for research purposes, was used to capture infant and toddler dietary intakes. A total of three 24-hour dietary recalls (24-h DRs) were collected during each observation interval to generate a valid estimate of infants’ and toddlers’ usual intakes of food groups and nutrients. The first recall was administered during the home visit, with two random, nonconsecutive, telephone recalls occurring within a two-week interval after the home visit. Study personnel were trained by an NDSR–certified staff member of the University of North Carolina at Chapel Hill Nutrition Epidemiology Core (National Institutes of Health grant DK56350).
16
and minor food groups utilized in FITS (Fox, Pac, Devaney, & Jankowski, 2004; Siega-Riz et al., 2010) (Appendix).
Non-maternal caregivers
Non-maternal caregivers (NMCs) were defined in Infant Care as those persons involved in feeding an infant or toddler 50% or more of his/her total feedings in a day. At each study visit, NMCs were identified through a series of four questions. First, the mother was asked how many times the index child was usually fed in a day. Fifty percent of this number was then calculated and mothers were asked if there was anyone, other than herself, responsible for feeding the index child that number of times (or more) in a day. If the mother affirmed use of a NMC, she was asked how the person was related to the index child.
Sample characteristics and potential confounding variables
17 Tables and figures
Table 1. Comparison of selected demographic and health characteristics between general national population, national WIC population, and North Carolina WIC population.
Nation Nation
WIC
North Carolina WIC
North Carolina WIC
White
African-American
Hispanic
Below poverty, % 15.3a 64.8b 61.1c NA NA NA
Pre-pregnancy overweight
36.3d 52.9b 56.4c 52.0c 61.2c 59.7c
Pregnancy weight gaine <Ideal >Ideal 22.7f 47.0f 21.3g 48.8g 25.8h
43.4 h
22.2 h
45.8 h
27.5 h
40.2 h
30.9 h
31.1 h
Infant and toddler obesity
9.7i 12.4b 13.6j 11.8k 12.6k 17.2k
Ever breastfed 76.9l 66.7m 62.5 m 61.7 m 50.8 m 83.0 m
a
U.S. Census Bureau, 2006-2010 American Community Survey (U.S. Census Bureau, )
b
Centers for Disease Control and Prevention, 2010 Pregnancy Nutrition Surveillance, Nation (Centers for Disease Control and Prevention, 2012)
c
Centers for Disease Control and Prevention, 2010 Pregnancy Nutrition Surveillance, North Carolina(Centers for Disease Control and Prevention, 2012)
d
Ogden CL, Carroll MD, BK Kit, and Flegal KM.Prevalence of Obesity and Trends in the Distribution of Body Mass Index Among US Adults, 1999-2010. JAMA. 2012;307(5):491-497 (Ogden et al., 2012b)
e
Based on 2009 IOM report, "Weight Gain During Pregnancy"
f
Centers for Disease Control and Prevention, 2005-2007 Infant Feeding Practices Study II (Centers for Disease Control and Prevention, 2012)
g
Centers for Disease Control and Prevention, 2006 Pregnancy Nutrition Surveillance, Nation (Centers for Disease Control and Prevention, 2012)
h
Centers for Disease Control and Prevention, 2006 Pregnancy Nutrition Surveillance, North Carolina (Centers for Disease Control and Prevention, 2012)
i
Ogden CL, Carroll MD, BK Kit, and Flegal KM.Prevalence of Obesity and Trends in Body Mass Index Among US Children and Adolescents, 1999-2010. JAMA. 2012;307(5):483-490 (Ogden et al., 2012a)
j
Centers for Disease Control and Prevention, 2010 Pediatric Nutrition Surveillance, Nation (Centers for Disease Control and Prevention, 2012)
k
Centers for Disease Control and Prevention, 2010 Pediatric Nutrition Surveillance, North Carolina (Centers for Disease Control and Prevention, 2012)
l
Centers for Disease Control and Prevention, 2012 Breastfeeding Report Card. Data is for 2009 births (Centers for Disease Control and Prevention, 2012)
m
18
Table 2. Description of data collected in the Infant Care, Feeding, and Risk of Obesity Study (Infant Care)
Infant Age (months) 3 6 9 12 18
Sections in Infant Care questionnaire
Identification X X X X X
Household Roster (including demographics of each member) X X X X X
Breastfeeding, Infant Diet History, and Pacifier Use X X X X X
Infant Health and Sleep Patterns X X X X X
Infant Feeding Styles Questionnaire (Beliefs) X X X X X
Infant Feeding Styles Questionnaire (Behaviors) X X X X X
Body Satisfaction Questionnaire X X X X X
Obesogenic Environment Checklist and Media Use X X X X X
Alternate Caregivers X X X X X
Infant Activity and Crying Patterns X X X X X
Intervention Exposure and Sources of Infant Care Information X X X X X
Parent Satisfaction Scale X X X X X
Maternal and Household Characteristics X X X X X
Maternal Physical Activity X X X X X
Child Care Use X X X X X
Food Security X X
Food Shopping and Eating Patterns X X X X X
Neighborhood Environment and Facilities X
Smoking and Drug Use X X X X X
Maternal Depression X X X X X
Rosenberg Self-esteem Scale X X X X X
Marlowe-Crowne Social Desirability Scale X X X X X
Infant/Child Temperament X X X X X
Parental spanking attitudes X X
Anthropometry X X X X X
Video recording of feeding and play interaction X X X X X
Motor development (Bayley Scales 2nd ed.) X X X X X
19 CHAPTER IV
OBESOGENIC DIETS BEGIN EARLY IN A COHORT OF INFANTS AND TODDLERS BORN TO LOW-INCOME, FIRST-TIME, AFRICAN-AMERICAN MOTHERS: THE INFANT CARE, FEEDING, AND RISK OF OBESITY STUDY
Introduction
Childhood obesity has reached even our youngest children. There has been an approximate 35% increase in the prevalence of overweight (ie, weight-for-length ≥95th percentile) among infants and toddlers over the past few decades (Ogden, Flegal, Carroll, & Johnson, 2002; Ogden et al., 2012a). Both large infant size and rapid postnatal growth are concerning due to their association with subsequent child and adult overweight (Botton et al., 2008; Chomtho et al., 2008; Mei, Grummer-Strawn, & Scanlon, 2003; Nader et al., 2006; Stettler, Zemel, Kumanyika, & Stallings, 2002; Stettler, Kumanyika, Katz, Zemel, & Stallings, 2003) and future comorbidities, such as cardiovascular disease (Law et al., 2002; Singhal, Cole, Fewtrell, Deanfield, & Lucas, 2004) and Type 2
diabetes (Bhargava et al., 2004; Forsen et al., 2000).
Research into the causes of large infant size and/or rapid growth has been steadily increasing, with a growing interest in the role of the diet during the first two years of life, particularly during the period of complementary feeding. Complementary feeding
20
representative sample of children between birth and four years of age, raises concerns about the quality of the diet during this time of transition, particularly as it relates to the prevention of obesity (Siega-Riz et al., 2010). While the data is limited among infants and toddlers (Dattilo et al., 2012), foods low in energy density, namely fruits and vegetables, have been shown to be protective against obesity among older children and adults whereas foods and beverages high in energy density, such as fried potatoes, desserts and sweets, and sweetened beverages, have been shown to increase risk of obesity (Flynn et al., 2006; Swinburn, Caterson, Seidell, & James, 2004). In the FITS sample, it is therefore troubling that by one year of age a higher proportion of toddlers consumed French fries than they did dark-green vegetables (18.5% versus 10.9%, respectively) and that approximately two-thirds were consuming a dessert or sweetened beverage daily (Siega-Riz et al., 2010).
21
of infants and toddlers consuming any amount of obesity-related foods and beverages, as well as the total daily amount of consumption. Providing this level of description in a longitudinal cohort may be important for obesity prevention as it can identify the age intervals in which very young children are exposed to these potentially obesogenic foods and beverages.
Methods
Study design and participants
Data are from the Infant Care, Feeding and Risk of Obesity Study (Infant Care), an observational cohort of mother-infant dyads from 3 to 18 months after delivery (M. Slining et al., 2010; M. M. Slining et al., 2009; A. L. Thompson et al., 2009; Wasser et al., 2011). First time African-American mothers aged 18 to 35 years were recruited through the North Carolina Supplemental Nutrition Program for Women Infants and Children and assessed during in-home visits at infant ages 3, 6, 9, 12, and 18 months. The current study uses data from visits occurring when infants and toddlers were 6 to 18 months of age. Exclusion criteria for the Infant Care Study included delivery at <35 weeks gestation or presence of any of the following conditions: Down syndrome,
22 Data collection methods and outcome measures
During each home visit, mothers completed a 24-hour dietary recall (DR). To improve estimates of usual food intakes, the Infant Care Study collected two additional 24-hour DRs, which were taken by telephone on random, nonconsecutive days within two weeks of the home visit (F. E. Thompson & Subar, 2008). The 24-hour DR was administered and analyzed using the 2005 version of the Nutrition Data System for Research (NDSR) (Nutrition Coordinating Center, University of Minnesota, Minneapolis, MN). Study personnel were trained by an NDSR–certified staff member of the University of North Carolina at Chapel Hill Nutrition Epidemiology Core.
To facilitate comparisons with national data from the Feeding Infants and
23
infant to adult energy requirements (Institute of Medicine, 2005), thereby accounting for the natural increase in food intake occurring during infancy due to increasing body size. This method of age-adjusting serving sizes has been used in cross-sectional studies among older infants and toddlers (Cox, Skinner, Carruth, Moran, & Houck, 1997; Hoerr et al., 2006), with intakes of fruit, vegetables, and dairy each significantly correlated with mean adequacy ratio (MAR) scores, an index of the average percent of the recommended intakes of several key nutrients (ρ = 0.24, 0.22, and 0.44, respectively; P<0.05) (Hoerr et al., 2006). A detailed description of the coding rules used to convert NDSR serving sizes are provided in Table 2 and examples of age-adjusted serving sizes for selected food items are provided in Table 3.
Statistical methods
At each time point, dietary variables had positively skewed distributions with heavy clustering at zero (i.e., many non-consumers of particular foods or beverages). We therefore estimated proportions of infants and toddlers consuming any amount of selected foods and beverages and, among consumers only, the median number of daily servings. Differences in baseline characteristics between completers and non-completers were also assessed at each study visit to test the effects of attrition. T-tests were used for continuous variables and chi-square or Fisher’s exact tests for categorical variables. Stata (release 12, 2012, StataCorp, College Station, TX) was used for all statistical procedures and
24 Results
Sample characteristics
Table 4 displays infant, maternal, and household characteristics by study visit. Generally, the Infant Care sample consisted of young, first-time, African-American mothers with a high prevalence of single-headed households and maternal obesity. In an examination of attrition over time, tests of baseline differences between completers and non-completers revealed few significant differences. There were slightly more mothers at 12 months with at least some college education or who were married. At 18 months, slightly more mothers were married and household size was lower.
Any intake
Table 5 contains cross-sectional data on the proportion of infants and toddlers consuming any amount of selected foods and beverages. At six months, a high percentage of infants were consuming fruit excluding juice (72%), vegetables excluding fried
25 Total daily servings
Table 6 displays the median number of total daily servings among consumers, by infant/toddler age. At all time points, daily servings of juice were greater than servings of fruit. Servings of juice also doubled over time (2.3 servings/day at six months versus 5.3 servings/day at 18 months), while servings of fruit remained stable at approximately 1.8 servings/day. Similarly, daily servings of fried potatoes were greater than dark-green vegetables at all time points with servings of fried potatoes tripling between six and 18 months (0.3 and ~1 serving/day, respectively). One of the only food groups to decline over time was the vegetable subgroup, deep-yellow vegetables, which decreased from 1.3 servings/day at six months to 0.1 servings/day at 18 months. At six months, infants were consuming an average of 1.4 servings/day of desserts and sweets excluding beverages with this increasing to 2.2 servings/day by 18 months. As with ‘any intake,’
cakes/pies/cookies/pastries were consumed in the greatest amount. Servings of sweetened beverages increased seven-fold between six and 18 months, from 0.2 to 1.5 servings/day, respectively. Fruit drinks were consumed in the greatest amount at most time points. For salty snacks, there was more than a four-fold increase between six and 18 months, increasing from 0.2 to 0.9 servings/day, respectively.
Discussion
26
on food groups that have been shown to be associated, either positively or negatively, with obesity among older children and adults (Dattilo et al., 2012; Flynn et al., 2006; Swinburn, Caterson, Seidell, & James, 2004). Our most important findings are (1) that large proportions of infants and toddlers in the Infant Care sample consumed foods and beverages that are high in energy density and potentially obesogenic; (2) that median intakes by infants and toddlers were greater for high energy-dense foods, such as juice and desserts and sweets, than for low energy-dense foods, namely fruits and vegetables; and (3) that increases in median intakes of several high energy-dense foods were greatest between the period of nine to 12 months.
As compared to the nationally representative sample in the FITS study (Siega-Riz et al., 2010), a smaller proportion of infants and toddlers in the Infant Care sample consumed any fruit in a day. Conversely, higher proportions of infants and toddlers in Infant Care versus FITS consumed high energy-dense foods, including juice, fried potatoes, desserts and sweets, and salty snacks. These findings suggest that infants and toddlers of low-income African-American mothers are a priority population for
complementary feeding interventions. Given that several studies have shown food preferences may be set as early as two years of age (Cashdan, 1994; Skinner & Carruth, 2001), interventions that improve complementary feeding practices might decrease risk of later obesity if they decrease exposure to high energy-dense foods and beverages and increase preference for those low in energy density (Dattilo et al., 2012).
27
obesity. Most prior studies have reported the proportion of infants or toddlers consuming any amount of foods or beverages in a day(Briefel et al., 2004; Fox, Pac, Devaney, & Jankowski, 2004; Kudlova & Rames, 2007; Siega-Riz et al., 2010), average portion sizes of foods and beverages consumed at a single eating occasion (Fox, Reidy, Karwe, & Ziegler, 2006), or created dietary pattern scores via principal components analysis or an index (Cox et al., 1997; Kudlova & Rames, 2007; Robinson et al., 2007). Our analyses further substantiate the emergence of potentially obesogenic consumption patterns very early in life. At most time points, infants and toddlers in our sample consumed greater quantities of high energy-dense foods, such as desserts and sweets, sweetened beverages, juice, and salty snacks, than they did of less energy-dense foods, such as fruits and vegetables. Across time, consumption of fruits and vegetables remained fairly stable at approximately 1.8 and 2 servings/day, respectively. For a subgroup of vegetables, deep-yellow vegetables, there was a substantial decrease over time, which may be due to a diminishing reliance on jarred, pureed baby foods as infants grow teeth and improve fine motor skills (Carruth, Ziegler, Gordon, & Hendricks, 2004), development factors that allow them to more easily consume foods eaten by the rest of the family. These
28
Why servings versus absolute amounts? Compared to absolute amounts, such as grams or calories, serving sizes are based on commonly used household metrics,
including cups, ounces, and tablespoons. For example, the 18-month-olds in our sample consumed an average daily amount of 5 tablespoons (Tbsp) of fruit, 7 Tbsp of vegetables excluding fried potatoes, 8 fluid ounces of juice, 4 French fries or tater tots, 2¼ chocolate chip cookies, 4½ fluid ounces of sweetened beverages, and nearly 10 grams of salty snacks, such as 11-12 cheese puffs. Contrast the interpretability of these findings to a study by Briefel, Reidy, Karwe, Jankowski, and Hendricks (2004) in which quartiles of total energy intake from table foods were calculated and then comparisons were made between the proportion of infants and toddlers consuming different types of foods and beverages, by low versus high quartile of total energy (Briefel et al., 2004). Their main findings that a higher proportion of infants and toddlers in the lowest energy quartile consumed deep yellow vegetables while higher proportions of infants and toddlers in the highest energy quartile consumed pizza, carbonated sodas, French fries, and sweets, are clearly important. Yet, they may be difficult messages for the media or public health workers to readily translate to parents and caregivers.
Perhaps most importantly, our findings call for greater attention to the period of complementary feeding. Currently, there are no Healthy People 2020 goals for
29
intervention for prevention of undernutrition in low- and middle-income country settings (Bhutta et al., 2008). Growing evidence suggests that complementary feeding practices should also play a role in the obesity prevention discourse (Dattilo et al., 2012), as foods and beverages associated with obesity among older children and adults appear to emerge in the diet during this time of transition.
There are limitations to the current study. The sample consisted of low-income, first-time, African-American mothers, and the results should only be applied to this subset of the population. While a major strength of the current study is the longitudinal design, loss to follow-up is always a concern with such studies. However, an examination of participant attrition in our sample revealed significant differences on only a few
variables, including slightly more mothers at 12 months with at least some college and more married mothers at both 12 and 18 months. Given the literature, we would expect these differences to attenuate our findings, since having a college education and being married are two factors associated with positive infant and toddler feeding practices, such as feeding fruit and avoiding sweetened beverages (Hendricks, Briefel, Novak, & Ziegler, 2006).
Conclusions
30
feeding patterns. Since high energy-dense foods are prevalent even at six months in this subpopulation, caregivers would benefit from anticipatory guidance on healthy
31 Tables and figures
Table 3. Coding rules for converting adult-based NDSRa serving sizes to those appropriate for infants and toddlers.
Child age (mo) at time of dietary recall
Boys Girls
Coding rule Energy requirementb Fraction of adult male requirementc Energy requirementd Fraction of adult female requiremente
6 645 0.25 593 0.26 NDSR*0.255
9 746 0.29 678 0.29 NDSR*0.290
12 844 0.32 768 0.33 NDSR*0.325
18 961 0.37 899 0.39 NDSR*0.380
a
Nutrition Data System for Research (NDSR) (Nutrition Coordinating Center, University of Minnesota, Minneapolis, MN)
b
Dietary reference intake (DRI) for energy for boy of corresponding age and at median weight-for-age
c
Value is 2600 calories per day, the DRI for energy for a 30-year-old male with a healthy body-mass-index (BMI) (18.5-24.9) and low active to active lifestyle
d
DRI for energy for girl of corresponding age and at median weight-for-age
e
32 Table 4. Examples of age-adjusted serving sizes for selected food items.
Food item
Age-adjusted Serving Size Age (mo)
NDSR Adult Serving
Size 6 and 9 12 and 18
Fruit juice 4 fl oz 1 fl oz 1½ fl oz
Fruit, fresh, frozen, or canned (chopped) ½ cup (8 Tbsp) 2 Tbsp 3 Tbsp
Vegetables, raw, cooked, or canned (chopped)
½ cup (8 Tbsp) 2 Tbsp 3 Tbsp
Fried potatoes ½ cup (10-14 fries) 2 Tbsp (3-4 fries) 3 Tbsp (4-5 fries)
Cookies, chocolate chip, commercially prepared
30 g (2½ cookies) 8 g (2/3 cookie) 11 g (1 cookie)
Sweetened beverages 8 fl oz 2 fl oz 3 fl oz
Ice cream ½ cup (8 Tbsp) 2 Tbsp 3 Tbsp
Cheese puffs 28 g (32 pieces) 0.3 ounces (8-9 pieces) 10 g (11-12 pieces)
33
Table 5. Characteristics of mothers and infants participating in the Infant Care, Feeding, and Risk of Obesity study.
Study Visit
3-month 6-month 9-month 12-month 18-month
meanSD/n(%)
Total (n) 217 161 165 151 129
Infant characteristics
Gestational age (weeks) 39.51.5 39.6±1.4 39.5±1.4 39.6±1.4 39.5±1.4
Birthweight (kg) 3.2±0.5 3.3±0.5 3.2±0.5 3.2±0.5 3.2±0.5
Age (months) 3.2±0.3 6.4±0.5 9.4±0.5 12.6±0.7 19.1±2
Female 116 (53.5) 85 (53.5) 85 (51.8) 80 (54.8) 68 (52.7)
Weight-for-height Z score 0.61 0.5±1.1 0.5±1.1 0.4±1.1 0.3±1.1
Infant overweighta 63 (29) 41 (25.8) 40 (24.4) 32 (21.9) 25 (19.4)
Maternal and household characteristics
Age (years) 22.73.8 22.9±3.8 23.3±4 23.7±3.9 24.3±
Maternal education
Less than highschool
Highschool graduate Any college 58 (27.1) 65 (30.4) 91 (42.5) 43 (26.7) 45 (28) 73 (45.3) 45 (27.6) 46 (28.2) 72 (44.2) 41 (27.3)
37 (24.7)**
72 (48)**
35 (27.1)
34 (26.4)
60 (46.5)
Married 21 (9.8) 17 (10.6) 19 (12.3) 16 (11.8)* 16 (15.8)**
Any maternal employment 115 (53.7) 97 (61.8) 101 (63.5) 83 (58.5) 61 (60.4)
34
Maternal obesity (BMI30) 96 (44.2) 71 (44.1) 73 (44.8) 63 (42) 55 (42.6)
Maternal depressionb 62 (29.1) 40 (27.6) 37 (23.6) 24 (17.1) 35 (34)
Household size 3.91.7 4.1±1.7 3.6±1.5 3.5±1.5 3.3±1.3**
Ever breastfed 151 (69.6) 119 (73.9) 119 (72.2) 108 (72) 94 (72.9)
a
>90th percentile 2000 CDC NCHS growth charts
bScore ≥16 on the Center for Epidemiological Studies Depression Scale
*P<0.05
**P<0.001
3
35
Table 6. Proportion of infants and toddlers consuming any amount of selected foods and beverages in a day.
Proportion Consuming at Least Once in a Day Age (mo)
Food group 6 9 12 18
mean±standard error
Total (n) 161 165 151 129
All fruit, excluding juicea 72±3.5 67.3±3.7 64.9±3.9 68.2±4.1
100% fruit juice 61.5±3.8 78.8±3.2 90.1±2.4 90.7±2.6
All vegetables 72±3.5 89.7±2.4 94±1.9 98.4±1.1
Dark-green vegetables 4.3±1.6 10.32.3 22.53.4 314.1
Deep yellow vegetables 42.9±3.9 45.53.9 51.74.1 45.74.4
White potatoes 12.42.6 34.53.7 48.34.1 454.4
Fried potatoes 5.61.8 203.1 38.44 554.4
Other starchy vegetablesb 27.33.5 35.83.7 454.1 65.94.2
Other vegetablesc 30.43.6 56.43.9 76.83.4 86.83
All desserts and sweets 30.43.6 68.53.6 86.12.8 96.11.7
Desserts and candy 25.53.4 56.43.9 62.93.9 81.43.4
Baby food desserts 10.62.4 15.82.8 6.62 0.80.8d
Cakes, pies, cookies, and pastries
14.9±2.8 43.63.9 534.1 61.24.3
36
Ice cream, frozen yogurt, pudding
5±1.7 7.32 13.22.8 30.24.1
Other dessertse 0 0.60.6d 2.61.3 6.22.1
Candy 0 4.81.7 11.32.6 26.43.9
Other sweets 7.52.1 23.63.3 44.44.1 70.54
Milk flavorings 0 0.60.6d 0 3.11.5
Sugars, syrups, preserves 7.42.1 233.3 44.44.1 70.54
Sweetened beverages 4.31.6 203.1 45.74.1 694.1
Carbonated sodas 1.91.1d 3.61.5 9.32.3 17.13.3
Fruit-flavored drinks 1.20.9d 16.42.9 39.74 65.94.2
Otherf 1.91.1d 4.21.6 61.9 10.92.7
Salty snacksg 2.51.2 7.32 23.83.5 45.74.4
a
Excludes fried fruits or fruit-based savory snacks
b
Includes starchy vegetables in mixed dishes (eg, corn, lima beans, lentils, peas)
c
Includes tomato, tomato products (eg, sauce, puree, paste) and vegetables in mixed dishes (eg, beets, cabbage, summer squash)
d
Point estimates is imprecise due to uncommon event
e
Includes gelatin desserts and pie fillings
f
Includes sweetened tea, coffee and water
g
Includes onion rings, corn chips, cheese puffs, and popcorn
37
Table 7. Number of total daily servings of selected foods and beverages, among consumers only.
Total Daily Servings Age (mo)
Food group 6 9 12 18
median±standard error
Total (n)a 161 165 151 129
All fruit, excluding juiceb 1.8±0.3 1.9±0.2 2.1±0.4 1.7±0.2
100% fruit juice 2.3±0.3 2.9±0.4 4.9± 0.4 5.3±0.5
All vegetables, excluding fried potatoes 1.8±0.2 1.7±0.1 2±0.2 2.3±0.2
Dark-green vegetables 0.1±0.3c 0.4±0.2 0.4±0.1 0.3±0.1
Deep yellow vegetables 1.3±0.1 0.9±0.2 0.2±0.1 0.1±0.0
White potatoes 0.6±0.2 0.7±0.2 0.6±0.2 0.9±0.1
Other starchy vegetablesd 0.8±0.1 0.3±0.2c 0.1±0.1 0.4±0.1
Other vegetablese 0.7±0.1 0.8±0.1 0.9±0.1 0.9±0.1
Fried potatoes 0.3±0.1 0.6±0.2 1.1±0.2 0.9±0.1
All desserts and sweets, excluding beverages 1.4±0.4 1.4±0.2 1.6±0.3 2.2±0.2
Desserts and candy 1.4±0.4 1.2±0.2 1.5±0.2 1.5±0.2
Baby food desserts 1±0.2 1.1±0.2 2±0.5 1.2±0c
Cakes, pies, cookies, and pastries 2.1±0.6 1.1±0.2 1.2±0.2 1.2±0.1
Ice cream, frozen yogurt, pudding 0.2±0.2c 0.6±0.2 0.4±0.1 0.9±0.2
38
Other dessertsf 0 1.1±0c 0.5±0.1 0.7±0.5c
Candy 0 0.3±0.3c 0.5±0.4c 0.6±0.2
Other sweets 0.1±0.1c 0.3±0.1 0.3±0.1 0.5±0.1
Milk flavorings 0 2.2±0c 0 0.6±0.3
Sugar, syrup, preserves 0.1±0.1c 0.3±0.1 0.3±0.1 0.5±0.1
Sweetened beverages 0.2±0.2c 0.7±0.2 1.2±0.2 1.5±0.2
Carbonated sodas 0.2±0.2c 0.5±0.1 0.5±0.1 0.7±0.2
Fruit-flavored drinks 0.3±0.1 0.7±0.2 1.1±0.2 1.1±0.2
Otherg 0.3±0.3c 0.3±0.2c 0.8±0.4c 0.5±0.3c
Salty snacksh 0.2±0.1 0.1±0 0.6±0.1 0.9±0
a
Size of total sample at study visit.
b
Excludes fried fruits or fruit-based savory snacks
c
Point estimate is imprecise due to uncommon event
d
Includes starchy vegetables in mixed dishes (eg, corn, lima beans, lentils, peas)
e
Includes tomato, tomato products (eg, sauce, puree, paste) and vegetables in mixed dishes (eg, beets, cabbage, summer squash)
f
Includes gelatin desserts and pie fillings
g
Includes sweetened tea, coffee and water
h
Includes potato chips, onion rings, corn chips, cheese puffs, and popcorn
39 CHAPTER V
WHO’S FEEDING BABY? NON-MATERNAL INVOLVEMENT IN FEEDING AND ITS ASSOCIATION WITH INTAKES OF OBESITY-RELATED FOODS AMONG
INFANTS AND TODDLERS
Introduction
It is well documented that the prevalence of obesity among children and adolescents ages two to 19 years has more than tripled since 1980 (Ogden & Carroll, 2010). Among infants and toddlers, the increase has been smaller, yet still substantial—in 2010 compared to 1976-1980, 35% more children less than two years had a high weight-for-length z-score (WLZ) (WLZ ≥95th percentile) (Ogden, Flegal, Carroll, & Johnson, 2002; Ogden et al., 2012a). In light of these trends, obesity prevention has begun earlier in life, with a growing number of interventions targeting risk factors during the first two years(Ciampa et al., 2010).
There are several dietary factors occurring during infancy which may have protective effects against later obesity. Several meta-analyses have reported similar findings that breastfeeding confers a small, protective effect against obesity or
40
with a four percent decrease in the risk of overweight (95% CI: 0.94, 0.98) (Harder, Bergmann, Kallischnigg, & Plagemann, 2005).
Several factors during the period of complementary feeding may also play a role in obesity prevention. Complementary feeding is the transitional process between exclusive milk feeding in which nutritive foods and beverages other than breast milk or infant formula are gradually introduced. Both the American Academy of Pediatrics and the World Health Organization recommend that complementary feeding begin at six months, after a period of exclusive breastfeeding (American Academy of Pediatrics Committee on Nutrition, 2009; World Health Organization, 2003). However, many infants are fed complementary foods before this time (Grummer-Strawn, Scanlon, & Fein, 2008; Wasser et al., 2011), some as early as seven to 10 days postpartum (Bronner et al., 1999). In a recent systematic review, Moorcroft, Marshall and McCormick (2011) reported no clear association between the age of introduction of complementary foods and obesity (Moorcroft, Marshall, & McCormick, 2011). However, studies were highly heterogeneous in terms of the exposure (early introduction to complementary foods) and the outcome (infant and child obesity) preventing the conduct of a meta-analysis and the ability to make robust conclusions.
41
to show that approximately 25% of infants and toddlers fail to consume any amount of whole fruit and 30% consume no whole vegetables on a given day. In contrast, nearly 20% of infants, ages six to 8.9 months, consume a dessert or sweet in a day, with the proportion increasing to 80.6% of toddlers consuming such foods at 21-23.9 months (Siega-Riz et al., 2010). While the data is limited among infants and toddlers (Dattilo et al., 2012), these patterns are troubling since low intakes of whole fruits and vegetables and high intakes of energy-dense foods, such as desserts and sweets and sweetened beverages, have been associated with obesity among older children and adults (Flynn et al., 2006; Swinburn, Caterson, Seidell, & James, 2004).
An important social change paralleling the rise in childhood obesity is the
increase in mothers participating in the labor force (Anderson & Butcher, 2006). Between 1970 and 2000, the rate of mothers in the labor force, either employed or looking for work, increased from 38% to 68%. The increase was even more dramatic among mothers with children under the age of three, with 24% of such mothers in the labor force in 1970 and 57% in 2000 (Ehrle et al., 2001). These changes in maternal employment have had implications for childcare arrangements of young children while the mother is working. The use of non-parental care begins early in life, with approximately half of all 9-month-olds in a regular non-parental care arrangement: 26% in relative care, 15% in non-relative care, 9% in center-based care, and 1% in multiple arrangements(Mulligan et al., 2005).
42
feeding during the first two years of life? What types of non-maternal caregivers are used most frequently? What impact does their involvement have on breastfeeding, timing of introduction of complementary foods, and the intake of foods and beverages associated with obesity?
Methods
Study design and participants
Data are from the Infant Care, Feeding and Risk of Obesity Study (Infant Care), an observational cohort of 217 low-income mother-infant dyads from 3 to 18 months after delivery (M. Slining et al., 2010; M. M. Slining et al., 2009; A. L. Thompson et al., 2009; Wasser et al., 2011). First-time African-American mothers aged 18 to 35 years were recruited through the North Carolina Supplemental Nutrition Program for Women Infants and Children (WIC) and assessed during in-home visits at infant ages 3, 6, 9, 12, and 18 months. Exclusion criteria for the Infant Care Study included delivery at <35 weeks gestation or presence of any of the following conditions: Down syndrome,
epilepsy, cleft lip/palate, cerebral palsy, failure to thrive, mental retardation, severe food allergies, and any condition that might affect appetite, feeding, or growth. Data were collected from 2003 to 2007. The institutional review board of the University of North Carolina at Chapel Hill approved this study.
Measures
43
feedings in a day. At each study visit, NMCs were identified through a series of three questions. First, the mother was asked how many times the index child was usually fed in a day. Fifty percent of this number was then calculated and mothers were asked if there was anyone, other than herself, responsible for feeding the index child that number of times (or more) in a day. If the mother affirmed use of a NMC, she was asked how the person was related to the index child. A total of six variables were created, one
representing any use of a NMC and five representing the type of NMC. Categories for type of NMC included father, grandmother, other relative (e.g. aunt, cousin), non-relative (e.g. babysitter, nanny), and licensed child care provider, which included child care centers and family day care homes.
Infant and toddler dietary intake. During each home visit, mothers completed a
questionnaire assessing current breastfeeding status (still breastfeeding “yes/no”) and a 24-hour dietary recall (DR). To improve estimates of usual food intakes, the Infant Care Study collected two additional 24-hour DRs, which were taken by telephone on random, nonconsecutive days within two weeks of the home visit (F. E. Thompson & Subar, 2008). Mothers were aware of the timing of home visits and telephone recalls and were instructed in advance to obtain information about any foods and beverages consumed by the infant while not in her care. The 24-hour DR was administered and analyzed using the 2005 version of the Nutrition Data System for Research (NDSR) (Nutrition Coordinating Center, University of Minnesota, Minneapolis, MN). Study personnel were trained by an NDSR–certified staff member of the University of North Carolina at Chapel Hill
44
We used data from NDSR to create several variables of interest, including early introduction to complementary foods before four months of age and intake of a series of foods and beverages associated, either positively or negatively, with obesity among older children and adults (Flynn et al., 2006; Swinburn, Caterson, Seidell, & James, 2004), namely low energy-dense foods (whole fruits and whole vegetables) and foods and beverages high in energy-density (100% juice, fried potatoes, desserts and sweets,
sweetened beverages, and salty snacks). This latter set of variables was patterned after the major and minor food groups utilized in FITS (Fox, Pac, Devaney, & Jankowski, 2004; Siega-Riz et al., 2010). For each of these major and minor food groups, two variables were created: the proportion of infants and toddlers consuming any amount, and total daily servings consumed. Serving sizes rather than gram amounts were chosen as serving sizes are based on commonly used household metrics, such as cups, ounces, and
tablespoons, and may be easier for researchers and public health workers to translate to parents and caregivers. When reporting servings of the major and minor food groups of interest, we adjusted the NDSR adult-based serving sizes to those appropriate for infants and toddlers, as has been done in previous studies (Cox et al., 1997; Hoerr et al., 2006). This is a necessary step as the serving sizes in NDSR are adult-sizeddrawn from the Dietary Guidelines for Americans (DGAs) or, for foods that are not recommended in the DGAs, the food-label serving sizes from the Food and Drug Administration.
body-mass-45
index (BMI) (18.5-24.9) and low-active to active lifestyle (Institute of Medicine, 2005). Calculations were done separately for boys and girls at each age (6, 9, 12, and 18
months). However, ratios did not differ by gender, resulting in the following single set of adjustment factors: 0.26 at 6 months, 0.29 at 9 months, 0.33 at 12 months, and 0.38 at 18 months. Examples of age-adjusted serving sizes for selected food items are provided in Table 7.
Confounding variables. Potential confounding variables were drawn from the literature and include factors associated with infant and toddler feeding practices (Hendricks, Briefel, Novak, & Ziegler, 2006) as well as non-maternal caregiving in general(Bianchi & Casper, 2000; Ehrle et al., 2001). These maternal and household characteristics encompass: any maternal employment, any maternal college education, maternal age, marital status, and maternal depression. Maternal depression was measured using the Center for Epidemiological Studies Depression Scale, with a score of 16 or greater indicating the presence of maternal depressive symptoms (Radloff, 1977).
Statistical analyses
46
serving size variables, with heavy clustering at zero (i.e., many non-consumers of particular foods or beverages). For these variables, we present the data in terms of the proportion of infants or toddlers consuming any amount of a food group or food item as well as the median among consumers only. We also examined cross-tabulations at each time point between any NMC usage or type of NMC usage and dichotomous variables expected to change over time (still breastfeeding and any intake of selected foods and beverages). This step revealed small cell sizes for some cross-tabulations, which had implications for the number of visits included in longitudinal models. For each model, we specify the number of visits included and the sample size.
To examine longitudinal associations between maternal and household
47
were used to examine associations between NMC usage and daily servings of the selected foods and beverages. Data presented are post-estimation marginal effects among
consumers only [E(y|y>0)]. Coefficients should be interpreted as the effect of NMC use versus no NMC use on the intake, among consumers only, of daily servings of selected foods and beverages.
Finally, differences in baseline characteristics between completers and non-completers were assessed at each study visit to test the effects of attrition. T-tests were used for continuous variables and chi-square or Fisher’s exact tests for categorical variables. Stata (release 12, 2012, StataCorp, College Station, TX) was used for all statistical procedures. Significance was set at P<0.05 for all tests.
Results
Sample characteristics
Among this sample of young, first-time, African-American mothers, there was generally a high prevalence of single-headed households and maternal obesity (Table 8). In an examination of attrition over time, tests of baseline differences between completers and non-completers revealed few significant differences. There were slightly more mothers at 12 months with at least some college education or who were married. At 18 months, slightly more mothers were married and household size was lower.
Infant and toddler dietary intakes
48
toddlers consumed juice than whole fruit (Table 8). By 18-months, nearly all toddlers consumed at least some amount of whole vegetables. Few infants consumed fried potatoes, sweetened beverages, or salty snacks at six months; however, by 18-months, approximately half or more of all toddlers were consuming these foods or beverages. Nearly all 18-month-olds consumed at least some solid dessert or sweet in a given day. When examining amounts, daily servings of whole fruits and vegetables excluding fried potatoes remained fairly stable over time. At any given age, infants and toddlers
consumed approximately 1.8 servings of whole fruit in a day and 1.5-2.0 servings of vegetables. Conversely, average daily servings of most high energy-dense foods and beverages more than doubled between six and 18 months. Translated into common household measures, total daily servings among 18-month-olds were as follows: 5 tablespoons (Tbsp) of whole fruit, 7 Tbsp of vegetables excluding fried potatoes, 8 fluid ounces of juice, 4 French fries or tater tots, 1¼ chocolate chip cookies, 5 fluid ounces of sweetened beverages, and nearly 10 grams of salty snacks, such as 11-12 cheese puffs.
Use of non-maternal caregivers (NMCs)
49
share responsibility for feeding early in infancy as the odds for fathers, while non-significant, were lower at each time point compared to the 3-month-visit.
Any maternal employment was the strongest predictor of NMC use, except for in the model specifically testing predictors of father involvement in feeding (Table 9). For fathers, being married was the strongest and only significant predictor of their
involvement in feeding. In contrast, grandmother involvement in feeding was
significantly less likely in married households and maternal age was inversely associated with their use.
NMCs and probability of dietary intake
There was no association between NMC use and early introduction of
50
Confidence Interval (CI): 1.02, 1.16] and maternal depression with an increased likelihood of consuming fried potatoes (OR=2.14, 95% CI: 1.15, 3.99).
NMCs and amount of dietary intake
Results of longitudinal random-effects tobit models showed no significant associations between use of NMCs, neither by any NMC nor by type of NMC, on infant and toddler dietary intake (Tables 12 and 13). As with the ‘any intake’ models, several maternal characteristics were associated with daily servings of foods and beverages. In the adjusted model with any use of a NMC as the main independent variable, a one-unit increase in maternal age was associated with 0.05 more servings of whole fruit (95% CI: 0.01, 0.08); any maternal college with fewer servings of fried potatoes ( = -0.19, 95% CI: -0.02, -0.35), sweetened beverages ( = -0.22, 95% CI: -0.01, -0.43), and salty snacks ( = -0.2, 95% CI: -0.05, -0.35); and maternal depression with more servings of salty snacks ( = 0.2, 95% CI: 0.05, 0.35)
Discussion
51
At each time point, more than half of the mothers in the Infant Care sample were employed and the types of NMCs utilized in this study were similar to the primary care arrangements used by employed mothers in a national sample. According to data from the U.S. Census Bureau, employed mothers utilized the following types of care for their infants and toddlers while working: fathers (27% and 24.2%, respectively), grandmothers (34% and 30.5%, respectively) and licensed child care providers (27.5% and 37.2%, respectively) (Laughlin, 2010). This finding adds another layer of complexity to the study of infant and toddler dietary intakesthe first two years of life is a period of fairly rapid exposure to a variety of foods and beverages, all of which is likely to be influenced by multiple caregivers, including their level of nutrition knowledge and their beliefs and behaviors about infant and toddler feeding (Scaglioni, Arrizza, Vecchi, & Tedeschi, 2011).
52
in the U.S., DiGirolamo et al.(2005) found a significant correlation between
breastfeeding attitudes at home and the length of time a woman intended to breastfeed (r = 0.23, p < 0.01) (DiGirolamo, Thompson, Martorell, Fein, & Grummer-Strawn, 2005). Similarly, among a sample of low-income African-American women living in Baltimore, Bentley et al. (1999) found that mothers who had partners supportive of breastfeeding were three times as likely to initiate breastfeeding than mothers whose partners thought they should feed formula (OR=3.33, 95% CI: 2.04-5.45) (M. Bentley, Gavin, Black, & Teti, 1999; M. E. Bentley, Dee, & Jensen, 2003).
There is also growing evidence on the importance of formal childcare arrangements, such as center-based licensed care, which has been associated with a decreased likelihood of breastfeeding as well as an increased likelihood of feeding complementary foods before four months (Kim & Peterson, 2008; Pearce et al., 2012). The extent to which the policies and environments in these facilities are supportive of breastfeeding may influence a mother’s ability to continue breastfeeding while working. Benjamin et al. (2009) analyzed childcare regulations related to infant feeding practices in all U.S. states and census regions and found that only 11 states (22%) had regulations specific to breastfeeding promotion or support and only 2 states (4%) had regulations specific to delaying complementary foods until six months (Benjamin et al., 2009). In a survey of breastfeeding policies and practices in 101 childcare centers in the central Piedmont region of North Carolina, only a small proportion of facilities encouraged mothers to come to the facility to breastfeed (21.7%), had a written policy that