METHODS AND APPLICATIONS FOR FAST-SCAN CYCLIC VOLTAMMETRIC DETECTION OF IN VIVO CATECHOLAMINE DYNAMICS
Elizabeth Showalter Bucher
A dissertation submitted to the faculty of the University of North Carolina at Chapel Hill in partial fulfillment of the requirements for the degree of Doctor of Philosophy in the
Department of Chemistry.
Chapel Hill 2014
Approved by:
Mark Wightman
Regina Carelli
Royce Murray
Paul Manis
ii ©2014
iii ABSTRACT
Elizabeth Showalter Bucher: Methods and Applications for Fast-Scan Cyclic Voltammetric Detection of In Vivo Catecholamine Dynamics
(Under the direction of R. Mark Wightman)
Fast-scan cyclic voltammetry (FSCV) at carbon-fiber microelectrodes provides the
spatial, temporal and chemical resolution required to study rapid catecholamine dynamics in
the brain. It is most well-known for its use in dopamine studies, where it has contributed
much to our knowledge regarding the presynaptic regulation of dopamine as well as its role
reward learning and addiction. Only recently has FSCV been applied to the detection of
norepinephrine, the other major catecholamine neurotransmitter in the central nervous
system. This is largely due to issues of selectivity; the electrochemistry of dopamine and
norepinephrine is indistinguishable with FSCV. For dopamine selectivity is not as much of
an issue as there are large regions of the brain innervated by dopamine neurons that lack
major noradrenergic input. For norepinephrine, however, there are only a few noradrenergic
terminal regions that receive little dopamine innervation and the small size of these regions
(typically ~ 0.5 mm3) make them difficult, but not impossible, to target.
Five years ago, it was demonstrated through electrochemical, chemical, anatomical
and pharmacological assays that norepinephrine could be monitored selectively with FSCV
in ventral subregion of the bed nucleus of the stria terminalis (vBNST), a limbic structure that
integrates cognitive and sensory information to initiate the physiological and behavioral
responses to stress, including glucocorticoid secretion via the HPA axis. Norepinephrine
signaling within the BNST is thought to potentiate these processes, and its dysregulation is
widely implicated in anxiety-related conditions such as post-traumatic stress disorder
iv
can be evoked by electrical stimulation of the dorsal and ventral noradrenergic axon
pathways, that it is regulated by the norepinephrine autoreceptor and transporter, and have
confirmed that, like dopamine, it is modulated by stimulation frequency and pulse number.
Additional work has established that BNST norepinephrine dynamics can be recorded in
awake, freely-moving rats and that it oppositely responds to administration of aversive and
appetitive tastants.
The studies presented in this volume are an extension of this preliminary work and
explore several facets of norepinephrine signaling within the BNST with FSCV in
anesthetized and behaving animals. Chapter 2 investigates the neural pathways by which
electrical stimulation evokes norepinephrine release within the BNST. Chapters 3 and 4
compares the responses of norepinephrine in the BNST and dopamine the NAc, a related
limbic structure, during an aversive sensory stimulation and during reward learning and
extinction. Chapter 5 employs combined iontophoresis and FSCV to probe the local
mechanisms by which BNST norepinephrine regulates hemodynamic function during
neuronal activity. Finally, Chapter 6 and 7 describe and assess new experimental tools for
FSCV data collection and analysis. Together the results of these studies demonstrate the
utility of FSCV in the detection of rapid norepinephrine signaling in vivo and provide new
v
ACKNOWLEDGEMENTS
There are many individuals I would like to acknowledge for their direct and indirect
contributions to this work. First and foremost, I would like to thank my advisor Dr. Mark
Wightman for his support and mentorship over the last five years. I greatly appreciate the
many opportunities you have presented me to grow as a scientist in a truly exciting field of
research. I would also like to thank my undergraduate advisors Dr. Don Jameson and Dr.
Stephanie Wetzel, who together inspired me to pursue a degree in Analytical Chemistry as a
Tarheel.
I have had the pleasure of working with many talented collaborators during my time
at UNC. Meg Fox and Justin Johnson conducted the chromatography and behavioral
experiments in Chapter 2. The work presented in Chapters 3 and 4 were led by Dr. Jinwoo
Park. Kristy Fontillas, Dr. Nina Owesson-White, Jenny Ariansen and Dr. Gina Carelli also
provided data and intellectual contributions to the work of Chapter 4. Meg Fox, Laura Kim,
Doug Kirkpatrick, and Nathan Rodeberg performed several of the experiments described in
Chapter 5, and Anna Belle provided guidance during the iontophoresis experiments of this
study. Chapter 6 was the culmination of many efforts, including those of Ken Brooks,
Matthew Verber, Dr. Richard Keithley, Dr. Nina Owesson-White, Dr. Susan Carroll, Dr.
Pavel Takmakov, and Collin McKinney. The preliminary results described in Chapter 7 were
the efforts of a number of dedicated undergraduate students including Laura Kim, Isaac
Studebaker, Preethi Gowrishankar, Marc Gonzalez, and Nathanial Swofford.
On a more general note, I would like to thank several individuals from the Wightman
vi
thank you both for showing me the ropes when I was a young Wightmanite. To Jinwoo,
thank you for recruiting me onto ‘Team Norepinephrine,’ teaching me how to interpret
‘bloody’ color plots, and for the late night ghost stories. To Meg, thank you for the many long
norepinephrine discussions and for always lending a helping hand, even when you didn’t
have one to offer. To Laura, thank you for an awesome four years and for dealing with all us
weird grad students. I feel extremely lucky to have had you on my team. To Nathan and
Justin, thanks for slaving away on Chapters 2 and 5. I eagerly await the first publication in
the Johnson-Rodeberg series.
Finally, I would like to thank several people outside of academia who made this work
possible. To my parents and grandparents, thank you for all of the emotional (and financial)
support over the years, for always believing in me, and for fostering my interest in science
throughout my childhood. (Mom, I think our trip to the water treatment plant must be the
defining moment in my decision to pursue grad school.) To Laurie, thank you for the many
motivational messages. They brought a smile to my face at times when the work seemed to
have no end. And to Kevin, thank you for standing by my side throughout this process. I
vii
TABLE OF CONTENTS
LIST OF TABLES ... xiv
LIST OF FIGURES ... xv
LIST OF ABBREVIATIONS AND SYMBOLS... xviii
CHAPTER 1: ELECTROCHEMICAL ANALYSIS OF NEUROTRANSMITTERS ... 1
Introduction ... 1
Detection of neurotransmitters with electrochemical techniques ... 2
Constant potential amperometry ... 3
Fast-scan cyclic voltammetry ... 4
Electrochemical detection of new neuromodulators ... 6
Enzyme-modified electrodes ... 6
Waveform modification strategies ... 7
Microsensor developments ... 9
Carbon-nanotube based microelectrodes ... 10
Fused-silica carbon-fiber microelectrodes ... 11
Microelectrode arrays ... 12
Novel applications ... 14
Challenging the conventions of neurochemical measurements. ... 14
Basal level measurements with FSCV ... 14
‘Ultrafast’ microdialysis ... 16
Multimodal measurements. ... 17
viii
Drosophila (fruit flies) ... 21
Non-human primates ... 22
Humans ... 25
Conclusions ... 26
References ... 28
CHAPTER 2: ELECTRICAL STIMULATION OF THE DORSAL NORADRENERGIC BUNDLE EVOKES NOREPINEPHRINE OVERFLOW IN THE BED NUCLEUS OF THE STRIA TERMINALIS THROUGH A NON-COERULEAN PATHWAY ... 39
Introduction ... 39
Experimental ... 41
Drugs and reagents ... 41
Animals ... 41
Surgeries ... 41
Voltammetric measurements ... 42
DSP-4 ... 43
Ibotenic acid infusion ... 43
Histology ... 43
Tissue content analysis ... 44
Behavioral assessment ... 45
Data analysis ... 46
Results ... 46
Measurement of norepinephrine in target regions ... 46
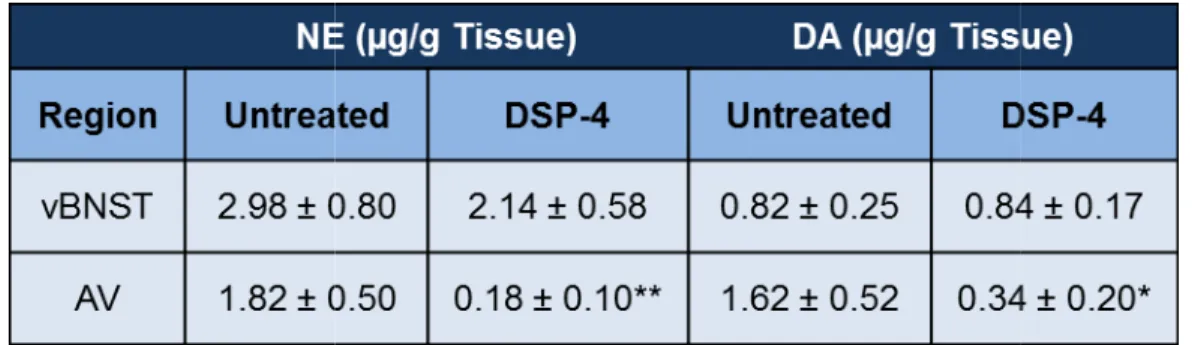
Effects of DSP-4 on catecholamine tissue content in the vBNST and AV ... 49
Electrically-stimulated norepinephrine release in the AV after DSP-4 ... 49
ix
Electrically-stimulated norepinephrine release after ibotenic
acid into the DNB ... 54
Behavioral responses elicited by electrical stimulation at the depth of the DNB ... 55
Discussion ... 58
LC lesioning attenuates norepinephrine release in the AV but not in the vBNST ... 59
Midbrain cell boy activation supports norepinephrine release in the vBNST but not in the AV ... 61
Conclusions ... 63
References ... 65
CHAPTER 3: NOREPINEPHRINE AND DOPAMINE TRANSMISSION IN TWO LIMBIC REGIONS DIFFERENTIALLY RESPOND TO ACUTE NOXIOUS STIMULATION ... 75
Introduction ... 75
Experimental ... 77
Animals ... 77
Surgery ... 77
Noxious stimulation ... 78
Voltammetric procedures ... 78
Histology ... 79
Chemical and drugs ... 79
Data analysis ... 79
Results ... 80
Rapid extracellular dopamine changes in the NAc shell elicited by tail pinch ... 80
Effects of dopamine autoreceptor and transporter inhibition on tail pinch induced responses in the NAc shell ... 84
x
Effects of norepinephrine autoreceptor and transporter
inhibition on tail-pinch induced responses in the vBNST ... 89
Discussion ... 91
Tail-pinch induced dopamine transmission in the NAc shell ... 92
Tail-pinch induced norepinephrine transmission in the vBNST ... 94
Conclusions ... 96
References ... 97
CHAPTER 4: OPPOSING CATECHOLAMINE CHANGES IN THE BED NUCLEUS OF THE STRIA TERMINALIS DURING INTRACRANIAL SELF-STIMULATION AND ITS EXTINCTION ... 103
Introduction ... 103
Experimental ... 104
Animals ... 104
Surgery ... 105
Intracranial self-stimulation training ... 105
Fast-scan cyclic voltammetry ... 106
Histology ... 106
Chemicals and drugs ... 106
Data analysis ... 108
Results ... 110
Cue-evoked dopamine concentration changes in the dlBNST during ICSS ... 110
Pharmacological effects on dopamine in the dlBNST ... 112
Norepinephrine responses during maintenance-delay trials ... 115
Pharmacological effects on norepinephrine in the vBNST ... 115
Extracellular changes of dopamine and norepinephrine during extinction of ICSS ... 115
xi
Different roles for each catecholamine in subregions of the
BNST during ICSS ... 122
Opposing catecholamine changes during extinction of ICSS ... 125
Conclusions ... 127
References ... 128
CHAPTER 5: MEDULLARY NOREPINEPHRINE NEURONS MODULATE LOCAL OXYGEN CONCENTRATIONS IN THE BED NUCLEUS OF THE STRIA TERMINALIS ... 134
Introduction ... 134
Experimental ... 136
Chemical and drugs ... 136
Electrode fabrication ... 136
Fast-scan cyclic voltammetry ... 136
Calibrations ... 137
Voltammetric data presentation and analysis ... 137
Surgery ... 138
In vitro procedure ... 139
Pharmacological investigations ... 139
Signal verification ... 141
Histology ... 141
Locus coeruleus lesioning with DSP-4 ... 141
Immunohistochemistry ... 142
Cardiorespiratory measurements ... 143
Results ... 143
Immunohistochemistry of recording environment ... 143
O2 response with electrical stimulation ... 145
xii
O2 responses with adrenoceptor blockade ... 151
Local iontophoresis of norepinephrine ... 156
Local iontophoresis of selective adrenoceptor agonists ... 159
Discussion ... 162
Conclusions ... 167
References ... 169
CHAPTER 6: A FLEXIBLE SOFTWARE PLATFORM FOR FAST-SCAN CYCLIC VOLTAMMETRY DATA ACQUISITION AND ANALYSIS ... 173
Introduction ... 173
Experimental ... 175
Hardware. ... 175
Software. ... 175
HDCV Data Acquisition ... 176
HDCV Data Analysis ... 177
Experimental setup ... 178
Experimental procedures. ... 180
Results and discussion ... 180
Programming techniques. ... 180
Timing control ... 181
Active/passive configuration routines ... 181
Setup control structure ... 182
Data storage ... 183
Real-time data analysis and acquisition. ... 183
Simultaneous detection of neurotransmitter release and single and single unit activity. ... 185
Two dimensional data filtering. ... 188
xiii
Time bin generation and signal averaging. ... 193
Conclusions ... 196
References ... 197
CHAPTER 7: EVALUATION OF FUSED-SILICA INSULATED CARBON-FIBER MICROELECTRODES FOR LONGITUDINAL NEUROCHEMICAL STUDIES ... 200
Introduction ... 200
Experimental ... 202
Chronic electrode construction. ... 202
Threading ... 202
Forming the seal ... 202
Trimming the fiber and adding a connection pin ... 203
Insulating the connection ... 203
Acute electrode construction. ... 203
Electrochemical measurements ... 207
Flow injection analysis ... 207
In vivo measurements ... 209
Results. ... 210
Comparison of acute and chronic type electrode performance ... 210
Carbon-fiber electrode performance after chronic implantation ... 214
Discussion. ... 214
Conclusion. ... 215
xiv
LIST OF TABLES
Table 2.1: Catecholamine tissue content in the anteroventral thalamus and the ventral bed nucleus of the stria terminalis for untreated
and DSP-4 treated animals ... 50
Table 5.1: Average norepinephrine and O2 responses to ventral
Noradrenergic bundle stimulation ... 154
Table 7.1: Chronic and acute electrode responses to dopamine with flow
xv
LIST OF FIGURES
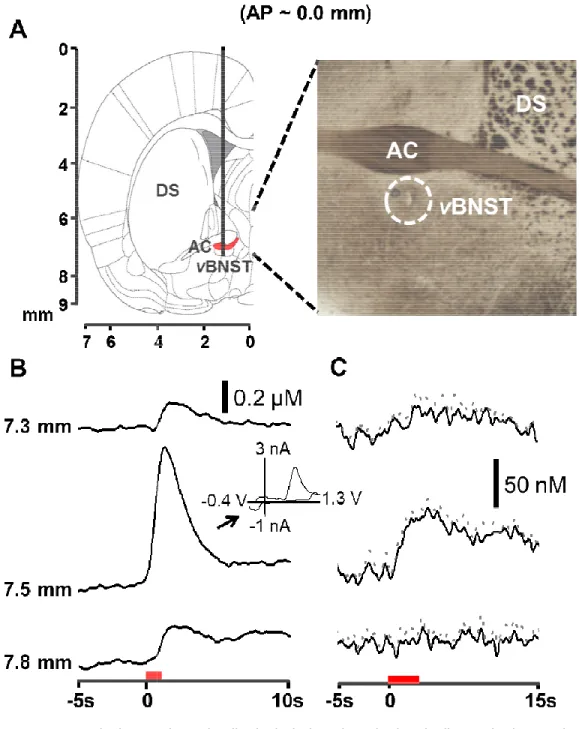
Figure 2.1: Measurement of norepinephrine in the anteroventral
thalamus and the ventral bed nucleus of the stria terminalis ... 48
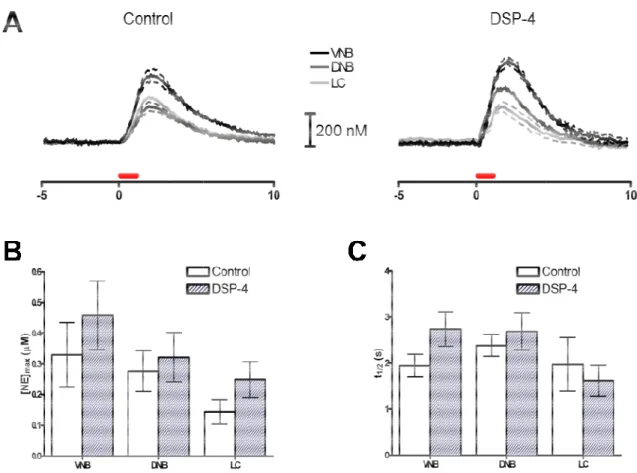
Figure 2.2: Effects of DSP-4 on electrically-stimulated norepinephrine
release in the anteroventral thalamus ... 51
Figure 2.3: Effects of DSP-4 on electrically-stimulated norepinephrine
release in the ventral bed nucleus of the stria terminalis ... 53
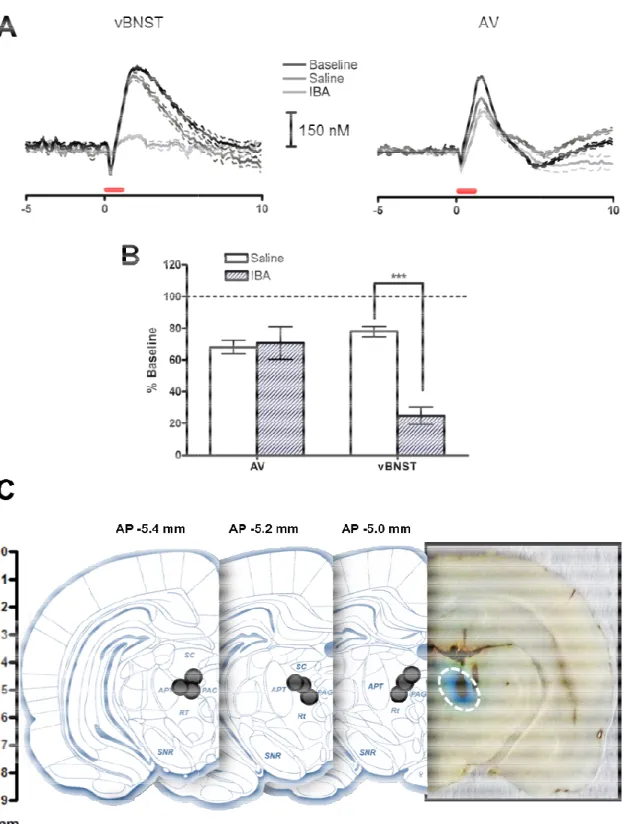
Figure 2.4:Effects of ibotenic acid infusion into the dorsal
noradrenergic bundle on electrically-stimulated norepinephrine
release ... 56
Figure 2.5:Incidence of behavioral responses to dorsal noradrenergic
bundle stimulation ... 57
Figure 3.1: Anatomical mapping of tail pinch induced and electrically
evoked dopamine responses in the nucleus accumbens shell ... 81
Figure 3.2: Dopamine signaling in the nucleus accumbens shell in
response to tail pinch ... 82
Figure 3.3: Dopamine signaling in the nucleus accumbens shell in
response to tail pinch after transporter and autoreceptor inhibition ... 85
Figure 3.4: Anatomical mapping of tail pinch induced and electrically evoked norepinephrine responses in the ventral bed nucleus
of the stria terminalis ... 87
Figure 3.5: Norepinephrine signaling in the ventral bed nucleus of the
stria terminalis in response to tail pinch ... 88
Figure 3.6: Norepinephrine signaling in the ventral bed nucleus of the stria terminalis in response to tail pinch after transporter and
autoreceptor inhibition ... 90
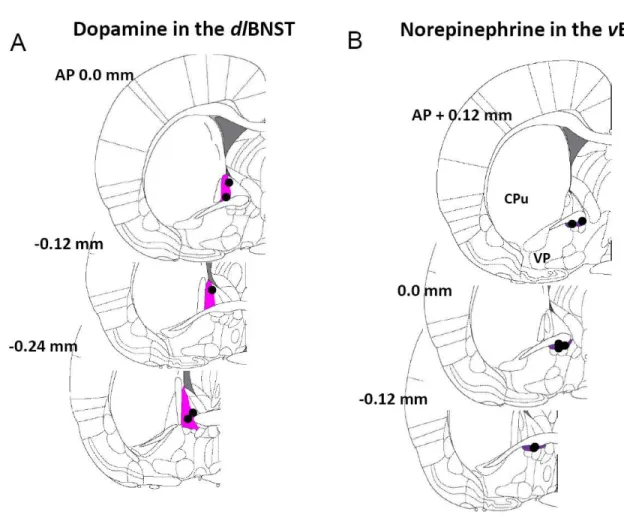
Figure 4.1: Representative histological verification of recording sites in the nucleus accumbens and the bed nucleus of the stria
terminalis ... 107
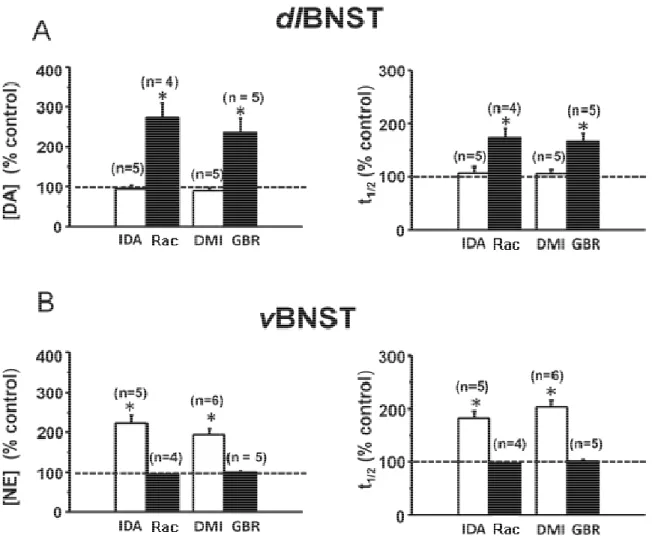
Figure 4.2: Effects of selective autoreceptor and uptake inhibitors on electrically-evoked catecholamine release and clearance in
subregions of the bed nucleus of the stria terminalis ... 109
Figure 4.3: Dopamine changes in the dorsal lateral bed nucleus of the stria terminalis during maintenance-delay intracranial
xvi
Figure 4.4: Dopamine increase in the dorsal lateral bed nucleus of the stria terminalis during maintenance-delay intracranial
self-stimulation after administration of GBR12909 ... 113
Figure 4.5: Dopamine concentration changes in the dorsal lateral bed nucleus of the stria terminalis and latency to lever-press during maintenance-delay intracranial self-stimulation before and after
administration of desipramine ... 114
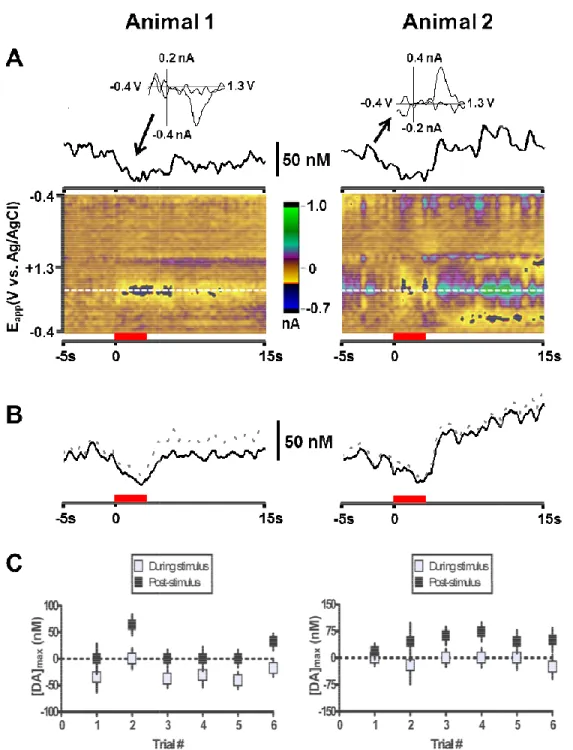
Figure 4.6: Norepinephrine changes in the ventral bed nucleus of the stria terminalis during maintenance-delay intracranial
self-stimulation ... 116
Figure 4.7: Average norepinephrine concentrations in the vBNST during phase 2 of intracranial self-stimulation at the 2nd day
and the 5th day of training ... 117
Figure 4.8: Norepinephrine increase in the ventral bed nucleus of the stria terminalis during maintenance-delay intracranial
self-stimulation after administration of desipramine ... 118
Figure 4.9: Norepinephrine concentration change in the ventral bed nucleus of the stria terminalis and latency of the lever-press during maintenance-delay intracranial self-stimulation after
administration of GBR 12909 ... 120
Figure 4.10: Catecholamine responses in the nucleus accumbens, dorsal lateral bed nucleus of the stria terminalis, and ventral bed nucleus of the stria terminalis during intracranial
self-stimulation extinction ... 121
Figure 4.11: Norepinephrine concentration changes during intracranial self-stimulation extinction before and after the administration of
the norepinephrine uptake inhibitor DMI ... 123
Figure 5.1: Confocal laser scanning images of triple-fluorescence labeling
in the rat ventral bed nucleus of the stria terminalis ... 144
Figure 5.2: Simultaneous detection of 250 µM O2 and 8 µM
norepinephrine in an air-impermeable flow injection system ... 146
Figure 5.3: Variability of the O2 response to electrical stimulation of
the ventral noradrenergic bundle ... 147
Figure 5.4: Effect of stimulating and working electrode placements
on the recorded O2 response ... 148 Figure 5.5: Characterization of the second O2 increase induced by
xvii
Figure 5.6: Predominant O2 response recorded in the ventral bed nucleus of the stria terminalis with electrical stimulation of
the ventral noradrenergic bundle ... 152
Figure 5.7: The effect of DSP-4 lesioning on dopamine-beta-hydroxylase immunoreactivity ... 153
Figure 5.8: Cardiorespiratory responses to anesthesia and adrenoceptor antagonists ... 156
Figure 5.9: Pharmacology of the ventral noradrenergic bundle stimulated O2 response recorded in the ventral bed nucleus of the stria terminalis ... 157
Figure 5.10: O2 changes induced by direct delivery of norepinephrine with iontophoresis ... 158
Figure 5.11: Effect of norepinephrine concentration applied by iontophoresis on the peak time for the second O2 event ... 160
Figure 5.12: O2 changes induced by local delivery of adrenoceptor agonists with iontophoresis ... 161
Figure 5.13: Proposed mechanism underlying the O2 responses recorded after electrical stimulation of the ventral noradrenergic bundle ... 163
Figure 6.1: Block diagram of hardware for combined electrochemical/electrophysiological recordings during behavior ... 179
Figure 6.2: Results from in vivo recordings with a carbon-fiber electrode implanted in the nucleus accumbens of an anesthetized rat using a waveform designed for simultaneous detection of O2 and dopamine ... 184
Figure 6.3: Simultaneous electrochemistry/electrophysiology measurements ... 187
Figure 6.4: Use of the 2D-FFT filter in HDCV ... 189
Figure 6.5: Continuous data analysis in HDCV ... 192
Figure 6.6: Time bin analysis procedure in HDCV ... 195
Figure 7.1: Schematic of the chronic type microelectrode ... 204
Figure 7.2: Size comparison between acute and chronic microelectrode types ... 205
xviii
Figure 7.4: Example data collected during a flow injection analysis
experiment ... 210
Figure 7.5: Dopamine calibration curves for 150 µm carbon-fiber
microelectrodes ... 211
Figure 7.6: In vivo performance of chronically implanted
xix
LIST OF ABBREVIATIONS AND SYMBOLS
* probability less than 0.05
** probability less than 0.01
*** probability less than 0.001
[X] concentration of analyte X
[X]max maximum concentration of analyte X
ºC degrees Celsius
2D two-dimensional
4-MC 4-methylcatechol
ABT 1-aminobenaotriazole
AC anterior commissure
aCSF artificial cerebrospinal fluid
Ag/AgCl silver/silver chloride
ANOVA analysis of variance
AP anterior-posterior
APT anterior pretectal nucleus
ATP adenosine triphosphate
AV anteroventral thalamus
BNST bed nucleus of the stria terminalis
BOLD blood oxygen level dependent
CaCl2 calcium chloride CBF cerebral blood flow
CE capillary electrophoresis
CNT carbon nanatube
xx
CV cyclic voltammogram
CYP cytochrome P450
DA dopamine
DAQ data acquisition
DAT dopamine transporter
DBH dopamine-beta-hydroxylase
DBS deep-brain stimulation
DIO digital input-output
dlBNST dorsal lateral bed nucleus of the stria terminali
DMI desipramine
DNB dorsal noradrenergic bundle
DSP-4 N-(2-chloroethyl)-N-ethyl-2-bromobenzylamine
DV dorsal-ventral
Eapp applied potential echem electrochemistry
ephys electrophysiology
FFT fast Fourier transform
fMRI functional magnetic resonance imaging
FR-1 fixed-ratio 1
FSCV fast-scan cyclic voltammetry
g grams
GBR GBR-12909
GFAP glial fibrillary acidic protein
GnRH gonadotropin-releasing hormone
H2O2 hydrogen peroxide
xxi
HEPES 4-(2-hydroxyethyl)-1-piperazineethanesulfonic acid
HPC hippocampus
Hz hertz
i.p. intraperitoneal injection
I/O input/output
IBA ibotenic acid
ICSS intracranial self-stimulation
IDA idazoxan
IgG immunoglobulin
KCl potassium chloride
kg kilograms
L liters
LC liquid chromatography
LC locus coeruleus
µA microamperes
µm micrometer
µM micromolar
mA milliamperes
M-ENK met-enkephalin
mg milligrams
MgCl2 magnesium chloride
ML medial-lateral
mL milliliters
mm millimeter
mM millimolar
xxii
ms millisecond
n number of samples
N2 molecular nitrogen
nA nanoamperes
NAc nucleus accumbens
NaCl sodium chloride
NaH2PO4 monosodium phosphate NaHCO3 sodium bicarbonate NaOH sodium hydroxide
NaSO4 sodium sulfate
NE norepinephrine
NET norepinephrine transporter
NO nitric oxide
NOS nitric oxide synthase
NST nucleus of the solitary tract
O2 molecular oxygen
P probability
PAG periaqueductal gray
PCR principal component regression
PROP propranolol
r2 coefficient of determination
Rac raclopride
Rt reticular formation
σ standard deviation
s second
xxiii S.E.M. standard error of the mean
SN substantia nigra
SNR substantia nigra pars reticulate
STL solanum tuberosum agglutinin
t time
TRIS tris(hydroxymethyl)aminomethane
TTL transistor-transistor logic
TZ terazosin
UEI universal electrochemical instrument
UNC University of North Carolina
V volts
vBNST ventral bed nucleus of the stria terminalis
VI virtual instrument
VNB ventral noradrenergic bundle
VTA ventral tegmental area
1
CHAPTER 1: ELECTROCHEMICAL ANALYSIS OF NEUROTRANSMITTERS
Introduction
In the brain neuronal communication primarily occurs through the exocytotic release
of neurotransmitters into synaptic junctions and the surrounding extracellular fluid. These
chemical signaling molecules modulate post-synaptic cell activity in various ways dependent
on the identity of the neurotransmitter and the receptors that are recruited. The downstream
effects of neurotransmission underlie a wide range of physiological and behavioral
processes and its dysregulation can lead to a number of debilitating disorders as broad as
Parkinson’s disease, Alzheimer’s disease, depression and drug addiction (Weinshenker,
2008; Jacobsen et al., 2012; Janezic et al., 2013; Koob, 2013).
Before the 1970’s, there was no available technique with the requisite sensitivity
other than radioimmunoassays to detect the small chemical concentrations produced by
neurotransmission (Adams, 1976). During the latter part of the 1960’s, however, Ralph
Adams and his colleagues had studied the electrochemistry of a number of easily oxidizable
biogenic amines, and quickly realized the potential applications of their knowledge to the
field of neurochemistry. Shortly thereafter, Adams implanted a carbon-paste electrode into
the brain of an anesthetized rat and, quite boldly, demonstrated that traditional voltammetric
techniques could be applied with success to biological tissues (Kissinger et al., 1973). While
the signal recorded was likely ascorbic acid and not dopamine as had been hoped, this work
importantly suggested that neurotransmitters could escape the confined space of the
synaptic cleft and diffuse to the electrode surface—without which in vivo electrochemical
2
The early days of in vivo electrochemistry were fraught with issues of selectivity,
mainly due to interference from catecholamine metabolites and ascorbic acid (Justice, 1987).
However, over the last four decades numerous methods have been developed to increase
not only the selectivity of these measurements, but to apply them at a subsecond time scale.
As Adams envisioned, in vivo electrochemistry now encompasses a matured set of
techniques employed by countless neuroscience and psychology laboratories to study the
release, uptake and signaling dynamics of rapid neurotransmission. Electrochemical
techniques have found use in a wide variety of applications, from resolving single exocytotic
events from single cells to monitoring neurochemical fluctuations in awake, behaving
animals.
It is impossible to cover the entire scope of electrochemical detection of
neurotransmitters in a single review. This review, therefore, has two goals. First, we provide
a general understanding of common electrochemical techniques used for neurotransmitter
detection. Second we highlight several new applications defining the next generation of in
vivo electrochemical research.
Detection of Neurotransmitters with Electrochemical Techniques
Several different electrochemical techniques have been applied to monitor
neurotransmitter fluctuations in living tissues, including amperometry, various potential pulse
methods, and cyclic voltammetry (Justice, 1987; Kawagoe et al., 1992; Robinson et al.,
2008). In general, these methods detect target neurotransmitters through their oxidation or
reduction at a solid electrode. The currents generated provide a quantitative measure of
dynamic chemical fluctuations that can be correlated to pharmacology, behavior and
disease pathology. Target molecules are limited to those that are electroactive within the
3
norepinephrine and serotonin), their metabolites, and ascorbic acid. Here we briefly
overview the most common techniques in current use.
Constant-potential amperometry
In constant-potential amperometry, often referred to simply as amperometry, the
electrode is held at a potential sufficient to oxidize or reduce an analyte of interest so that
the currents generated are mass transport limited. As the potential is constant throughout
the duration of the experiment, no charging currents are generated and direct integration of
the currents detected provides the amount of analyte electrolyzed according to Faraday’s
law (Q = nNF). Moreover, the time resolution of the experiments is only limited by the data
acquisition rate. However, these measurements provide very little chemical information as
any molecule that is electroactive at a given potential will be detected and should only be
applied to samples of known content. For example, ex situ analyses typically preprocess
samples through separation methods, such as liquid chromatography. Indeed, liquid
chromatography with amperometric detection was one of the first viable methods for brain
tissue content analysis (Adams, 1976) and is still in common use today.
Cell cultures are typically relatively homogenous in their chemical composition and
their contents can be predetermined by other analyses, making them suitable for
amperometric analysis (Mosharov & Sulzer, 2005). Intracellular communication occurs
through exocytosis, by which a neurotransmitter-filled vesicle docks and fuses to the cell
membrane and releases its contents into the extracellular space. The high temporal
resolution of amperometry has proven highly useful for the study of exocytosis of
monoamines from single cells and cell cultures. In such experiments, a small beveled disk
electrode is placed near the cell membrane. Chemical stimulation of the cell is used to
evoke neurochemical release. Single exocytosis events are resolved as millisecond-wide
4
neurotransmitters release, a number of other quantitative and qualitative information can be
determined from the shape of the spike. The rise time (10% - 90%) of the peak correlates to
the opening kinetics of fusion pore between the cell membrane and the
neurotransmitter-filled vesicle. The half-width of the spike indicates the duration of the release event. Of
recent discovery, the presence of post spike plateau currents is indicative of partial-fusion,
or “kiss and run,” events (Mellander et al., 2012). Amperometric measurements have been
applied to a variety of cell types including adrenal chromaffin cells (Petrovic et al., 2010),
pheochromocytoma (PC12) cells (Westerink & Ewing, 2008), mast cells (Manning et al.,
2012), and neurons (Pothos, 2002; Borisovska et al., 2013) to probe the pharmacology and
biophysics of vesicular release events.
Fast-scan cyclic voltammetry
In fast-scan cyclic voltammetry (FSCV), a triangular waveform is applied to a
microelectrode at a high scan rate (>100 V/s) to rapidly oxidize and reduce electroactive
species at the electrode surface. Various performance aspects (i.e. sensitivity, selectivity,
and temporal resolution) can be optimized by altering the potential limits, scan-rate and
application frequency of the waveform. For instance, a commonly used dopamine
waveform scans from -0.4 V to +1.3 V at 400 V/s, repeated at 100 ms intervals. The rapid
scan generates a large background current that arises mainly from the charging of the
electrical double layer and is proportional to the capacitance of the electrode. Thus, to
resolve the smaller faradaic currents the background current is subtracted, usually by digital
means. In the resulting cyclic voltammogram, the peak potentials provide a chemical
signature to identify the species detected. Peak currents are usually converted into
concentrations using calibration factors obtained from standards of known concentration.
Given its chemical selectivity, FSCV has been widely employed in vitro and in vivo to
5
norepinephrine, serotonin, O2, and pH changes (Bunin et al., 1998; Venton et al., 2003; Park et al., 2011). Many FSCV studies use electrical stimulation to elicit monoamine release in terminal regions. The rising phase of these responses is determined by release (modified by
its autoinhibition) and uptake mechanisms, while the falling phase is principally governed by
uptake. Both phases are convoluted with diffusion from the site of release to the electrode.
Measurement of these parameters therefore can be used to assay the function of these
regulatory mechanisms (Wightman et al., 1988; Wightman & Zimmerman, 1990; McElligott
et al., 2013).
Of the biogenic amines, dopamine is the most common target of FSCV
measurements. Studies in brain slices and anesthetized animals have proven particularly
useful in delineating the regulatory mechanisms controlling dopamine release and uptake in
subregions of the striatum and how these processes are disturbed in disease states
(Bergstrom et al., 2011; Hashemi et al., 2012; Riday et al., 2012; Calipari et al., 2014). A
major accomplishment has been the use of voltammetry in freely-moving animals that has
contributed much to our understanding of the central dopamine system and how it drives
motivated behaviors during reward-based learning (Carelli, 2004; Owesson-White et al.,
2008) and drug addiction (Owesson-White et al., 2009; Addy et al., 2010; Ehrich et al.,
2014). In contrast, application of FSCV to the detection of norepinephrine and serotonin in
vivo has only recently been possible due to issues of selectivity and electrode fouling, respectively. Several effective strategies have been identified to overcome these
challenges, involving anatomical positioning for norepinephrine and waveform/electrode
modifications for serotonin. Subsequent work has successfully investigated the regulation of
norepinephrine overflow in the bed nucleus of the stria terminalis (Park et al., 2009; Park et
6
Electrochemical Detection of New Neuromodulators
A number of endeavors have been made to extend the high temporospatial
resolution of in vivo electrochemical detection to target molecules that are more difficult to
electrolyze. These efforts have principally used two approaches. In one approach, the
electrode is modified with an enzyme selective for the molecule of interest. Alternatively, the
parameters of the applied voltage sweep have been adjusted. These strategies are
discussed in more detail below.
Enzyme-modified electrodes
Enzyme-modified electrodes provide the ability to detect a range of non-electroactive
species in biological tissue. In such measurements an enzyme with specific activity for an
analyte of interest is immobilized to the electrode surface covalently or through film coating.
The activity, stability and selectivity of the enzyme in its immobilized form are crucial aspects
of sensor performance (Wilson & Johnson, 2008). Analyte detection is accomplished
through the formation of an electroactive product, often H2O2 formed by an oxidase. For instance the detection of glutamate can be achieved with glutamate oxidase, which coverts
glutamate into α-ketoglutarate and H2O2 (Kiyatkin et al., 2013). Often a secondary enzyme-free electrode is required to account for non-specific currents (Kiyatkin & Lenoir, 2012). As
the kinetics of the enzyme can slow the temporal resolution of such measurements,
enzyme-based sensors are usually coupled to amperometry. Amperometric enzyme sensors
have been developed for many non-electroactive neurotransmitters, including glutamate
(Oldenziel & Westerink, 2005; Kiyatkin et al., 2013), acetylcholine (Sarter et al., 2009), its
precursor choline (Parikh et al., 2004) and adenosine (Schmitt et al., 2012).
The chemical information provided by FSCV can alleviate many of the selectivity
issues experienced with enzyme-based amperometric sensors. In the past, the use of
7
been limited by the slow electron-transfer kinetics of H2O2. However, Sandford et al. recently demonstrated that over-oxidizing the carbon-fiber surface with an extended +1.4 V anodic
scan facilitates the oxidation of H2O2 with FSCV (Sanford et al., 2010). As the over-oxidation process occurs near the anodic switching potential with this extended waveform, the
oxidation peak for H2O2 appears at +1.2 V on the reverse scan. To detect glucose with this waveform, carbon-fiber microelectrodes were coated by electrodeposition of
glucose-oxidase in chitosan, a non-toxic polysaccharide (Lugo-Morales et al., 2013). This sensor
was shown to have a 13 µM limit of detection for glucose, stable performance over a 4 hr
period, and the ability to discriminate against interferents such as dopamine, ascorbic acid
and pH. This work establishes the utility of enzyme-based FSCV sensors for the detection of
non-electroactive species.
Waveform modification strategies
There are a number of molecules in the brain that are electroactive but are not
oxidized by the voltammetric sweep employed for dopamine measurements (-0.4 V to +1.3
V, 400 V/s). Several of these molecules can be detected by modifying the anodic limits of
the potential scan to promote electrode-transfer. Adenosine is one such example. Formed
from the degradation of ATP, adenosine is a purine signaling molecule that regulates
cerebral blood flow, metabolism, and the activity of different neurotransmitters (Cunha,
2001). Detection of adenosine is accomplished by increasing the anodic limits of the
traditional dopamine waveform to +1.5 V (Swamy & Venton, 2007b). This generates an
initial oxidation peak at the anodic switching potential and a second oxidation peak at +1.0 V
on the forward scan. The second oxidation peak arises from sequential oxidation of the
initial electroformed product. Both of these oxidation processes are irreversible; hence no
reduction peaks are generated. Since the development of this modified waveform, it has
8
lamina (Street et al., 2011; Street et al., 2013), brain slices (Pajski & Venton, 2010; 2013),
and the striatum of anesthetized rats (Cechova & Venton, 2008). Initial results have found
that adenosine release is evoked by mechanical stimulation (Ross et al., 2014) and
correlates to local O2 fluctuations in intact tissue (Cechova & Venton, 2008). More recently, a ‘sawhorse’ shaped waveform has been developed, which holds at 1.35 V for 1 ms during
the anodic scan (Ross & Venton, 2014). The sawhorse waveform provides discrimination
between adenosine and two major interferents that oxidize at similar potentials, H2O2 and ATP, and may prove useful for in vivo experiments. In parallel studies, Dale and coworkers
have used an enzyme modified electrode to probe the dynamics of adenosine and its
precursors (Schmitt et al., 2012).
Waveform strategies have also been incorporated to target various peptide
neurotransmitters. Glanowska et al. detected gonadotropin-releasing hormone (GnRH)
release in mouse brain slices (Glanowska et al., 2012) where it plays a major role in fertility
(Belchetz et al., 1978) and is also believed to act as a neuromodulator (Chen & Moenter,
2009). GnRH was detectable as it contains the electroactive amino acid tryptophan.
Although the oxidation of tryptophan can foul the electrode, stable oxidation currents were
obtained for GnRH using a triangular waveform scanning from 0.5 V to 1.45 V at 400 V/s.
With this waveform the oxidation peak for GnRH occurs at ~1.25 V, and could be
distinguished from tryptophan and another tryptophan-containing peptide, kisspeptin-10.
Measurements in brain slices revealed that GnRH release could be chemically evoked in the
median eminence and the preoptic area. No signal was detected from mice genetically
modified to lack GnRH supporting its detection in wild-type animals.
FSCV has also been applied to the detection of the small opioid peptide,
methionine-enkephalin (M-ENK) (Schmidt et al., 2014). M-ENK and other opioid peptides are involved
with many physiological and behavioral processes, including reward-processing, drug
9
tyrosine, which, similar to tryptophan, can cause electrode fouling. Schmidt et al.
demonstrated that M-ENK could be detected reproducibly and selectively with a variant of
the sawhorse waveform that varied the scan rate on the anodic sweep. The optimized
waveform scanned from -0.2 to +0.6 V at 100 V/s, then to +1.2 V at 400 V/s. This anodic
limit was held for 3 ms before scanning back to the -0.2 V holding potential at 100 V/s. The
oxidation peak for M-ENK occurs at +1.0 V on this waveform, which exhibited selectivity
against other tyrosine-containing peptides. As the oxidation peaks for catecholamines occur
at more negative potentials, it was possible to use this waveform to monitor simultaneous
norepinephrine and M-ENK release from tissue extracted from the rat adrenal gland.
Microsensor Developments
The need for a miniaturized working electrode compatible with tissue implantation
was recognized soon after the advent of in vivo electrochemistry (Adams, 1976). Smaller
electrodes allow for minimal tissue damage, higher spatial resolution to probe discrete brain
regions, and faster sampling rates given their reduced RC properties. Carbon was the
intuitive choice for electrode material given its low cost, good electrochemical properties and
biological compatibility; however, the conventional carbon-paste electrodes of the 1970’s
were not amenable to miniaturization (Stamford, 1989). In the late 70’s, the field of in vivo
electrochemistry took a leap forward with the introduction of the carbon-fiber microelectrode
by Gonon and coworkers (Ponchon et al., 1979). These electrodes are fabricated by sealing
the carbon fiber (5 – 35 µm diameters) in glass and either cutting the protruding fiber to form
a cylindrical electrode or treating the seal with epoxy and polishing the tip to form an
elliptical surface. Given the ease and reproducibility of their fabrication, carbon-fiber
microelectrodes are routinely used in most in vivo electrochemical studies today (Huffman &
10
Over the last several decades, there have been a number of efforts to improve the
performance of in vivo electrochemical sensors through a number of methods. For instance,
effort has been spent investigating surface modification techniques to enhance the
selectivity, sensitivity, and kinetic properties of carbon-fiber microelectrodes. Broadly
speaking, these have included electrochemical (Heien et al., 2003) and chemical
pretreatments (Hermans et al., 2006) as well as film coating. Application of the
perfluorinated cation-exchange polymer Nafion through electro-deposition or dip-coating has
proven particularly effective in repelling negatively-charged interferents during in vivo
measurements (Hashemi et al., 2009). Here we highlight several more recent developments
in in vivo electrochemical sensor technology.
Carbon-nanotube based microelectrodes
Carbon-nanotubes (CNTs) are a subject of interest for various electrochemical
applications, given their mechanical strength, high aspect ratios, and good electrical
conductivities (Jacobs et al., 2010; Putzbach & Ronkainen, 2013). Research exploring
modification of carbon-fiber microelectrodes with CNTs for neurotransmitter measurements
has shown increased electron-transfer kinetics and sensitivity for adsorption-controlled
species such as dopamine. Such electrodes are also less susceptible to common biofouling
agents, such as 5-HIAA. Immobilization of CNTs onto carbon-fiber microelectrodes was first
achieved by dip-coating the fibers in a CNT-Nafion suspension (Swamy & Venton, 2007a).
However, this method was found to suffer from poor reproducibility and the orientation of the
CNTs restricted access to electroactive sites at the ends of the tubes. Further work identified
chemical self-assembly of single-walled CNTs to be an effective method to form uniformly
aligned CNT layers on carbon-fiber disk electrodes (Xiao & Venton, 2012). Application of
11
sensitivity for dopamine without decreasing response time, a problem that often occurs with
other pretreatment methods.
Continuous fibers, or ‘yarns’, can be formed from carbon-nanotubes through
liquid-state and dry-liquid-state spinning methods (Zhao et al., 2010; De Volder et al., 2013). By
adjusting the size of the nanotubes and the spinning angle, yarns with diameters on the
micrometer scale can be prepared. Disk microelectrodes (5 – 30 µm diameters) fabricated
from multi-walled CNT yarns exhibit a number of interesting electrochemical properties
including lower background currents and faster apparent electron-transfer kinetics, which
allows enhanced chemical discrimination (Schmidt et al., 2013; Jacobs et al., 2014). While
the time spent at negative holding potentials is a critical factor determining the sensitivity to
dopamine at bare electrodes, the dopamine response at yarn microelectrodes is
independent of waveform application frequency—believed to be due to slower desorption
kinetics for dopamine-o-quinone. Jacobs et al. demonstrated that dopamine could be
detected at a 2 ms timescale while maintaining sensitivity, simply by increasing the
scan-rate and application frequency of the waveform. Other work found that sensitivity for
dopamine is enhanced even further when the yarns are made in polyethyleneimine, instead
of poly(vinyl alcohol) (Zestos et al., 2014). Together CNT-based microelectrodes present the
opportunity for sensitive, selective FSCV measurements at unprecedented speeds.
However, it is not yet clear whether these advantages of CNT-microelectrodes are of great
enough significance to result in their widespread use.
Fused-silica carbon-fiber microelectrodes
Traditionally, carbon-fiber microelectrodes are insulated within borosilicate glass
capillaries. While easy to fabricate, glass-sealed microelectrodes are fragile and often break
during routine experimental procedures. For a more robust electrode construction several
12
Gerhardt et al., 1999). Fused-silica offers good insulating properties and increased flexibility
at low cost. During fabrication, a seal is formed at the carbon fiber by an epoxy droplet. As
fused-silica is less prone to breakage smaller diameter (100 vs 600 µm) electrodes are
possible, which allows for less tissue damage during implantation.
Several years ago, Phillips and coworkers found that naturally-evoked dopamine
release could be measured at polyamide-coated fused-silica electrodes several months after
in vivo implantation (Clark et al., 2010). Incredibly, measurements were obtainable for up to 25 successive days without any apparent loss in sensitivity—though there was a noted loss
in temporal response. Given the heterogeneity of brain microenvironments, the ability to
conduct FSCV measure from the same terminal population over multiple days is an exciting
prospect for studies of disease and behavioral learning. Indeed, others have attempted to
develop such a sensor (Duff & O'Neill, 1994; Kruk et al., 1998), albeit with little success. The
performance of the fused-silica electrode design is attributed to its size, which is believed to
be small enough to bypass the immune response.
There is still question as to how these sensors can be used. While post-calibration of
the sensors revealed no changes in electrode sensitivity after chronic implantation, it is
unclear whether the performance of the sensor remains stable after several days of in vivo
use. Unforeseen issues such as new tissue damage or degradation of the carbon-fiber could
change the electrode’s response with continued use. In such cases, it would be impossible
to determine whether a signal decrease is a biologically relevant change or merely a change
in electrode sensitivity. These concerns are the subject of ongoing studies.
Microelectrode arrays
The release of neurotransmitters has been found to vary not only within discrete
substructures of the brain (Wightman et al., 2007) but across individual cells (Schroeder et
13
compatible with neurochemical measurements for a variety of in vitro and in vivo purposes.
Consolidation of multiple sensing elements onto a single device opens not only the potential
for spatially-resolved profiling of neurochemical dynamics but for the simultaneous detection
of different analytes by optimizing the potentials applied to each electrode.
To capture exocytotic variation on a subcellular level, the MEA size and electrode
spacing must be smaller than the cell itself (~10-20 µm for a neuron). For single cell
measurements, carbon-disk MEAs have been fabricated from carbon-fibers inserted into
multibarrel glass and from the deposition of carbon through pyrolysis onto a fused assembly
of quartz capillaries to form up to 7 and 15 electrodes respectively (Zhang et al., 2011; Lin et
al., 2012). In addition, a variety of microfabrication approaches have been employed to create MEA devices with increased electrode number for single cell and cell cluster
applications (Cui et al., 2006; Berberian et al., 2009; Carabelli et al., 2010). Recently, Ewing
and coworkers have developed platinum MEA platforms that are modified with collagen IV
coatings to promote cell adhesion and growth (Wang et al., 2013; Wang et al., 2014). The
newest version of their design confines 36 microelectrodes within a 40 µm x 40 µm
microwell to position a cultured PC12 cell directly above the sensor surface.
The majority of MEAs developed for in vivo neurochemical applications have been
carbon-based given its compatibility with FSCV. These have been used to probe
neurotransmitter heterogeneity across multiple brain regions and within brain
microenvironments. It is possible to achieve multielectrode recordings in vivo by simply
implanting several individual carbon-fiber microelectrodes (Clark et al., 2010; Zachek et al.,
2010b). However, such methodologies can suffer from irreproducibility and are difficult to
implement when targeting a single brain structure. Hence, recent efforts have focused on
the microfabrication of carbon-based MEAs. Successful devices containing 4 and 16 band
microelectrodes have been created from pyrolized photoresist (PPF), which is amenable to
14
Strategies to construct MEAs from grown carbon nanofibers are also under investigation,
but the viability of such devices in vivo has yet to be demonstrated (Zhang et al., 2013).
Novel Applications
Challenging the conventions of neurochemical measurements
Microdialysis and FSCV are the two most common in vivo neurochemical techniques
in use today. Though initially viewed as rival methods early in their development,
microdialysis and FSCV are now recognized to provide complementary information. The
millisecond temporal resolution of FSCV has made it superior for fast neurochemical
measurement of electroactive molecules; however, the need for background-subtract limits
detection to rapid concentration changes. With microdialysis, neurotransmitters and other
small biomolecules in the brain extracellular fluid are extracted into dialysate driven slowly
through a tubular semi-permeable membrane. As the dialysate is collected and analyzed
externally, microdialysis affords the ability to detect a wider range of molecules with better
chemical selectivity. However, sampling times are typically on the order of minutes, the time
required to collect sufficient dialysate for analysis. Here we describe several novel strategies
that are currently being developed to redefine the current conventions of FSCV and
microdialysis measurements.
Basal level measurements with FSCV
Given its relevance to disorders such as Parkinson’s disease, determining the basal
level of dopamine has been a goal of microdialysis and FSCV alike. As FSCV is a
differential technique, it has required indirect approaches to approximate local extracellular
concentrations. For instance, studies have employed pharmacological methods to silence
rapidly dopamine signaling in the striatum (Kulagina et al., 2001; Borland & Michael, 2004;
15
at the electrode is assumed to represent the original baseline concentration. Others have
used kinetic and diffusion modeling to extrapolate the basal level from the transient
dopamine responses elicited by electrical stimulation (Kawagoe et al., 1992; Chen &
Budygin, 2007). While many of these studies predict the basal concentration of dopamine to
be in the lower nanomolar range others have reported values over a micromolar. Therefore
the results of these experiments remain the subject of debate.
Other measurement strategies have taken advantage of the predisposition of
dopamine to adsorb to carbon-fiber surfaces via electrostatic and pi-pi stacking interactions
(Bath et al., 2000; Heien et al., 2003). These techniques use the signals generated after
preconcentration of dopamine at the sensors as a measure of extracellular concentrations,
similar to methods employed during anodic stripping voltammetry. One such approach
involves a collector-generator-like system on a microfabricated platform (Dengler & McCarty,
2013). When operated, the potential of the outer-generator electrodes are held at ≤ 0 V to
promote the adsorption of dopamine, and are then pulsed to a positive potential to desorb
the accumulated dopamine at the surface. This repulsion creates a transient wave of
dopamine that is detected at the inner-collector electrode with FSCV, and is used to
determine the concentration of dopamine surrounding the device. Though detection of 200
nM dopamine was the lowest concentration demonstrated, the spacing of electrodes in
future generations can decreased for improved capture efficiency.
A similar approach has been developed for use with a single carbon-fiber
microelectrode (Atcherley et al., 2013). In this technique, termed fast-scan controlled
adsorption voltammetry or ‘FSCAV,’ the holding time between voltammetric scans is altered
to promote the adsorption of dopamine in a controlled manner. There are three steps to this
process. First a high-speed (1200 V/s) version of the dopamine waveform is applied at 100
Hz to reduce the amount of dopamine adsorbed to the electrode. This is followed by a
-16
0.4 V) to allow for new dopamine adsorption to occur. The waveform is then reapplied to
oxidize the dopamine accumulated on the surface. Non-faradaic current generated during
this step is removed through deconvolution techniques using an electrode response function
determined in a buffer solution. Subsequent integration of peak oxidation currents is used to
calculate the concentration of dopamine in the solution. Initial characterization reported
limits of detection under 10 nM for dopamine, well within the expected in vivo concentration
range. While performance of this sensor in the complex extracellular environment of the
brain has yet to be demonstrated, this strategy has the potential benefit of altering between
normal FSCV and FSCAV modes to measure rapid and slow dopamine changes at a single
microelectrode.
‘Ultrafast’ microdialysis
Recent work by the Kennedy group has led to the realization of the first ‘ultrafast’
microdialysis techniques. The temporal resolution of microdialysis is largely determined by
the mass limits of the detection method, with high limits requiring a larger volume of
dialysate to be collected for analysis and, in turn, longer sampling times. Therefore, coupling
microdialysis to analysis techniques with high mass sensitivity, such as capillary
electrophoresis with laser-induced fluorescence detection, greatly increases the sampling
speed (Hogan et al., 1994; Lada et al., 1997; Thompson et al., 1999). Further improvements
in temporal resolution are limited by band broadening of the sample by Taylor dispersion
during transport. Kennedy and coworkers have demonstrated that a segmented flow system
can significantly reduce the effects of Taylor dispersion (Wang et al., 2008). In their setup,
segmented flow is accomplished on an integrated PDMS chip positioned at the probe outlet,
which mixes the dialysate with fluorogenic reagents for derivatization and introduces
immiscible oil droplet to partition the dialysate into discrete nanoliter fractions. This
17
when samples are stored for offline analysis. Online analysis with a microfluidic capillary
electrophoresis chip demonstrated that this system can provide a temporal resolution of 2 s
and that it is suitable for in vivo amino acid measurements (Wang et al., 2010).
The segmented flow strategy has also been couple to low-flow push-pull perfusion to
provide fast neurochemical sampling with higher spatial resolution as sampling occurs only
at the tips of two adjoined capillaries (Slaney et al., 2011). During sampling physiological
buffer is infused through one capillary (“push”) while fluid is withdrawn through the second
capillary (“pull”) at an equal flow rate. Given the low-flow rates (~50 nL/min), which are used
to prevent tissue damage, the sampling of this technique is typically very slow. However,
endeavors to couple push-pull perfusion to the segmented flow system have produced
results suggesting that sub-second time resolution may be possible. Application of this
device in the rat striatum established that this sampling technique could follow glutamate
changes with 7 s time resolution and with an 80 fold increase in spatial resolution over
conventional microdialysis probes.
Multimodal measurements
Millar and colleagues realized soon after the introduction of in vivo electrochemical
techniques that a complete understanding of neuronal communication requires knowledge
of neurochemical release dynamics and the resulting post-synaptic cell responses. In turn
they developed a method where catecholamine release and the firing rates of single
neurons or “units” could be monitored at a carbon-fiber microelectrode by floating the
potential of the electrode between FSCV scans to detect changes in the extracellular
potential caused by cell firing (Armstrong-James et al., 1981; Millar & Barnett, 1988;
Stamford et al., 1993).
When the combined electrochemical/electrophysiological (echem/ephys) method is
18
activity through pharmacological manipulation (Belle et al., 2013). Iontophoresis is a classic
drug delivery tool where an applied current induces the flow of solution through a pulled
glass capillary via electrophoretic and electroosmotic forces (Herr & Wightman, 2013).
During echem/ephys measurements the carbon-fiber microelectrode is housed in one
capillary of a pulled multi-barrel glass assembly. The other barrels contain drug solutions
whose dispersion are controlled by a constant-current source. Iontophoresis of electroactive
species, such as dopamine, is voltammetrically detected at the carbon-fiber to determine the
ejected concentration. Iontophoresis of non-electroactive drugs is indirectly monitored
through the addition of a biologically-inert, electroactive marker (Herr et al., 2008). To
obtain an approximation of the drug introduced, the relative transport of the drug to the
marker is determined by capillary electrophoresis.
While this powerful set of tools was first employed over 30 years ago, it has only
recently been miniaturized for application in awake animals (Takmakov et al., 2011). On the
miniaturized headstage a surface mounted dual operational amplifier chip provides
voltage-follower (electrophysiological) and current transducer (electrochemical) modes, which are
controlled by a CMOS switch. During combined echem/ephys experiments, a triangular
waveform scanning between -0.4 V and +1.3 V at 400 V/s is used to detect dopamine
changes. This waveform is applied at 5 Hz, half the normal frequency, to provide ~180 ms of
electrophysiological recording between scans. Digital time stamps are used to align these
measurements with behavioral and iontophoretic events during data analysis. Detailed
descriptions of the hardware and software components of the combined technique have
been published elsewhere (Takmakov et al., 2011; Bucher et al., 2013).
Recent work with this setup has provided new insight into the role of dopamine
signaling in the nucleus accumbens (NAc), a brain region mediating motivated behaviors.
Operant paradigms such as self-administration and intracranial self-stimulation (ICSS) are
19
behaviors. During such paradigms the animal learns to complete a task such as pressing a
lever to receive a reinforcer (i.e. a reward). In the case of self-administration the reinforcer is
a drug of abuse. In ICSS the animal receives a rewarding electrical stimulation of its brain,
typically targeting dopaminergic processes. Dopamine is widely implicated in the reinforcing
components of psychostimulants and ICSS, but extent of its neuromodulatory role during
such behaviors has been debated (Murray & Shizgal, 1994; Wise, 1996; Hernandez et al.,
2006; Sunsay & Rebec, 2014).
With the combined echem/ephys technique it was found that the medium spiny
neurons (MSNs) of the NAc show patterned responses to reward prediction and
presentation during ICSS and cocaine self-administration (Cheer et al., 2007;
Owesson-White et al., 2009). The magnitude of these phasic firing activities tracked with the amount
of dopamine release detected, whereas locations with unresponsive cells exhibited no
measurable dopamine release. While this data provided strong correlation between
reward-evoked dopamine and unit responsivity, initial pharmacological investigations conducted
systemically found that dopamine receptor activation played little part in generating the MSN
firing responses observed during ICSS (Cheer et al., 2005). In a subsequent study
dopamine receptors were blocked by drug application directly into the NAc through
microinfusion and iontophoresis (Cheer et al., 2007). The dopamine D1 receptor antagonist
SCH23390 was found to block lever-pressing during ICSS with both methods of drug
delivery. However, unlike microinfusion the smaller drug volumes introduced by
iontophoresis (Kirkpatrick et al., 2014) did not affect the animals’ performance during the
task, thereby allowing the neurochemical basis of the behavior to be investigated without
influencing the behavior itself.
A more recent study found intriguing differences in the immediate and long term
effects of dopamine receptor modulation in conscious animals at rest (Belle et al., 2013).
20
NAc as 15 s ejections, during which only a small number of MSNs were found to be effected.
In contrast, long term analysis found that the baseline firing rates of most cells were either
inhibited by D1 or excited by D2 antagonism, consistent with previous literature findings
from brain slices. Interestingly, dopamine itself could evoke immediate cell responses during
electrical stimulation, where non-electroactive species such as glutamate are also released.
This highlights the role of dopamine as a neuromodulator as opposed to a classical
neurotransmitter. While not directly inhibitory or excitatory itself, dopamine can have various
effects on the overall excitability of MSNs in the NAc and can regulate the immediate actions
of glutamate in a receptor-dependent manner.
The use of the combined echem/ephys technique in awake animals is only in its
infancy; however, these early results clearly demonstrate the utility of such measurements in
delineating the post-synaptic consequences of rapid neurotransmission. The addition of
iontophoresis to this setup in future experiments will provide the unique opportunity to probe
the receptor-based underpinnings of behavior at a local circuit level.
Neurotransmitter detection in non-rodent models
The majority of in vivo electrochemical studies have been conducted in rats, mice
and, to a lesser extent, guinea pigs. Though this work has provided a great deal of our
current knowledge regarding dopamine regulation in the striatum, the translatability of this
information to other species, importantly humans, is unfortunately tentative. This limitation
has spurred attempts to expand electrochemical techniques to non-rodent species. However,
these endeavors have had varying degrees of success due to several technological and
anatomical challenges. Here we discuss efforts to apply electrochemical neurotransmitter
21 Drosophila (Fruit Flies)
Drosophila melanogaster, more commonly known as the fruit fly, is a valuable model organism given its short life span, rapid reproduction cycle, and the ease of its genetic
manipulability (Sang, 2001 ). These characteristics provide the ability to produce and screen
genetic mutations in a matter of months, whereas similar manipulations would requires
years in the rat. Although the nervous system of Drosophila is only composed of 100,000
neurons (Ito et al.), it exhibits a notable degree of genetic homology to vertebrates and
supports learning and memory (Sokolowski, 2001). Additionally, Drosophila employs many
of the same monoamine neurotransmitters as vertebrates, including dopamine and
serotonin (Monastirioti, 1999). Together its simplicity and genetic flexibility make Drosophila
an ideal platform to investigate genetic foundations of neurotransmission.
The study of neurotransmitter release in Drosophila has largely been hindered by the
size of its central nervous system (~100 µM across), which is smaller than conventional
microdialysis probes. As a result most neurotransmitter work has involved content analysis
of homogenized tissue preparations. Although microelectrodes are well-suited to probe
biological microenvironments, voltammetric detection of neurotransmission in Drosophila
presented additional challenges. First, the size of the tissue provides very little opportunity to
target discrete structures containing only a single, known electroactive neurotransmitter, as
is possible in the rat brain. A larger question was how to elicit selective neurotransmitter
release when the Drosophila nervous system is smaller than commercially available
stimulating electrodes.
Due to such issues, many FSCV measurements conducted in Drosophila have
involved the application of exogenous dopamine to study the function of the dopamine
transporter (Makos et al., 2009; Makos et al., 2010; Berglund et al., 2013). In these
experiments a live fly is immobilized in physiological buffer and dissected to expose the