Tools for the New Healthcare CMO:
Change Management Officer
Actionable Strategies for
Applying Data Analytics
+
Healthcare Enters the Big Data Era
+
Data-Driven Marketing 101
+
Where to Start
+
7 Steps to Success
+
Q & A
Today
’
s Agenda
About KishHealth System
+
Serves greater DeKalb County in northern IL
+
2 non-profit community hospitals
+
Kishwaukee Hospital
+
Valley West Hospital
+
Other affiliated facilities/services
+
KishHealth System Cancer Center at Kishwaukee Hospital
and Valley West Hospital
+
KishHealth System Center for Family Health
About True North Custom Media
+
Established in 1988
+
Partners with more than 500 healthcare
organizations nationwide to provide CRM/
data analytics, market research, and
integrated content marketing services
+
Approach to strategy is built around three
primary services—modeling, marketing,
and measurement—that provide a
comprehensive approach to healthcare
marketing and communications.
Healthcare Enters the
Big Data Era
In Case You Haven t Heard…
Big Data is HERE
Data Analytics:
It s No Longer Just For Marketers in…
+
Retail
+
Finance
+
Hospitality
+
Automotive
+
Sports and Entertainment
There is no industry more likely to be
affected by analytics in the next five to
10 years than health care.
— Jeanne Harris, co-author,
Competing on Analytics: The
New Science of Winning
and
Analytics at Work: Smarter
Decisions, Better Results
The healthcare organizations that make
the investments in analytics are going to
be the ones who end up the winners.
— Dr. Kevin Fickenscher, president and CEO of the American Medical
Informatics Association, from
Modern Healthcare
, June 17, 2013
Expert Perspective on Data Analytics
Ten years ago, few would have thought
marketing departments would be running
hospitals. Thanks to smart marketers who are
leveraging data to glean key insights and grow
their organizations, that is exactly where we
are today.
— American Hospital Association
The expanded marketing toolset — including
CRM
systems, predictive modeling,
digital marketing,
market and claims data,
marketing automation, web
content management systems, and integrated
contact centers —
offers powerful resources to help
improve clinical outcomes, reduce hospital
admissions, and improve population health.
Expert Perspective on Data Analytics
Data Analytics: Get on Board…
or Get Left Behind
+
More than 80% of marketers plan to
use analytical tools over the next 5
years (
IBM CMO Study, 2012
)
+
70% of hospitals and health
systems with 201-400 beds — and
100% with 400+ beds — are
measuring return on marketing
investment (
SHSMD By the
Data Analytics: Get on Board…
or Get Left Behind
+
59% of hospitals with 200+ beds use consultants
or outside agencies for customer relationship
management (CRM) expertise (
SHSMD By the
Numbers, 2012
)
+
43% of hospitals/health systems have increased
their CRM budgets in the past 2 years (
SHSMD By
Data-Driven
Marketing 101
Marketing Analytics Defined
•
Marketing analytics
closes the loop by
combining multiple
information sets that
allow you to target,
market, and measure
with precision
Know Your Numbers:
Core Healthcare Data Sets
+
Internal:
+
Clinical data
+
Financial data
+
Marketing/opt-in lists
+
External:
+
Consumer demographic/
psychographic data
+
Competitive market data
What questions does analytics answer?
+
What and when do I market?
[Strategic Planning]
+
Identify your best opportunities within service lines
What questions does analytics answer?
+
Who do I market to and where are they located?
(Targeting)
+
Find your ideal patients and prospects
What questions does analytics answer?
+
How do I market?
(Channel Selection & Messaging)
+
Create the most effective tactics for your service area
What questions does analytics answer?
+
How do I know it s working?
(Measurement)
+
Measure response and downstream revenue impact
Actionable Strategies for
Applying Data Analytics
1.
Drive higher service line volume and profitability
2.
Develop and deploy population health strategies
3.
Identify untapped opportunities and shape your
marketing plan
4.
Demonstrate the effectiveness of your marketing
campaigns (retroactive) and defend your future
plans/budget (proactive)
Drive Profitable Service-line Growth
+
KishHealth Joint Center
+
Joint Replacement
+
Looked at 2-plus years of consumer data on
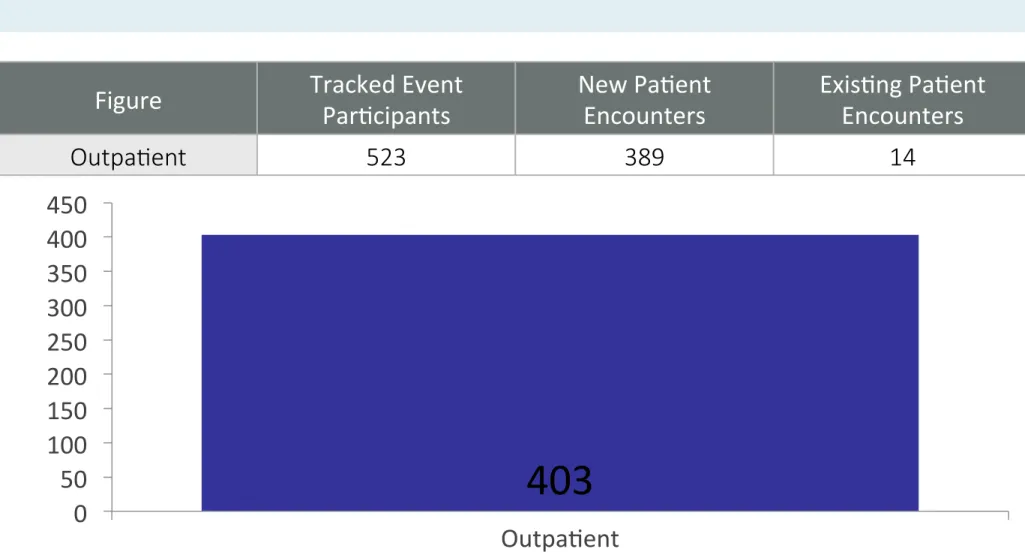
TOP LINE FIGURES
Number of Patients
Analyzed
408
Total Profit
(estimated)
$3,990,250.73
Revenue per Patient
(Overall)
$24,396.01
Profit Margin (Overall)
40%
Total Revenue
$9,953,571.67
Percent of Patients
that were Profitable
(based on profit
estimate)
47%
Total Cost (estimated)
*
$5,963,320.95
Introduction:
BREAKDOWN BY AGE
Age Range* Patient Count Percent of Total Volume Revenue Total Profit Profit Margin (%) Profit Per Patient 40 - 44 2 0.5% $33,640.65 $7,106.36 27% $3,553.18
45 - 54 36 8.8% $1,389,005.63 $881,223.92 174% $24,478.44
55 - 64 107 26.2% $4,574,717.10 $3,041,178.83 198% $28,422.23
65 + 263 64.5% $3,956,208.29 $60,741.62 2% $230.96
Total 408 100.0% $9,953,571.67 $3,990,250.73 67% $9,780.03
Notes:The age ranges between 45 - 64 contain 35% of total volume. The average profit margin for this group is 192%, with an average profit per patient of $27,429.39. Although the age range of 65+ contains 65% of total volume, the profit margin for the group is barely above break-even, likely due to low Medicare reimbursement rates. The best prospective patients to target are those between the ages of 45 and 64.
Gender Patient Count Percent of Total Volume Revenue Total Profit Profit Margin (%) Profit Per Patient Female 260 63.7% $6,113,601.83 $2,283,725.07 60% $8,783.56
Male 148 36.3% $3,839,969.84 $1,706,525.65 80% $11,530.58
Total 408 100.0% $9,953,571.67 $3,990,250.73 67% $9,780.03
Notes:Females account for 64% of total volume, while males account for 36%. However, males are more profitable (60% margin vs. 80% margin respectively). Neither gender is clearly favorable from a combined utilization and profitability perspective, so both genders should be targeted.
Profitable Segments
HH Income Bracket Patient Count Percent of Total Volume Revenue Total Profit Profit Margin (%) Profit Per Patient $0 - $20,000 41 10.0% $647,502.23 $17,242.10 2.7% $420.54 $20,001 - $30,000 26 6.4% $384,757.06 $(2,046.80) -0.5% $(78.72) $30,001 - $40,000 39 9.6% $916,283.61 $308,010.83 50.6% $7,897.71 $40,001 - $50,000 36 8.8% $645,311.28 $81,540.44 14.5% $2,265.01 $50,001 - $75,000 77 18.9% $2,345,281.46 $1,291,867.42 122.6% $16,777.50 $75,001 - $100,000 77 18.9% $1,881,055.31 $773,531.53 69.8% $10,045.86 $100,001 - $125,000 59 14.5% $1,450,308.21 $599,627.19 70.5% $10,163.17 $125,001 - $145,000 27 6.6% $817,340.54 $432,034.35 112.1% $16,001.27 $145,001 + 26 6.4% $865,731.97 $488,443.66 129.5% $18,786.29 Total 408 100.0% $9,953,571.67 $3,990,250.73 66.9% $9,780.03
Notes:Volume is spread fairly evenly across the household income spectrum. The average profit per patient jumps substantially above $50K per year. This increase is maintained throughout the upper income brackets, so we recommend targeting all income brackets above $50K per year.
Profitable Segments
Profitable Segments
Below is a chart that illustrates the channel preference among respondents to the client health system market research survey who were between the ages of 45 and 64 and had an annual household income of greater than $50K. Print has the strongest preference among the demographic group, and most other channels performed within a similar range. Mobile Device, Billboards, and Social Media comprised the lowest performing tier.
Custom Profiling: Example
•
Patient & Financial Data
+
Howard Lee
+
46 years old
+
Blue Cross Blue Shield insurance
+
Joint Replacement
+
Paid his bill in full
•
Appended Consumer Data
+
Married
+
Income
+
Couple of Kids
Market Research
+
Does not attend community events
+
Prefers Magazines
•
The Propensity Model
+46 year olds
+Income
+Married
+Couple of Kids
+Gym Membership
+Magazine Subscriber
+
Recently responded to direct mail
•
Media Habits/Preferences
+
Magazines
+
Web
Joint Center Campaign
+
True North targeted a direct mail
campaign promoting the client s Joint
Center of 6 separate deployments to
21,000 HHs total. 3 separate lists of
7,000 HHs each were used.
+
Ideal recipients closely matched past
profitable patients as determined
through advanced modeling.
+