Florida Department of Health
Division of Community Health Promotion
Bureau of Family Health Services
Refugee Health Program
Overview
The vision of the Florida Refugee Health Program (RHP) is to provide culturally sensitive health services to enhance the personal health status and self-sufficiency of those individuals eligible for federal refugee benefits. The RHP also ensures the protection of public health in Florida
through the testing and treatment of communicable diseases among the refugee1 population.
Between calendar years (CY) 2010-2012, Florida received 81,630 refugee arrivals in 44
counties of the state. Based on data collected by the Office of Refugee Resettlement for federal fiscal years 2011 and 2012, Florida received the largest number of refugee arrivals (43,184) in the nation. In comparison, California resettled 16,714 refugees while Texas resettled 15,002 refugees. New York and Michigan followed with 8,879 and 6,569 refugee arrivals, respectively.
Health Screening and Immunization Services Provided
Prior to resettlement in the U.S., refugees are required to receive an overseas medical
examination to identify communicable diseases, such as active and infectious tuberculosis (TB), which may preclude them from entering the country. Following their arrival in the U.S., refugees are eligible to receive a free refugee health assessment (RHA) and immunizations within 90 days from their date of arrival. RHAs are available through RHPs located within local health departments (LHDs). Although refugees may have received a medical examination overseas, the RHA services provided by the RHP are far more comprehensive than the current overseas examinations and assist in identifying health conditions that may keep the refugee from
successfully integrating into society. The RHA is a voluntary service, but it is beneficial for the refugee as it provides access to free immunizations, satisfies school physical requirements, and may be used for adjustment of immigration status purposes.
The services provided in conjunction with the RHA include screening for communicable and chronic diseases, pregnancy testing, mental health and domestic violence, as well as health education and immunizations. Non-English speaking patients are provided with face-to-face or telephonic interpretation.
1
For the purposes of this report the term refugee encompasses all individuals with an immigration status that is eligible for federal refugee benefits. The term refugee includes asylees, Cuban/Haitian Entrant, Iraqi/Afghan Special Immigrant Visa (SIV) holders, Amerasians, and Certified Victims of Human Trafficking.
Program Statistics
Arrivals and Screenings
The Florida RHP continually strives to attain a health screening rate of 93% for its over 28,000
eligible refugee arrivals.2 In 2010, Florida received 25,019 new arrivals eligible for refugee
health services and achieved a screening rate of 93.24%. In 2011, the number of eligible refugee arrivals was 26,041 and the RHP successfully screened 93.12% of the population. In 2012, the RHP screened 93.58% of the 30,570 eligible refugee arrivals. Between CY 2010-2012, Miami-Dade County received the largest number of refugee arrivals in the state, with the total percent of arrivals ranging between 72.6% and 74.9%. Despite the large number of refugee arrivals in Miami-Dade County, the Miami-Dade RHP maintained an average screening rate of over 93% during the three-year report period. Hillsborough, Palm Beach, Duval, Orange, Broward, Collier, Lee, and Pinellas counties received the majority of the remaining refugee arrivals. Miami-Dade, Hillsborough, Broward, Collier and Lee counties experienced an upward trend in refugee arrivals over the three-year period while Hillsborough, Palm Beach, Orange and Pinellas counties experienced some fluctuation in refugee arrivals. For a breakdown of arrivals and screenings by county, see Appendix 1.
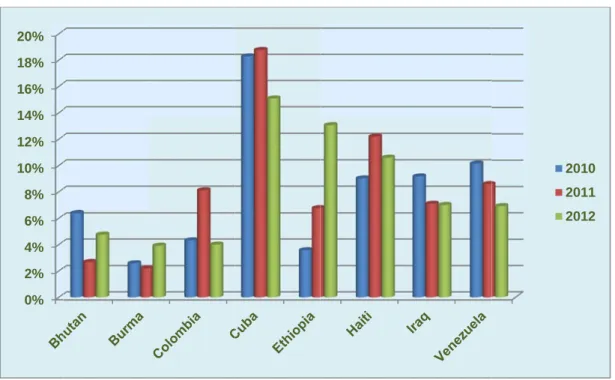
The majority of Florida’s arrivals originate from Cuba, with the annual number of arrivals ranging from 22,166 to 27,786 during the three-year report period. Haiti, Burma (officially known as Myanmar), Venezuela, Colombia, and Iraq all followed with over 100 arrivals originating from each country annually. For a breakdown of arrivals and screening by county, see Appendix 2. During the three-year report period, Cuba displayed an increasing trend in refugee arrivals. Simultaneously, arrivals originating from Haiti, Burma, Venezuela, and Colombia declined. Arrivals from Iraq fluctuated over the three-year report period, but experienced an overall
increase by 2012. Screening rates among Spanish-speaking populations originating from Cuba, Venezuela, and Colombia, as well as Iraqi and Afghani arrivals were higher than those from countries with another native language. The screening rates of individuals from Haiti and Southeast Asia were consistently low during the three-year report period. The low screening rates of Haitian clients may be attributed to their status as asylees. Asylees typically receive no assistance from refugee resettlement agencies with accessing health and social services, or completing applications for public benefits. A breakdown of the arrivals and screenings by country of origin is provided in Appendix 2.
Local RHPs make every effort to schedule clients for a RHA, but some refugees still do not seek refugee health services. The most common reasons for not receiving a RHA are due to barriers such as conflicts between the refugee’s employment and clinic operating hours, lack of
transportation, lack of knowledge about the services, and a misunderstanding about the intent of health screening services. The RH Program Office provides ongoing technical assistance and support to local RHPs to ensure they have the most culturally and linguistically appropriate outreach and education materials available for their client population.
2
In 2013, the RHP changed the percentage to strive for a higher percent (95%) of refugees being screened.
Arrival Trends Port of Entry
Most refugee arrivals in Florida enter through the Miami port of entry and resettle in Miami-Dade County. However, Florida is experiencing an increase in refugees arriving through the Chicago and New York City ports of entry. The RHP is notified in advance of traditional port of entry (i.e., international airports and seaports) refugee arrivals by the Centers for Disease Control and Prevention’s (CDC’s) Electronic Disease Notification (EDN) System. The RHP does not receive prior arrival notifications for non-traditional refugee arrivals such as primary asylees, irregular maritime arrivals, and border crossers who are eligible for refugee services. Irregular maritime arrivals and border crosser populations refer to Cuban/Haitian entrants who may have arrived via water or land (U.S./Mexico or U.S./Canada border) and have received an immigration status that deems them eligible for refugee benefits. The vast majority of Texas arrivals consisted of border-crossers. Arrivals through non-traditional ports of entry increased dramatically between 2010 and 2012. There were 338 (1.4%) non-traditional arrivals in 2010, 2,298 (8.8%) in 2011, and 8,229 (26.9%) in 2012. Non-traditional arrivals include both border-crossers and irregular maritime arrivals. Border-crossers are Cuban/Haitian entrants who may have arrived via water or land (U.S./Mexico or U.S./Canada) and have received an immigration status that deems them eligible for refugee benefits, such as public interest parole. Trends in arrivals through the
aforementioned ports of entry are shown in Table 1.
Table 1. Refugee Arrivals by Ports of Entry, CY 2010-2012, Refugee Domestic Health Assessment System (RDHAS) Data
PORT OF ENTRY 2010 2011 2012 ARRIVALS % of Total Arrivals ARRIVALS % of Total Arrivals ARRIVALS % of Total Arrivals ANCHORAGE 2 0.01% 7 0.03% 1 0.00% ARIZONA (CBP) 0 0.00% 4 0.02 34 0.11 ATLANTA 7 0.03% 13 0.05% 19 0.06% BORDER PATROL3 332 1.33% 290 1.11% 0 0.00% BOSTON 3 0.01% 1 0.00% 3 0.01% CALIFORNIA (CBP) 0 0.00% 111 0.43% 303 0.99% CHICAGO 364 1.45% 212 0.81% 185 0.61% DETROIT 3 0.01% 4 0.02% 5 0.02% EL PASO 1 0.00% 0 0.00% 9 0.03% 3
The “Border Patrol” port of entry was phased out during the reporting period and replaced by ”CBP”, which is the acronym for the U.S. Customs and Border Protection Agency. This allowed for more accurate tracking and reporting of non-traditional arrivals at maritime or land border ports of entry.
FLORIDA (CBP) 1 0.00% 120 0.46% 494 1.62% HONOLULU 0 0.00% 3 0.01% 0 0.00% HOUSTON 0 0.00% 1 0.00% 3 0.01% LOS ANGELES 235 0.94% 206 0.79% 207 0.68% MIAMI 19,205 76.76% 19,663 75.51% 20,147 65.90% MINNEAPOLIS 1 0.00% 5 0.02% 7 0.02% NEW MEXICO (CBP) 0 0.00% 5 0.02% 31 0.10% NEW YORK (CBP) 2 0.01% 86 0.33% 485 1.59%
NEW YORK CITY 732 2.93% 673 2.58% 805 2.63%
NEWARK 195 0.78% 58 0.22% 136 0.44% PUERTO RICO 116 0.46% 112 0.43% 74 0.24% SAN DIEGO 13 0.05% 47 0.18% 67 0.22% SAN FRANCISCO 10 0.04% 12 0.05% 2 0.01% SANFORD 3 0.01% 1 0.00% 8 0.03% ST. THOMAS/V.I. 14 0.06% 30 0.12% 58 0.19% SEATTLE 0 0.00% 4 0.02% 2 0.01% TAMPA 0 0.00% 0 0.00% 416 1.36% TEXAS4 3,631 14.51% 2,561 9.83% 0 0.00% TEXAS (CBP) 3 0.01% 1,682 6.46% 6,882 22.51% UNKNOWN 135 0.54% 124 0.48% 175 0.57% WASHINGTON DC 10 0.04% 4 0.02% 9 0.03% WEST PALM BEACH 1 0.00% 2 0.01% 4 0.01% TOTALS 25,019 100.00% 26,041 100.00% 30,571 100.00% Immigration Status
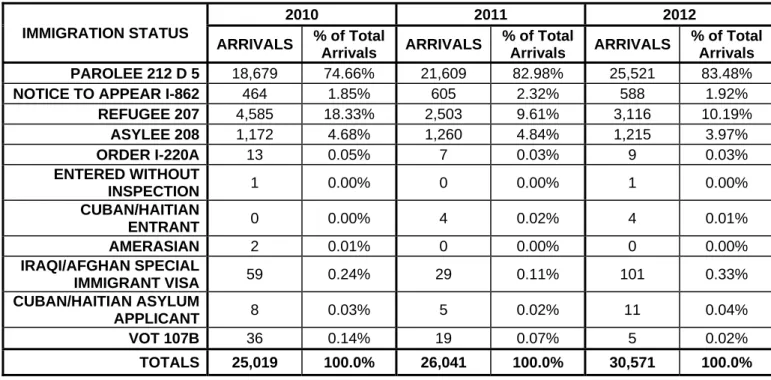
Closely related to the trends in ports of entry for refugee arrivals are the trends in the
immigration status of refugee arrivals. Although the term refugee is used throughout this report to encompass all eligible populations, there are 11 different immigration statuses represented in
Florida’s arrivals. Since 2010, parolees5 have been the largest immigration status represented
in the eligible arrival population in Florida, followed by refugees and asylees. Table 2 illustrates that parolee and refugee arrivals have been experiencing a steady increase in the percentage of total arrivals, while the Notice to Appear I-862 and Order I-220A statuses have been
decreasing. Customs and Border Patrol arrivals indicate an increase in border crossers and irregular maritime arrivals. Most of the border crossers were granted parolee status at the
4
The Texas “Border Patrol” port of entry was phased out during the reporting period and replaced by the Texas (CBP) to distinguish between traditional and non-traditional arrivals. Consequently, arrivals dropped to zero in 2012 because the arrivals were all border-crossers and processed through the Texas CBP.
5
Parolees are individuals granted entry into the U.S. for humanitarian reasons or for emergent or compelling reasons of significant public benefit.
border, which reflects a change from prior years when most of them received the Notice to Appear I-862 or I-220s. Similarly, increases in the refugee status correspond to increases in arrivals entering through Chicago and New York City, common ports of entry for refugee arrivals from Africa, Asia, and Europe. As a result of increased outreach and awareness efforts across the nation and in Florida, victims of trafficking (VOT 107B) are an emerging population that will likely continue to increase in the coming years.
Table 2. Eligible Arrivals by Immigration Status, CY 2010-2012, RDHAS Data
IMMIGRATION STATUS 2010 2011 2012 ARRIVALS % of Total Arrivals ARRIVALS % of Total Arrivals ARRIVALS % of Total Arrivals PAROLEE 212 D 5 18,679 74.66% 21,609 82.98% 25,521 83.48%
NOTICE TO APPEAR I-862 464 1.85% 605 2.32% 588 1.92%
REFUGEE 207 4,585 18.33% 2,503 9.61% 3,116 10.19% ASYLEE 208 1,172 4.68% 1,260 4.84% 1,215 3.97% ORDER I-220A 13 0.05% 7 0.03% 9 0.03% ENTERED WITHOUT INSPECTION 1 0.00% 0 0.00% 1 0.00% CUBAN/HAITIAN ENTRANT 0 0.00% 4 0.02% 4 0.01% AMERASIAN 2 0.01% 0 0.00% 0 0.00% IRAQI/AFGHAN SPECIAL IMMIGRANT VISA 59 0.24% 29 0.11% 101 0.33% CUBAN/HAITIAN ASYLUM APPLICANT 8 0.03% 5 0.02% 11 0.04% VOT 107B 36 0.14% 19 0.07% 5 0.02% TOTALS 25,019 100.0% 26,041 100.0% 30,571 100.0% Health Outcomes Tuberculosis (TB)
Approximately 8.6 million people developed TB and 1.3 million died from it in 2012 (WHO, 2014a). The Centers for Disease Control and Prevention (CDC; 2012) reported that 63% of the TB cases that occurred in the United States in 2012 were among persons born abroad (15.9 cases per 100,000), which was 11 times higher than among persons born in the U.S. (1.4 cases per 100,000). Although many people have received the TB vaccine, bacille Calmette-Guérin (BCG) in parts of the world where TB is common such as Latin America, the Caribbean, Africa, Asia, Eastern Europe, and Russia, many newly arrived refugees have been exposed to TB and have not been vaccinated. Therefore, after arriving in the United States, the RHP requires that all refugees over six months of age be tested for TB during the RHA. There are two types of TB tests: the Tuberculin skin test (TST) and a TB blood test known as interferon-gamma release assay (IGRA). With the latter, the U.S. Food and Drug Administration (FDA) has approved two
IGRA tes more reli cause a more app who test care. The over test type illustrates Figure 1 CY 2010 Ova and Refugees and para tests due parasites 24.61% o the popu parasites 32.54% i 0% 10% 20% 30% 40% 50% 60% 70% 80% 90% 100% sts,the T-SP able than TS positive skin propriate for positive for rall percenta are: TB skin s the percen . Percentag – 2012, RD Parasites s provide a s asites in their e to poor hyg s results amo of the refuge lation had a s tests increa n CY 2012. TST T ‐ SPOT® 2010 OT® and Qu STs, especia n test when t r children fro TB are refer age of positiv n test (20.04 ntage of posi ge of Positiv DHAS Data stool sample r stool. Refu giene habits ong the tota ee population bnormal ova ased again i It is importa QFT ‐ G® TST uantiFERON ally in people they are not
m the ages rred to healt
vity for all ne 4%); TB Spo itive TB tests ve Tubercu e during thei ugees often prior to rese l refugee po n tested pos a and parasi n CY 2011 t ant to note th T ‐ SPOT® QFT ‐ G® 2011 N-Gold-in-Tu e who have infected wit of six month h departmen ew arrivals in ot (6.25%); a s, by test typ losis Resul r RHA to de have abnorm ettlement. T opulation incr sitive compa tes tests. T to 38.20% of hat abnorma TST T ‐ SPOT® 201 ube® (QFT-G had a prior h TB bacter hs to five yea nt TB Clinics n Florida dur and GFT-G® pe, among s ts among S etermine if th mal results f The percenta reased dram ared to CY 20 The numbers f the refugee al results inc QFT ‐ G® 2 Sk IG T‐ Q in G®). IGRA BCG vaccin ria. Howeve ars (CDC, 20 s for treatme
ring the repo ® (5.76%). F select arrival
Select Arriva
hey have the from their ov age of abnor matically in C 009 when on s of abnorma e population clude pathog Bhutan Burma Colombia Cuba Haiti Iraq Venezuela kin Test: TST GRA Tests: ‐SPOT® and QuantiFERON‐Go n‐Tube® test results ne, which ma r, TSTs are 010). Refug ent and follow
orting period Figure 1 populations al Populatio e presence o va and paras rmal ova and CY 2010 whe nly 10.87% o al ova and n before fallin genic and no old‐ are ay gees w-up by s. ons, of ova sites d en of ng to
on-pathogen countries Figure 2 Populati Refugee Refugee 2012, the Among re of positiv 3.00%, re 2010 thro (6.45% in a signific 2012). T in Figure 0% 10% 20% 30% 40% 50% 60%
nic test resu s with high a . Percentag ions, CY 20 Children an children und e overall per efugee child ve lead scree espectively. ough 2012, w n CY 2010 to cant increase The positivity e 3. lts. The thre abnormal res ge of Abnor 10-2012, RD nd Lead Test dergo lead s rcentage of p dren originati ening results Test results while positiv o 0% in CY e in positive y rates for le ee-year trend sults are deta
rmal Ova an DHAS Data
ting
screening as positivity for ing from Hai s. Haiti and s for Burmes ve test result 2012). Iraqi lead screen ad screening d of abnorm ailed in the F nd Parasites s a routine p all newly ar iti, Iraq, Burm
Iraq had the se and Cuba ts for Haitian
i refugee chi ing results ( g among ch
mal ova and p Figure 2.
s Results am
art of the RH rrived refuge
ma, and Cub e highest pos an children w n children ex ildren were t (1.19% in CY ildren from t parasites res mong Selec HA. Betwee ee children w ba were the sitivity rates were relative xperienced a the only gro Y 2010 to 5.0 these countr
2010 2011 2012
sults for thos
ct Arrival
en CY 2010-was 1.37%. primary sou of 3.03% an ely stable fro a significant
up to experi 04% in CY ries are deta
se urce nd om drop ence ailed
Figure 3 Lead, CY Blood Pr Elevated in many r remained 16.43% o refugees Cubans d Bhutan, B Figure 4. The perc with high countries percenta 2010 to 6 blood sug The perc 0% 1% 2% 3% 4% 5% 6% 7% . Refugee C Y 2010-2012 essure and blood press refugee pop d consistent of all refugee s with high bl displaying h Burma, Colo . centage of re h blood press s where ther ge of refuge 6.66% in CY gar levels ar centage of re Burma Children fro 2, RDHAS D Blood Suga sure and blo pulations. Th over the thr es screened lood pressur igh blood pr ombia, Ethio efugees foun sure, but are re is little or n ees with elev Y 2011 to 5.4 re Bhutan, B efugees with Cuba om Select C Data r ood sugar, co he percentag ree-year repo d showing sig re is driven b essure. Rat pia, Haiti, Ira
nd to have e e still problem no access to vated blood s 45% in CY 2 Burma, Colom h elevated bl a ountries Te ommon cond ge of refugee ort period, d gns of high b by the Cuba tes are also aq, and Ven
levated bloo matic as ma o health care sugar levels 012. Count mbia, Cuba, ood sugar le Haiti esting Posit ditions found es with high despite a slig blood pressu n population high among nezuela. The od sugar leve ny of these e services or s fluctuated f ries with hig , Egypt, Hait evels are de
Iraq
tive for the
d in the U.S. h blood press
ght drop in C ure. The tot n, with nearly g refugees o
ese rates are
els are not a populations r treatment. from a low o gh percentag ti, Iran, Iraq, tailed in Fig Presence o ., are also fo sure has CY 2012, wit tal percentag y one-sixth o riginating fro e displayed as high as th originate fro The overall of 4.22% in C ges of elevat and Venezu ure 5. 2010 2011 2012 of ound h ge of of om in hose om l CY ted uela.
Figure 4 2010-201 Figure 5 CY 2010 0% 2% 4% 6% 8% 10% 12% 14% 16% 18% 20% 0% 2% 4% 6% 8% 10% 12% 14% 16% 18% 20% 4. Percentag 12, RDHAS 5. Percentag -2012, RDH ge of Arriva Data ge of Arriva HAS Data ls from Sele ls from Sele ect Countrie ect Countrie es with Hig es with Elev gh Blood Pre vated Blood 20 20 20 2010 2011 2012 essure, CY d Sugar Lev 010 011 012 vels,
Chlamyd Chlamyd U.S. and chlamydi the onse the cond between acid amp bacterial the overa from Bhu gonorrhe among n prevalen reaching Figure 6 and Gon Syphilis While sy a signific syphilis o disease d 0% 1% 2% 3% 4% 5% 6% 7%
dia and Gono dia is the mo is most pre ia are asymp t of pelvic in ition untreat the ages of plification uri STD with si all percentag utan, Burma, ea and chlam ewly arrived ce of chlamy almost 7%. 6. Percentag norrhea, CY philis is less cant risk to p often resemb difficult to de orrhea st commonly valent amon ptomatic; the flammatory ed (CDC, 20 15 and 25 o ne test for c milar presen ge of positivi , Colombia, mydia. Figur d refugees ra
ydia and gon
ge of Arriva Y 2010-2012, s prevalent in ublic health ble those of etect. Syphi y reported b ng 15-25 yea erefore, it is disease and 014). The R or with ident chlamydia an ntation and o ity for gonor
Cuba, Haiti, re 6 shows t anged from 0 norrhea amo ls from Sele , RDHAS Da n the U.S. th because it i other health lis may ultim
bacterial sexu ar-old female essential to d infertility, c RHP requires ified risk fac nd gonorrhea
outcomes; C rhea and ch
Iraq, and V hat the prev 0% to appro ong newly ar ect Countrie ata han either ch s highly con h conditions mately lead to ually transm es. Many in test newly a common adv s all sexually ctors for infec a (the secon CDC, 2014). lamydia was Venezuela ha valence of ch oximately 3% rrived Haitia es Testing hlamydia or g ntagious. Th and may go o paralysis, mitted diseas ndividuals inf arrived refug verse outcom y active fema ction to unde nd most com Between 2 s 1.91%. Re ad the highe hlamydia and %. Most nota an refugees s Positive for gonorrhea, s he signs and unnoticed, blindness, d 2010 2011 2012 e (STD) in th fected with gees to redu mes for leavi ale refugees ergo a nucle mmonly repor 010 and 201 efugees arriv est prevalenc d gonorrhea ably, the spiked in 20 r Chlamydia syphilis pres d symptoms making the dementia, or he ce ing s eic rted 12, ving ce of a 012, a sents of rgan
damage, refugees for all arr
Figure 7 2012, RD HIV HIV/AIDS people h condition especiall exploitati becoming therapy ( removed the same overseas undergo refugees illustrated 0% 2% 4% 6% 8% 10% 12% 14% and death ( s under 15 w rivals betwee . Percentag DHAS Data S continues ave been inf n was first re
y affected b ion, and gen g infected w (HAART), wh HIV from th e time, scree s visa medic HIV testing s with HIV. T d in Figure 8 (CDC, 2014b with identified en 2010 and ge of Arriva to pose a se fected with H ecognized (W y the diseas nder bias are with HIV. Du
hich has sig he list of inad ening for HIV al examinati and counse The percenta 8. b). The RHP d risk factors d 2012 was 0 als from Co erious health HIV and 36 m WHO, 2014b se. Factors s e some of th e to improve nificantly im dmissible me V was remov ion (OVME) ling. During age of arriva P requires a s to be tested 0.82%. untries Tes h threat arou million peop ). Sub-Saha such as pov e conditions ed HIV thera proved morb edical condit ved from ma . The RHP g the reportin als testing po all refugees o d. The over sting Positiv
und the world ple have died
aran Africa a verty, war, se s that increas apies such a bidity and m tions in Janu andatory scre requires all ng period, th ositive for HI
over the age rall percenta ve for Syph d. Approxim d from the vi and Southea exual abuse se refugees s highly acti mortality outc uary 2010 (C eening requ newly arrive he RHP iden IV from sele 2010 2011 2012 e of 15, and ge of positiv ilis, CY 201 mately 75 mi rus since the ast Asia are
and violenc ’ risk for ive antiretrov omes, the C CDC, 2012). irements for ed refugees t tified few ct countries vity 0-llion e ce, viral CDC At r the to are
Figure 8 RDHAS Extende Since 20 Families, program training c Managem (RHCMs in need o Duval, H needs ra for critica of educa care faci The Prev The Offic RHP in A translatio basic inte agencies interprete 0 2 4 6 8 10 12 14 16 20 20 20 . Percentag Data d Health Se 09, the RHP , Refugee Se provides fun courses, and ment Progra ) in select ar of assistance illsborough, nging from s al medical co tion to refug lities. ventive Hea ce of Refuge August 2011 on and printi erpreter train s who primar
er’s role whe % % % % % % % % % Burma 010 0% 011 0% 012 1% ge of Arriva ervices Prog P has receive ervices to im nding for a R d health ena am provides reas of the s e with acces Orange, an scheduling p onditions suc ee clients re alth Grant ee Resettlem . The grant ng, and men nings include rily serve for en working w Colombia 0% 0% 2% als from Co gram ed additiona mplement the Refugee Hea blers for new four part-tim state to prov ssing follow-u d Palm Beac primary care ch as heart d egarding the ment awarde funds basic ntal health se ed bilingual reign-born po with a client, a Cuba 0% 0% 0% untries Tes al funding fro e Extended alth Case Ma w refugee ar me and one f ide medical up medical c ch counties e or specialty disease. RH e healthcare ed funding un c interpreter t ervices in D staff membe opulations. responsibili Eritrea 0% 0% 14% sting Positiv om the Depa Health Serv anagement rrivals. The full-time refu case manag care. The ca to assist ref y care appoi HCMs also p system, hea
nder the Pre trainings thr uval County ers from LHD
The training ties and pro
Haiti 0% 0% 4% ve for HIV, C artment of C vices Program Program, ba Refugee He ugee health c gement serv ase manage fugees with a ntments to c provide a sig alth insuranc eventive Hea roughout the y, Florida. P Ds and refug gs focused o ofessional et CY 2010-20 hildren and m (EHSP). asic interpre ealth Case case manag vices to refug ers are locat
a variety of coordinating gnificant amo ce, and heal
alth Grant to e state, docu articipants in gee resettlem on the hics, dynam 12, The eter gers gees ed in care ount th the ument n the ment mics
of cross-cultural interaction, business practices, state, federal and agency legislation, and cultural competency. The mental health services supported by the grant are limited to Duval County, Florida, which receives the most diverse populations of refugee arrivals in the state. The Healing Project provides mental health orientation to refugees at resettlement agencies in Duval County and provides mental health counseling to refugees with identified mental health conditions.
Appendix 1
Refugee Arrivals by County, CY 2010, RDHAS
COUNTY ARRIVALS % Total
Arrivals SCREENINGS % of Arrivals Screened ALACHUA 15 0.06% 12 80.00% BAY 9 0.04% 9 100.00% BREVARD 22 0.09% 20 90.91% BROWARD 576 2.30% 534 92.71% CHARLOTTE 20 0.08% 20 100.00% CITRUS 1 0.00% 1 100.00% CLAY 11 0.04% 0 0.00% COLLIER 415 1.66% 398 95.90% MIAMI-DADE 18,169 72.62% 17,365 95.57% DUVAL 1,120 4.48% 958 85.54% ESCAMBIA 11 0.04% 10 90.91% FLAGLER 20 0.08% 20 100.00% GLADES 4 0.02% 4 100.00% HENDRY 19 0.08% 1 5.26% HERNANDO 9 0.04% 6 66.67% HIGHLANDS 5 0.02% 1 20.00% HILLSBOROUGH 1,795 7.17% 1,455 81.06% INDIAN RIVER 3 0.01% 2 66.67% LAKE 17 0.07% 12 70.59% LEE 261 1.04% 188 72.03% LEON 5 0.02% 4 80.00% MADISON 1 0.00% 0 0.00% MANATEE 45 0.18% 45 100.00% MARION 17 0.07% 5 29.41% MARTIN 1 0.00% 1 100.00% MONROE 88 0.35% 83 94.32% OKEECHOBEE 4 0.02% 3 75.00% ORANGE 665 2.66% 604 90.83% OSCEOLA 93 0.37% 83 89.25%
Refugee Arrivals by County, CY 2010, RDHAS
COUNTY ARRIVALS % Total
Arrivals SCREENINGS % of Arrivals Screened PALM BEACH 974 3.89% 885 90. 86% PASCO 41 0.16% 39 95.12% PINELLAS 228 0.91% 223 97.81% POLK 65 0.26% 61 93.85% SAINT JOHNS 3 0.01% 3 100.00% SAINT LUCIE 35 0.14% 31 88.57% SARASOTA 98 0.39% 92 93.88% SEMINOLE 126 0.50% 126 100.00% SUWANNEE 3 0.01% 3 100.00% VOLUSIA 25 0.10% 20 80.00% TOTALS 25,019 100.00% 23,327 93.24%
Refugee Arrivals by County, CY 2011, RDHAS
COUNTY ARRIVALS % Total
Arrivals SCREENINGS % of Arrivals Screened ALACHUA 8 0.03% 7 87.50% BAY 3 0.01% 3 100.00% BREVARD 14 0.05% 13 92.86% BROWARD 730 2.80% 675 92.47% CHARLOTTE 14 0.05% 7 50.00% CLAY 4 0.02% 1 25.00% COLLIER 460 1.77% 438 95.22% MIAMI-DADE 19,510 74.92% 18,516 94.91% DUVAL 862 3.31% 790 91.65% ESCAMBIA 17 0.07% 10 58.82% FLAGLER 12 0.05% 9 75.00% GLADES 13 0.05% 13 100.00% HENDRY 12 0.05% 6 50.00% Continued
Refugee Arrivals by County, CY 2011, RDHAS
COUNTY ARRIVALS % Total
Arrivals SCREENINGS % of Arrivals Screened HERNANDO 12 0.05% 12 100.00% HIGHLANDS 10 0.04% 3 30.00% HILLSBOROUGH 1,627 6.25% 1,318 81.01% LAKE 11 0.04% 7 63.64% LEE 302 1.16% 273 90.40% LEON 3 0.01% 2 66.67% LEVY 1 0.00% 0 0.00% MANATEE 25 0.10% 25 100.00% MARION 16 0.06% 13 81.25% MONROE 104 0.40% 95 91.35% OKEECHOBEE 8 0.03% 7 87.50% ORANGE 641 2.46% 565 88.14% OSCEOLA 111 0.43% 108 97.30% PALM BEACH 919 3.53% 810 88.14% PASCO 50 0.19% 44 88.00% PINELLAS 200 0.77% 194 97.00% POLK 87 0.33% 59 67.82% SAINT JOHNS 1 0.00% 0 0.00% SAINT LUCIE 41 0.16% 24 58.54% SARASOTA 104 0.40% 96 92.31% SEMINOLE 94 0.36% 94 100.00% SUMTER 1 0.00% 0 0.00% SUWANNEE 4 0.02% 3 75.00% VOLUSIA 10 0.04% 10 100.00% TOTALS 26,041 100.00% 24,250 93.12% Continued
Refugee Arrivals by County, CY 2012, RDHAS
COUNTY ARRIVALS % Total
Arrivals SCREENINGS % of Arrivals Screened ALACHUA 9 0.03% 9 100.00% BAY 3 0.01% 2 66.67% BREVARD 26 0.09% 24 92.31% BROWARD 729 2.38% 694 95.20% CHARLOTTE 10 0.03% 10 100.00% CLAY 1 0.00% 0 0.00% COLLIER 531 1.74% 518 97.55% COLUMBIA 1 0.00% 0 0.00% MIAMI-DADE 22,485 73.55% 21,073 93.72% DUVAL 1,048 3.43% 961 91.70% ESCAMBIA 31 0.10% 20 64.52% FLAGLER 16 0.05% 16 100.00% GLADES 3 0.01% 3 100.00% GULF 1 0.00% 1 100.00% HENDRY 35 0.11% 34 97.14% HERNANDO 9 0.03% 9 100.00% HIGHLANDS 7 0.02% 2 28.57% HILLSBOROUGH 1,848 6.05% 1,740 94.16% INDIAN RIVER 8 0.03% 2 25.00% LAKE 7 0.02% 5 71.43% LEE 449 1.47% 374 83.30% LEON 10 0.03% 8 80.00% LEVY 2 0.01% 2 100.00% MADISON 3 0.01% 2 66.67% MANATEE 44 0.14% 44 100.00% MARION 14 0.05% 13 92.86% MONROE 160 0.52% 151 94.38% OKALOOSA 3 0.01% 0 0.00% ORANGE 862 2.82% 809 93.85% OSCEOLA 193 0.63% 178 92.23%
Refugee Arrivals by County, CY 2012, RDHAS
COUNTY ARRIVALS % Total
Arrivals SCREENINGS % of Arrivals Screened PALM BEACH 1,203 3.94% 1,115 92.68% PASCO 61 0.20% 58 95.08% PINELLAS 386 1.26% 382 98.96% POLK 71 0.23% 68 95.77% SAINT JOHNS 4 0.01% 2 50.00% SAINT LUCIE 33 0.11% 27 81.82% SARASOTA 94 0.31% 85 90.43% SEMINOLE 158 0.52% 158 100.00% TAYLOR 2 0.01% 0 0.00% VOLUSIA 10 0.03% 7 70.00% TOTALS 30,570 100.00% 28,606 93.58% Continued
Appendix 2
Refugee Arrivals by Country of Origin, CY 2010, RDHAS
COUNTRY OF ORIGIN ARRIVALS
% of Total Arrivals SCREENINGS % of Arrivals Screened AFGHANISTAN 13 0.05% 13 100.00% ALBANIA 1 0.00% 1 100.00% AZERBAIJAN 1 0.00% 1 100.00% BELARUS 4 0.02% 2 50.00% BHUTAN 143 0.57% 130 90.91% BOLIVIA 4 0.02% 3 75.00% BULGARIA 1 0.00% 0 0.00% BURMA 674 2.69% 525 77.89% BURUNDI 6 0.02% 5 83.33% CAMBODIA 1 0.00% 1 100.00% CAMEROON 8 0.03% 6 75.00% CHAD 1 0.00% 1 100.00% CHINA 50 0.20% 21 42.00% COLOMBIA 200 0.80% 191 95.50% CONGO 34 0.14% 33 97.06% CUBA 22,166 88.60% 20,900 94.29% CZECHOSLOVAKIA 1 0.00% 1 100.00% DEM. REP. OF CONGO 3 0.01% 3 100.00% DJIBOUTI 1 0.00% 1 100.00% ECUADOR 2 0.01% 2 100.00% EGYPT 13 0.05% 12 92.31% EL SALVADOR 6 0.02% 5 83.33% ERITREA 11 0.04% 11 100.00% ESTONIA 4 0.02% 4 100.00% ETHIOPIA 60 0.24% 56 93.33% GHANA 4 0.02% 4 100.00% GUATEMALA 6 0.02% 0 0.00% HAITI 721 2.88% 572 79.33% Continued
Refugee Arrivals by Country of Origin, CY 2010, RDHAS
COUNTRY OF ORIGIN ARRIVALS
% of Total Arrivals SCREENINGS % of Arrivals Screened HONDURAS 1 0.00% 1 100. 00% HUNGARY 1 0.00% 0 0.00% INDIA 4 0.02% 2 50.00% IRAN 26 0.10% 26 100.00% IRAQ 451 1.80% 417 92.46% JORDAN 8 0.03% 7 87.50% KAZAKHSTAN 10 0.04% 10 100.00% KENYA 14 0.06% 12 85.71% KUWAIT 1 0.00% 1 100.00% LEBANON 8 0.03% 8 100.00% LIBERIA 2 0.01% 1 50.00% MAURITANIA 1 0.00% 1 100.00% MEXICO 5 0.02% 5 100.00% MOLDOVA 2 0.01% 2 100.00% MOZAMBIQUE 2 0.01% 2 100.00% NICARAGUA 8 0.03% 5 62.50% NIGERIA 1 0.00% 1 100.00% PERU 4 0.02% 4 100.00% PHILIPPINES 1 0.00% 1 100.00% RUSSIA 17 0.07% 14 82.35% RWANDA 4 0.02% 4 100.00% SENEGAL 2 0.01% 2 100.00% SOMALIA 3 0.01% 3 100.00% SOUTH AFRICA 1 0.00% 1 100.00% SUDAN 11 0.04% 11 100.00% SYRIA 1 0.00% 0 0.00% TANZANIA 20 0.08% 20 100.00% TOGO 1 0.00% 1 100.00% TURKEY 3 0.01% 1 33.33% UKRAINE 14 0.06% 12 85.71% ContinuedContinued
Refugee Arrivals by Country of Origin, CY 2010, RDHAS
COUNTRY OF ORIGIN ARRIVALS
% of Total Arrivals SCREENINGS % of Arrivals Screened UNKNOWN 3 0.01% 3 100.00% VENEZUELA 230 0.92% 227 98.70% VIETNAM 15 0.06% 13 86.67% YEMEN 2 0.01% 2 100.00% ZAMBIA 3 0.01% 3 100.00% TOTALS 25,019 100.00% 23,327 93.24%
Refugee Arrivals by Country of Origin, CY 2011, RDHAS
COUNTRY OF ORIGIN ARRIVALS % of Total Arrivals SCREENINGS % of Arrivals Screened AFGHANISTAN 8 0.03% 8 100.00% AZERBAIZAN 1 0.00% 1 100.00% BELARUS 1 0.00% 0 0.00% BHUTAN 83 0.32% 79 95.18% BOLIVIA 12 0.05% 10 83.33% BRAZIL 1 0.00% 1 100.00% BURMA 611 2.35% 527 86.25% BURUNDI 1 0.00% 1 100.00% CAMBODIA 1 0.00% 1 100.00% CAMEROON 6 0.02% 6 100.00% CENTRAL AFRICAN REP. 1 0.00% 1 100.00% CHINA 8 0.03% 7 87.50% COLOMBIA 125 0.48% 115 92.00% CONGO 24 0.09% 23 95.83% COSTA RICA 4 0.02% 3 75.00% CUBA 23,596 90.61% 22,162 93.92% DEM. REP. OF CONGO 3 0.01% 3 100.00% ECUADOR 8 0.03% 7 87.50% EGYPT 23 0.09% 20 86.96% Continued
Refugee Arrivals by Country of Origin, CY 2011, RDHAS COUNTRY OF ORIGIN ARRIVALS % of Total Arrivals SCREENINGS % of Arrivals Screened ERITREA 18 0.07% 18 100.00% ETHIOPIA 84 0.32% 77 91.67% GERMANY 1 0.00% 1 100.00% GUATEMALA 6 0.02% 6 100.00% HAITI 717 2.75% 513 71.55% HONDURAS 7 0.03% 3 42.86% INDIA 2 0.01% 2 100.00% IRAN 59 0.23% 56 94.92% IRAQ 149 0.57% 141 94.63% IVORY COAST 1 0.00% 0 0.00% JORDAN 2 0.01% 2 100.00% KENYA 5 0.02% 5 100.00% KUWAIT 1 0.00% 1 100.00% KYRGYZSTAN 1 0.00% 1 100.00% LIBERIA 6 0.02% 6 100.00% LIBYA 1 0.00% 1 100.00% MEXICO 9 0.03% 9 100.00% MOLDOVA 2 0.01% 2 100.00% NICARAGUA 2 0.01% 0 0.00% PERU 1 0.00% 1 100.00% PHILIPPINES 4 0.02% 4 100.00% RUSSIA 23 0.09% 21 91.30% RWANDA 6 0.02% 6 100.00% SOUTH AFRICA 1 0.00% 1 100.00% SUDAN 20 0.08% 20 100.00% SYRIA 3 0.01% 3 100.00% TANZANIA 2 0.01% 2 100.00% TURKMENISTAN 2 0.01% 0 0.00% UKRAINE 25 0.10% 21 84.00% UNITED ARAB EMIRATES 1 0.00% 1 100.00% UNKNOWN 3 0.01% 3 100.00% UZBEKISTAN 4 0.02% 4 100.00% VENEZUELA 355 1.36% 343 96.62% Continued
Refugee Arrivals by Country of Origin, CY 2011, RDHAS COUNTRY OF ORIGIN ARRIVALS % of Total Arrivals SCREENINGS % of Arrivals Screened ZAMBIA 1 0.00% 1 100.00% TOTALS 26,041 100.00% 24,250 93.12%
Refugee Arrivals by Country of Origin, CY 2012, RDHAS COUNTRY OF ORIGIN ARRIVALS % of Total Arrivals SCREENINGS % of Arrivals Screened AFGHANISTAN 21 0.07% 21 100.00% ALGERIA 1 0.00% 1 100.00% ANGOLA 1 0.00% 0 0.00% BELARUS 5 0.02% 5 100.00% BHUTAN 93 0.30% 93 100.00% BOLIVIA 3 0.01% 3 100.00% BULGARIA 2 0.01% 2 100.00% BURMA 492 1.61% 401 81.50% CAMBODIA 1 0.00% 1 100.00% CAMEROON 3 0.01% 0 0.00% CHINA 15 0.05% 7 46.67% COLOMBIA 161 0.53% 157 97.52% CONGO 29 0.09% 26 89.66% CUBA 27,786 90.89% 26,105 93.95% DEM. REP. OF CONGO 3 0.01% 3 100.00% DJIBOUTI 3 0.01% 2 66.67% ECUADOR 2 0.01% 2 100.00% EGYPT 201 0.66% 201 100.00% EL SALVADOR 3 0.01% 2 66.67% ERITREA 17 0.06% 17 100.00% ETHIOPIA 75 0.25% 71 94.67% GERMANY 1 0.00% 0 0.00% GUATEMALA 1 0.00% 1 100.00% HAITI 511 1.67% 424 82.97% Continued
Refugee Arrivals by Country of Origin, CY 2012, RDHAS COUNTRY OF ORIGIN ARRIVALS % of Total Arrivals SCREENINGS % of Arrivals Screened HONDURAS 11 0.04% 11 100.00% HUNGARY 1 0.00% 1 100.00% INDIA 3 0.01% 3 100.00% IRAN 20 0.07% 17 85.00% IRAQ 540 1.77% 491 90.93% JORDAN 23 0.08% 23 100.00% KENYA 4 0.01% 2 50.00% KUWAIT 5 0.02% 5 100.00% KYRGYZSTAN 4 0.01% 4 100.00% LEBANON 2 0.01% 2 100.00% LIBYA 2 0.01% 2 100.00% MEXICO 4 0.01% 3 75.00% MOLDOVA 1 0.00% 1 100.00% NICARAGUA 1 0.00% 0 0.00% PAKISTAN 8 0.03% 8 100.00% PHILIPPINES 5 0.02% 5 100.00% RUSSIA 31 0.10% 29 93.55% SOMALIA 26 0.09% 21 80.77% SRI LANKA 1 0.00% 1 100.00% SUDAN 56 0.18% 55 98.21% SYRIA 14 0.05% 13 92.86% TANZANIA 2 0.01% 2 100.00% TURKEY 1 0.00% 0 0.00% TURKMENISTAN 1 0.00% 0 0.00% UGANDA 6 0.02% 4 66.67% UKRAINE 6 0.02% 6 100.00% UNITED ARAB EMIRATES 1 0.00% 1 100.00% UNKNOWN 2 0.01% 2 100.00% UZBEKISTAN 2 0.01% 2 100.00% VENEZUELA 350 1.14% 345 98.57% WEST BANK 4 0.01% 0 0.00% YEMEN 3 0.01% 2 66.67% TOTALS 30,570 100.00% 28,606 93.58% Continued
References
Centers for Disease Control and Prevention (CDC). (2010). Guidelines for screening for tuberculosis infection and disease during the domestic medical examination for newly arrived refugees. Retrieved from
http://www.cdc.gov/immigrantrefugeehealth/guidelines/domestic/tuberculosis-guidelines.html.
Centers for Disease Control and Prevention (CDC). (2012). Immigrant and refugee health: Screening for HIV infection during the refugee domestic medical examination. Retrieved
from
http://www.cdc.gov/immigrantrefugeehealth/guidelines/domestic/screening-hiv-infection-domestic.html.
Centers for Disease Control and Prevention (CDC). (2013). Fact sheet: Trends in tuberculosis, 2012. Retrieved from
http://www.cdc.gov/tb/publications/factsheets/statistics/TBTrends.htm.
Centers for Disease Control and Prevention (CDC). (2014a). Refugee health guidelines: Chlamydia. Retrieved from
http://www.cdc.gov/immigrantrefugeehealth/guidelines/domestic/sexually-transmitted-diseases/chlamydia.html.
Centers for Disease Control and Prevention (CDC). (2014b). Syphilis: CDC fact sheet.
Retrieved from http://www.cdc.gov/sTD/syphilis/STDFact-Syphilis.htm.
World Health Organization. (2014a). Data and statistics: Tuberculosis. Retrieved from
http://www.who.int/research/en/.