IMMEDIATE EFFECTS OF ACUTE EXPERIMENTAL WEIGHT GAIN ON FEMORAL ARTICULAR CARILAGE DEFORMATION FOLLOWING WALKING
Cassie Ann Perrella
A thesis submitted to the faculty of the University of North Carolina at Chapel Hill in partial fulfillment of the requirements for the degree of Master of Arts in the Department
of Exercise and Sport Science (Athletic Training) in the College of Arts & Sciences.
Chapel Hill 2018
ABSTRACT
Cassie Ann Perrella: Immediate Effects of Acute Experimental Weight Gain on Femoral Articular Cartilage Deformation Following Walking
(Under the direction of Brian Pietrosimone)
The hallmark characteristic of knee osteoarthritis (OA) is a decline in cartilage health.1 Weight gain increases joint stress and is a primary risk factor for OA.2,3,4 The purpose of this study was to compare the change in femoral articular cartilage cross-sectional area (ΔCSA) following a non-weighted versus weighted walking protocol, and to determine the association between ΔCSA and QBM. ΔCSA was measured using a diagnostic ultrasound before and after walking. We found no significant difference in
ΔCSA between conditions. QBM was not associated with ΔCSA in the non-weighted (r=0.027, ∆R2 = 0.004, p = 0.731) or weighted (r=0.046, ∆R2 = 0.003, p = 0.762) conditions. Participants responded to non-weighted walking by remaining constant, decreasing, or increasing in CSA and were placed into groups. We found a significant interaction effect for ΔCSA between groups and condition (F2,29 = 6.384, p = 0.005),
TABLE OF CONTENTS
LIST OF TABLES ... vi
LIST OF FIGURES ... vii
LIST OF ABBREVIATIONS ... viii
CHAPTER I: INTRODUCTION ... 1
CHAPTER II: LITERATURE REVIEW ... 4
Introduction ... 4
Changes in Body Mass ... 5
Body Mass Index ... 5
Knee Loading ... 6
Walking Speed ... 7
Imaging ... 8
Radiography ... 8
Magnetic Resonance Imaging ... 9
Ultrasonography ... 9
Quadriceps Strength ... 11
Self-Reported Function ... 11
Gait and Biomechanics ... 12
Resisting Load ... 13
Design ... 16
Participants ... 16
Data Collection Procedures ... 17
Body Mass Index ... 17
Quadriceps Strength ... 18
Walking Speed ... 19
Loading conditions ... 19
Ultrasonography of Medial and Lateral Femoral Articular Cartilage ... 20
Analysis of Femoral Articular Cartilage US Images ... 22
Statistical Analysis ... 23
Post-Hoc Analysis ... 23
CHAPTER IV: RESULTS ... 25
Participants ... 25
Femoral Cartilage Cross-Sectional Area Using Ultrasonography ... 25
Association Between Strength and Change in Femoral Cartilage Cross-Sectional Area ... 26
Post-Hoc Analyses ... 26
CHAPTER V: DISCUSSION ... 29
Femoral Cartilage Adaptations to Exercise ... 29
Image Analysis and Blinding ... 31
Walking Kinematics ... 33
Limitations ... 34
Conclusion ... 35
LIST OF TABLES
LIST OF FIGURES
Figure 1. Patient Positioning For US Assessment of Femoral
Articular Cartilage Cross-Sectional Area ... 22 Figure 2. Femoral Articular Cartilage Cross-Sectional Area
Outcome Measurement Using ImageJ ... 23 Figure 3. Condition x Group Interaction for Femoral
LIST OF ABBREVIATIONS
ACLR Anterior Cruciate Ligament Reconstruction ANOVA Analyses of Variance
BMI Body Mass Index CSA Cross-Sectional Area EMG Electromyography HST Heel Strike Transient
IPAQ International Physical Activity Questionnaire JSN Joint Space Narrowing
JSW Joint Space Width
MDC Minimal Detectable Change MET Metabolic Equivalent of Task MRI Magnetic Resonance Imaging
MVIC Maximal Voluntary Isometric Contraction NWD Non-Weighted Decrease
NWI Non-Weighted Increase
NWNC Non-weighted No-Change
OA Osteoarthritis
QBM Quadriceps Strength Normalized to Body Mass QLSI Quadriceps Strength Limb Symmetry Index RTD Rate of Torque Development
US Ultrasonography
vGRF Vertical Ground Reaction Force
CHAPTER I: INTRODUCTION
Knee osteoarthritis (OA) is a progressive disease that is associated with structural changes to the articular cartilage, subchondral bone, and synovium of a joint.1 Knee OA is the end result of a complex individualized collection of multiple etiologies including changes to subchondral bone, synovitis, and soft tissue injuries; yet, poor articular cartilage heath is a key characteristic of the knee OA pathogenesis.1,3 An increase in
non-lean body mass is one of the leading risk factors for knee OA onset.2 It has been
hypothesized that increased non-lean body mass increases the compressive forces exerted on the tissues of the knee.2,3 Therefore, obesity may amplify the total compressive load experienced at the knee during activities of daily living, such as walking and may predispose individuals to developing OA.4,5
Previous studies have demonstrated that obesity increases joint stress, thus
making the articular cartilage of the knee more vulnerable to compressive forces.6–8 Knee articular cartilage is viscoelastic,9 making it sensitive to rapid increases in load. Due to this inherent property, articular cartilage lacks the ability to conform quickly to higher loading rates caused by weight gain.5 Ultimately, viscoelasticity may cause the cartilage
to stiffen over time, thus increasing its vulnerability to breakdown and eventual
failure.1,5,9 Total failure of articular cartilage denotes permanent deformation, indicating a decrease in overall health of the cartilage.1 To measure these structural changes in
femoral cartilage deformation, as well as a reliable measurement to estimate cartilage thickness and cross-sectional area (CSA).10 Currently, no other studies have assessed cartilage deformation after an acute artificial weight gain. Gathering this information will provide clinicians insight into potential prevention strategies to reduce permanent
cartilage deformation and may help to reduce the incidence of OA.
Another important consideration in the prevention and management of knee OA is quadriceps strength.1,4,5 During walking gait, the quadriceps contract eccentrically to attenuate energy exerted to joints of the lower limb.3 Specifically, the quadriceps musculature acts to control knee flexion during the early stance phase of gait, thereby allotting more time to absorb the loads placed on the knee joint and potentially lessening the compressive forces on the tibiofemoral cartilage.4,5 It has been hypothesized that
stronger quadriceps musculature is imperative for lessening the compressive forces exerted on the tibiofemoral cartilage.4,5 Greater quadriceps strength normalized to body mass is a strong predictor of high physical function.11 As non-lean body mass increases, QBM ratios typically decrease, thus promoting premature fatigue of the quadriceps and disrupting the ability to effectively attenuate forces at the knee during loading tasks.4,5
Although the association between quadriceps strength and knee OA has been studied in the past,11 the effects of increased body mass and QBM ratios on cartilage deformation are currently unknown. To begin to fill this gap in the literature, we modeled an acute, non-lean weight gain of 20% of each participant’s total body mass and evaluated its immediate effect on cartilage CSA.
walking protocol. We hypothesized that the weighted condition would result in a
greater ∆CSA when compared to the non-weighted condition. The secondary aim of this study was to identify the association between QBM and ∆CSA following a weighted and non-weighted walking protocol. We hypothesized that individuals with higher quadriceps strength will demonstrate smaller ∆CSA in both the non-weighted and weighted walking condition.
CHAPTER II: LITERATURE REVIEW
Introduction
By definition, osteoarthritis is a degenerative disease caused by the gradual loss of articular cartilage within synovial joints, including the hips, knees, hands, feet, and
spine.12 Patients with this disorder often experience joint pain, tenderness, movement limitations, and inflammation.12 OA is the most common form of arthritis and commonly affects the hand, hip, and knee joints.13 This degenerative disease has been estimated to
effect 10% of men and 18% of women worldwide.12 OA has also been deemed the leading cause for lower extremity disabilities in elderly populations.3 Although the exact cause of this disease is still unknown, researchers have found that some of the key risk factors associated with the development of this condition are age, gender, quadriceps strength, and obesity.2,3
One of the primary risk factors for both the development and advancement of OA is weight gain and obesity.13,14 Although researchers have studied the effects of weight loss on self-reported function and loading at the tibiofemoral joint in OA patients 7,15,16, no research addresses how increasing body mass directly influences the compression of the articular cartilage at the knee. As a prelude to this study, this literature review will address three major topic areas: changes in body mass and its effect on lower extremity joint loading, the use of diagnostic ultrasound to assess articular cartilage and
Changes in Body Mass
Body Mass Index
Body Mass Index (BMI) is traditionally used to classify individuals by relative body fat. Individuals with a BMI between 18.0-24.9 are considered to be normal weight while those with a BMI of 25.0 or above are considered overweight or obese.17 Previous studies have demonstrated that individuals with higher BMI are at a heightened risk of developing OA due to an increase in compressive forces experienced at the knee
joint.6,18,19 Research has revealed that there is a relationship between increased BMI and the risk of developing osteoarthritis.13 Felson reported that the risk of developing OA is 1.5 to 2 times more likely in obese individuals than in those with a BMI within the normal range.13,14 Furthermore, Fowler found that patients that increase their BMI by 5 kg/m2, increase their risk for developing OA by approximately 32-35%.20 Collectively, these studies show the relationship between increases in BMI and the development of OA. Although BMI is a reliable measure, it lacks the ability to quantify aspects of body composition outside of the realm of height and weight.
Although BMI is moderately correlated with body fat percentage in non-athletic populations, these classifications lose their validity when working with athletes.21 Athletic populations typically have lower body fat percentages and greater amounts of muscle mass. Because BMI only takes into consideration and individual’s height and body mass, it often incorrectly categorizes athletes as overweight or obese due to the higher density of muscle compared to fat.21
higher muscle mass in previous studies may have been considered overweight or obese based on their BMI alone, thus it is important to address which adaptations and
compensations are due to added fat mass rather than muscle mass.
Knee Loading
Articular cartilage helps to facilitate shock absorption and limit shear forces at the knee. The cartilage is viscoelastic, making it sensitive to rapid increases in load. Because the cartilage lacks pliability, it is unable to conform quickly and is susceptible to failure during sudden load increases.5,9 Research has demonstrated that obesity can increase joint stress, thus making the articular cartilage of the knee more vulnerable to compressive forces.6–8
Due to the strong link between obesity and compressive forces on the cartilage, weight loss has become an integral part of both the preventive and rehabilitative treatment of OA.16,22 As patients increase their body mass, their maximal knee flexion angle during the stance phase of gait is decreased. This loss of motion decreases the body’s ability to absorb load and increasing the total load at the knee joint.5
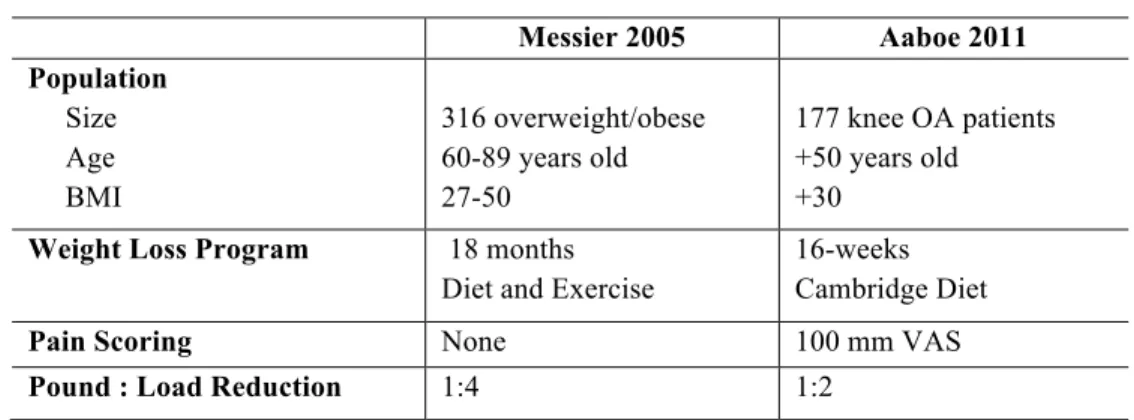
Several studies have determined that weight loss reduces compressive forces at the knee joint; however, there is not a clear consensus on the exact ratio of weight loss to load reduction.7,8,16 Two studies in particular have looked into this ratio (Table 1).
researchers relied on statistical estimations of the peak compression loads, instead of physical changes in the articular cartilage itself. By measuring the direct effects of weight gain on cartilage, this study will be able to provide a more accurate depiction of the weight loss to load reduction ratio.
Table 1. Messier and Aaboe Comparison
Messier 2005 Aaboe 2011 Population
Size Age BMI
316 overweight/obese 60-89 years old 27-50
177 knee OA patients +50 years old +30
Weight Loss Program 18 months Diet and Exercise
16-weeks Cambridge Diet
Pain Scoring None 100 mm VAS
Pound : Load Reduction 1:4 1:2
Walking Speed
Another factor that researchers have extensively looked into is the functional abilities of OA patients. Studies indicate that there is a correlation between self-reported function and weight loss.5,22,23 Investigators have discovered that obese OA patients typically have a slower self-selected speed before undergoing weight loss programs. When given the option to select a walking speed, overweight individuals typically walk at 1.1 m/s, while normal weight individuals walk at 1.4 m/s.24 Researchers suggest that slower walking speeds may be a compensatory mechanism to allow additional time for the soft tissue to absorb the increased load created by weight gain. By increasing the total load absorption time, the rate of loading is decreased, thus decreasing the overall stress on the articular cartilage.5,6,24
assess their level of self-reported function.16,22 The question that results from these
studies, however, is which variable acted as the cause and which acted as the effect. Some researchers believe that the pain associated with OA is intolerable, thus leading to an overall decrease in physical activity, creating a rise in BMI. This causes an increase in the compressive forces, which only exacerbates the condition.16,22 Others believe that obesity initiates OA by creating increased loading at the knee joint, thus compressing the articular cartilage and leading to degeneration over time.16,22
Imaging
Radiography
Currently, radiography is the gold standard for identifying and assessing the progression of osteoarthritis. Because it is simplistic and inexpensive, it is often the modality of choice to assess joint space width (JSW) at the knee.25 Radiographs are able to provide researchers with a two-dimensional visual representation of the bony
structures at the knee joint, from which investigators are then able to objectively measure joint space narrowing (JSN) between the tibia and the femur. The decline in overall joint space is one of the hallmark signs of OA progression and is a key diagnostic for total knee replacement.25,26
Although radiography accurately represents bony features, it lacks the sensitivity and specificity to differentiate soft tissue structures.25–27 JSW is often directly associated
with a decrease in hyaline articular cartilage; however, articular cartilage is not the only soft tissue structure occupying the space between the tibia and femur. The meniscus is a key component at the knee joint and is not accounted for on a basic radiograph.27
cartilage thickness measured using macroarthograms at the medial and lateral
compartments of the knee. He found that the JSW and cartilage thickness corresponded on the medial compartment, but not the lateral compartment due to corresponding meniscal changes.27
Radiographs are unable to directly visualize the cartilage and provide an accurate representation of the hyaline articular cartilage at the knee joint. Due to these limitations, the use of other imagining modalities needs to be explored in order to provide a more accurate assessment of the JSN and to detect the degeneration of the cartilage at the knee joint.10,25
Magnetic Resonance Imaging
Magnetic Resonance Imaging (MRI) has become a key tool to identify and track progress in patients with osteoarthritis.25 Unlike radiographs, MRI is expensive and is used less frequently in the clinical management of patients with OA.25 Although it is not as popular, one of the benefits of MRI technology is that it does not contribute to the patient’s radiation exposure.25 In addition, MRI has the ability to accurately differentiate soft tissue structures inside the joint, including menisci and articular cartilage. This precision allows researchers to study the degeneration of each structure independently and more accurately assess the extent of OA.25
Ultrasonography
these responses provides different feedback to the unit, which is then interpreted and used to create an image of the structure.28 To produce two-dimensional images of the intra-articular joint surfaces of the knee, clinicians use B-mode ultrasound. In B-mode ultrasound, the transducer simultaneously performs numerous linear scans in a single plane. These scans are then combined to produce a single image on the monitor that can be assessed and quantifiably measured by researchers.28
Although MRI is the primary diagnostic tool used to detect OA, US offers many benefits over the use of MRI. First, US allows for dynamic assessment, which is very unique to this modality and can provide valuable information to researchers during a specific movement or task. Second, US is significantly less expensive and portable, making it more accessible to clinicians.28,29 Lastly, because US relies on acoustic energy,
it does not involve the use of radiation, thus preventing patients from increased radiation exposure. All in all, this modality provides the perfect cost effective alternative to radiography and MRI, while still maintaining the quality and sensitivity of other modalities currently in use.30
The use of diagnostic ultrasound is an innovative concept in OA research. Previous investigators have found success using US to study the progression of inflammatory conditions, such as rheumatoid arthritis, but few studies have been done with direct relation to osteoarthritis.30 One study in particular demonstrated a positive relationship between cross-sectional cartilage measurements in cadavers 31 and MR images denoting cartilage deterioration.32 Furthermore, researchers recently discovered
ultrasound to measure femoral cartilage deformation before and after a walking and running protocol. They found that ultrasonography was sensitive to medial femoral cartilage deformation and that it was a reliable measurement to estimate cartilage thickness and total surface area.10
Quadriceps Strength
Self-Reported Function
Self-reported function is key in long-term rehabilitation goals because it is one of the deciding factors that predict whether or not an athlete will return to activity after sustaining a significant knee injury. Individuals with higher self-reported function are more likely to return to activity, while the chances of those with a lower self-reported function score returning are significantly reduced.11 Because the long-term goal of rehabilitation is to return patients to activity at their pre-injury level, it is crucial for clinicians to promote high self-reported outcome scores.
Previous research has linked quadriceps strength and self-reported function in patients diagnosed with chronic knee conditions, including osteoarthritis.11 Researchers commonly use quadriceps strength of the contralateral limb as the gold standard for rehabilitation progression decisions. The question that has recently been proposed is whether increased quadriceps strength normalized to the patient’s body mass or the healthy, contralateral limb results in higher self-reported function. Pietrosimone et al. conducted a study comparing quadriceps strength normalized to body mass (QBM) to the quadriceps strength limb symmetry index (QLSI). The researchers used these
accurate, while QLSI was only moderately accurate in predicting self-reported function. Interestingly, they also found that patients with a higher QBM of atleast 3.10 Nm/kg were eight times more likely to report as highly functional. In comparison, individuals with a QLSI of 96.5% or greater were only 2.78 times as likely to attain the same score on the IKDC.11 This data suggest that although symmetry is important, it is crucial to achieve a heightened QBM to promote optimal self-reported function.
Gait and Biomechanics
Increasing quadriceps strength has always been one of the primary goals of knee rehabilitation, but recent research has suggested that clinicians should focus more on quadriceps function and muscle activity instead of purely strength.33 Blackburn et. al studied the effects of quadriceps strength on gait kinematics in patients that had
undergone an anterior cruciate ligament reconstruction (ACLR). They found that neither isometric nor isotonic quadriceps strength correlated with gait kinematic deficits
observed in their post-operative participants.33
As demonstrated in the previous section, it can be argued that quadriceps strength can predict self-reported function and overall quality of life in the patients with chronic knee conditions.11 However, researchers have found that there is not a direct correlation between quadriceps strength and function.33 Unfortunately, this poses a problem
clinically because current rehabilitation methods have been deemed unsuccessful at improving quadriceps function.33
activity, individuals must restore their normal gait kinematics. Gait is one of the simplest functional activities, but it is critical because it provides a foundation for the remaining rehab process to build upon.33
Interestingly, current research reveals that there is no correlation between isokinetic quadriceps strength and gait kinematics.33 Isokinetic testing reflects maximal effort of the quadriceps.33 To further investigate this disconnect in the literature, studies
have analyzed electromyography (EMG) activity of the quadriceps during the swing and weight acceptance phases of walking gait. Researchers have found that during gait, the quadriceps function at a submaximal level, thus measures of maximal effort may not accurately predict deficits in gait kinematics.33
Although the association between quadriceps strength and gait is weak,
investigators have found an association between the rate of torque development (RTD) and ground reaction forces during gait.33 Blackburn et al. found that greater RTD
measurements are associated with lesser peak ground reaction forces and loading rates.33 Specifically, RTD was inversely proportional to maximum vertical ground reaction force (vGRF) and overall heel strike transient (HST). As RTD of the quadriceps increased, vGRF and HST decreased. HST represents the amount of force that is transmitted immediately after heel strike during gait. Thus, this finding is significant because heightened HST values often result in detriments in the articular cartilage at the knee joint.33
Resisting Load
experienced at the knee joint.5 In a recent study, researchers found that when comparing
normal-weight individuals to those considered obese, the obese participants exhibited greater instantaneous vertical loading rates during a walking protocol.5 In addition, investigators have found that a greater percentage of obese individuals exhibit HST during gait.4 These findings indicate that the overall knee load endured after striking the ground is amplified in obese individuals compared to normal-weight individuals.
As previously mentioned, articular cartilage is sensitive to changes in loading rate. The tissue is able to adapt to gradual changes in compressive forces; however, it is unable to withstand drastic increases in loading rate.4,5 Based on the researchers
conclusions, obesity increases both the incidence of HST and the vertical loading rates during gait. By increasing these injury risk factors, obesity significantly increases the probability of deformation and ultimate failure of the articular cartilage at the knee.4,5
In addition to increased loading rates and HST, obese participants also displayed lesser knee flexion excursion when compared to normal-weight participants.5 By
lessening the knee flexion angle, the body’s ability to absorb shock is compromised. In order to counteract this load increase, the quadriceps musculature must eccentrically contract during gait to slow the lower extremity.4,5 Therefore, if the quadriceps are weak or dysfunctional, loads are not properly mitigated at the joint. This phenomenon results in increased compressive forces on the articular cartilage, thus heightening the risk of cartilage breakdown.4,5
One factor that needs to be addressed when examining the effects of the quadriceps strength on shock absorption is body composition.4,5 Due to role of the
plays an important role in the amount of stress alleviated at the knee during gait. Overweight individuals exhibit a lower QBM when compared to normal-weight individuals with the same quadriceps strength. This relative quadriceps weakness combined with excess body fat has been shown to induce fatigue faster in lower
extremity musculature during gait. Furthermore, premature quadriceps fatigue shortens the eccentric interval during gait, thus negatively impacting knee load absorption.4,5
CHAPTER III: METHODS
Design
The current study utilized a crossover design to determine how structural components of cartilage responded to two different loading conditions (weighted and non-weighted) before (pre) and after (post) a 5000-step walking protocol. Participants completed three separate sessions. Session one included a BMI calculation, quadriceps strength assessment, and walking speed. Sessions two and three included US assessment of femoral articular cartilage pre and post walking protocol for one of the two separate conditions. All participants were instructed not to participate in any strenuous physical activity 12 hours prior to data collection (i.e. weight lifting, running, or jogging) and were asked to report their average weekly physical activity via the International Physical Activity Questionnaire (IPAQ). The IPAQ is a seven-question questionnaire that
quantifies physical activity by converting different levels of exercise into a standard unit of Metabolic Equivalent Tasks (METs).
The two loading conditions (weighted and non-weighted) were block randomized and separated by 10 days (±5 days). Each trial was scheduled at the same time of day (±2 hours) to account for the diurnal variations in articular cartilage structure.10
Participants
least three times per week and were able to ambulate normally without the assistance of an external device. Participants were excluded if they reported neurological symptoms (including amyotrophic lateral sclerosis, muscle dystrophy, epilepsy, multiple sclerosis, Parkinson’s disease, etc.), a congenital or degenerative joint condition, orthopedic implants, current joint pain (quantified as less than 2 on a 10cm visual analog scale), cartilage or ligamentous injury to knee or hip joints, lower or upper extremity fracture or concussions within the last year. In addition, pregnant females were also excluded from this study.
We estimated that we would detect a moderate effect (d=0.568) between cartilage deformation in the weighted and non-weighted conditions, which we determined during pilot testing in the laboratory and using normal mean differences and standard deviations of cartilage thickness measures from our previously published work.10 Therefore, we estimated that 27 participants would be needed to detect two-tailed statistical significance with an alpha level set at 0.05 and 80% power.35 To ensure that we would have 27
participants complete all sessions with a potential 15% dropout rate, we collected a total of 32 participants.35 The University’s Institutional Review Board approved this study,
and all participants provided written consent prior to participation.
Data Collection Procedures
Body Mass Index
Equation 1: BMI = Weight (kg) ÷ Height (cm)2
Quadriceps Strength
Quadriceps maximal voluntary isometric contraction (MVIC) was assessed on a HUMAC Norm dynamometer (CSMi, Stoughton, MA) and was defined as the highest peak torque output from the two maximum quadriceps contraction trials. Adjustable straps were positioned across the torso, quadriceps, and thigh to isolate torque produced by the quadriceps muscles.37 The hips and knees of each participant were flexed to 85° and 90°, respectively. 38 The lever arm of the dynamometer was placed approximately three centimeters proximal to the lateral malleolus, and the center of the knee joint was aligned with the dynamometer axis of rotation. Torque signal outputted to an A-D conversion board (16-bit, MP150; BIOPAC Systems, Inc., Goleta, CA) via a custom made cable. An in-house software program (LabVIEW; National Instruments Corp., Austin, TX) was used to collect and display torque data in real-time via a 56 cm computer monitor.
Prior to testing, participants performed submaximal isometric contractions by pushing into the lever arm at 25%, 50%, and 75% of their perceived maximal effort to warm up their quadriceps muscles. One minute of rest was given between each
contraction. Next, participants performed three to five practice maximal effort trials attempting to reach peak torque generation as fast as possible. Participants were
instructed to extend their knee, pushing their tibia into the lever arm “as hard and as fast as possible”. Research personnel provided consistent verbal encouragement.39,40 The
quadriceps contractions were performed in which the peak torque had to match or exceed the torque threshold previously calculated.11 The two maximal quadriceps contractions were then averaged to calculate the maximum peak torque value that was used in the final data analysis.
Walking Speed
Each participant performed five practice walking trials, in which walking speed was assessed in real time using two sets of infrared timing gates (TF100, TracTronix Lenexa, KS). Participants were instructed to walk at a self-selected speed described as “comfortably walking over a sidewalk”. The average of the five trials was recorded and converted into miles per hour for the walking protocol on the treadmill.
Loading conditions
Immediately after pre-loading US images were collected, participants were instructed to take 4 steps from the treatment plinth to the treadmill (4Front, 148 WOODWAY, Waukesha, WI) to begin the 5000-step walking protocol at their self-selected speed (determined during the screening session). The treadmill, diagnostic US, and treatment plinth were located in the same laboratory to ensure efficiency. To account for the possible joint compression that may have occurred while the participant was being fitted for the weight vest in the weighted condition, each participant stood for two
protocol. For the non-weighted condition, individuals completed the above protocol with no additional equipment. The total step count was calculated during the walking protocol. After the participant walked for 60 seconds at the self-selected speed, the researchers manually counted the total number of steps taken in 30 seconds. The total time needed to achieve 5000 steps was then calculated using a standard equation (Equation 2). Step count and the total time of the walking protocol was calculated for both loading
conditions.42 After completing the loading protocol, each participant was then instructed to take four steps back to the treatment plinth and was asked to replicate the pre-loading position. Three images of each knee were then captured of the femoral articular cartilage within five minutes following the loading protocol.
Equation 2: Total Time of Walking Protocol = [5000 ÷ ((# steps in 30 secs) x 2)] - 1
Ultrasonography of Medial and Lateral Femoral Articular Cartilage
Prior to the cartilage assessment, participants were instructed to sit on a treatment plinth in a long-sit position with both knees in full extension. Each participant remained in this position for 45 minutes to unload the cartilage and minimize the effects of prior loading from activities of daily living on cartilage thickness.10 After 45 minutes, each
was positioned transversely in line with the medial and lateral femoral condyles above the superior edge of the patella and rotated to maximize reflection of the articular cartilage surface (Figure 1). A transparency grid was placed over the US screen to aid in reproducibility of the US assessment.10 Once the intercondylar notch was centered on the grid, the positioning of the lateral and medial condyles at the edge of the screen was recorded. This positioning was replicated in subsequent assessments to ensure similar probe placement during the successive US measurements. A total of 6 baseline images were recorded for each participant (three images of each knee). The order of testing was randomized for each knee for both trials; however, only the data from the dominant limb was analyzed.
The participant was repositioned after the loading condition on the treadmill for the post-test measure by instructing each participant to sit in the long-sit position with his/her back flush against the wall, thus replicating the pre-loading positioning. The researcher then passively flexed each knee until the posterior calcaneus corresponded with the marking on the tape measure from the pre-trial measurement. Three images of each knee were then captured of the femoral articular cartilage within five minutes following the loading protocol. The same protocol was carried out for both knees after both conditions.
Inter-session correlation coefficients (ICC2,k) and standard error of measurement
(SEM) were previously calculated to establish the inter-session reliability and precision of administering and analyzing the US images.10 Strong intersession reliability and
precision was demonstrated for femoral cartilage CSA (ICC2,k = 0.977, SEM
Figure 1. Patient Positioning For US Assessment of Femoral Articular Cartilage Cross-Sectional Area
Analysis of Femoral Articular Cartilage US Images
All US images were analyzed by a single investigator using ImageJ software (National Institutes of Health, Bethesda, MD), similar to previous research.10 The investigator was blinded to the patient, time point, and condition for all images. After obtaining the measurements for each image, the values were averaged across the three images from the pre or post time points to obtain an average value.
Equation 3: ∆CSA = [(post TFCSA - pre TFCSA) / pre TFCSA] * 100
Figure 2. Femoral Articular Cartilage Cross-Sectional Area Outcome Measurement Using ImageJ
Statistical Analysis
For our primary aim, we conducted a dependent samples t-test to determine differences in ∆CSA between the weighted and non-weighted loading conditions. For our secondary aim, we conducted a univariate multiple linear regression to determine the association between ∆CSA (criterion variable) and quadriceps MVIC (predictor variable) after accounting for walking speed as a covariate. Walking speed was placed first into the linear regression followed by quadriceps MVIC. A significant association was
determined based on the change in R2 (∆R2) for quadriceps MVIC after accounting for walking speed. Significance level was set a priori at P ≤ 0.05 for all correlations and a Shapiro-Wilk test was conducted to determine normal distribution of all TFCSA measurements (p-values ≥ 0.05). All statistics were conducted using SPSS software, version 19.
Post-Hoc Analysis
condition. Participants were placed into 3 groups based on their response to non-weighted walking: non-weighted decrease (NWD), non-weighted no-change (NWNC), and
non-weighted increase (NWI). The groups were determined by using a minimal detectable
change (MDC) of 1.58mm that was previously recorded for medial cross sectional area.43 Individuals who decreased by the MDC were placed in NWD, individuals who did not
increase or decrease by the MDC were placed into NWNC, and individuals who increased
cartilage deformation by at least the MDC were placed into NWI. We conducted a 2x3
CHAPTER IV: RESULTS
Participants
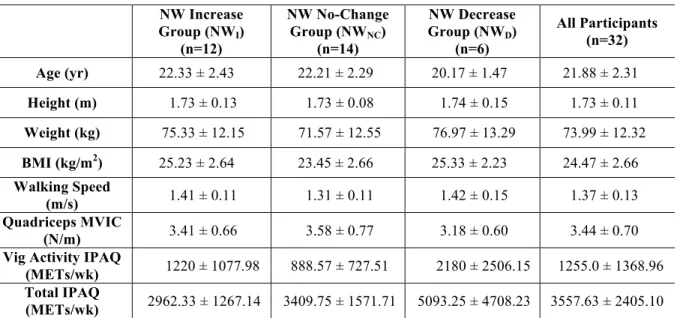
Sixteen male and sixteen female healthy participants completed the study. All 32 participants completed all sessions and were included in the statistical analysis.
Demographics for all participants can be found in Table 2. A Shapiro-Wilk test confirmed that all femoral cartilage CSA measurements were normally distributed (p-values ≥ 0.05).
Table 2. Descriptive Data for Participants NW Increase
Group (NWI)
(n=12)
NW No-Change Group (NWNC)
(n=14)
NW Decrease Group (NWD)
(n=6)
All Participants (n=32)
Age (yr) 22.33 ± 2.43 22.21 ± 2.29 20.17 ± 1.47 21.88 ± 2.31
Height (m) 1.73 ± 0.13 1.73 ± 0.08 1.74 ± 0.15 1.73 ± 0.11
Weight (kg) 75.33 ± 12.15 71.57 ± 12.55 76.97 ± 13.29 73.99 ± 12.32
BMI (kg/m2) 25.23 ± 2.64 23.45 ± 2.66 25.33 ± 2.23 24.47 ± 2.66
Walking Speed
(m/s) 1.41 ± 0.11 1.31 ± 0.11 1.42 ± 0.15 1.37 ± 0.13 Quadriceps MVIC
(N/m) 3.41 ± 0.66 3.58 ± 0.77 3.18 ± 0.60 3.44 ± 0.70 Vig Activity IPAQ
(METs/wk) 1220 ± 1077.98 888.57 ± 727.51 2180 ± 2506.15 1255.0 ± 1368.96 Total IPAQ
(METs/wk) 2962.33 ± 1267.14 3409.75 ± 1571.71 5093.25 ± 4708.23 3557.63 ± 2405.10
n=sample size, SD=standard deviation
Femoral Cartilage Cross-Sectional Area Using Ultrasonography
Association Between Strength and Change in Femoral Cartilage Cross-Sectional Area After accounting for walking speed, strength did not significantly associate with
∆CSA in the non-weighted condition (R=0.027, ∆R2 = 0.004, p = 0.731). In addition, strength also did not significantly associate with ∆CSA in the weighted condition (R=0.046, ∆R2 = 0.003, p = 0.762).
Post-Hoc Analyses
No significant differences were noted in the demographics across the 3 groups (Age: F2,29=2.181, p=0.131; Height: F2,29=0.048, p=0.953 Weight: F2,29=0.498, p=0.613
BMI: F2,29=1.937, p=0.162; Table 2). There was a significant interaction effect for ∆CSA
between groups and condition (F2,29 = 6.384, p = 0.005, Figure 1). During the
non-weighted condition, NWD demonstrated greater negative ∆CSA following the walking
protocol than the NWNC (p<0.001) and NWI (p<0.001). Additionally, NWI demonstrated
a greater positive ∆CSA following the walking protocol compared to NWNC (p<0.001).
During the weighted condition there were no differences between groups following the walking protocol (NWD and NWNC: p=0.247; NWD and NWI: p=0.722; NWI and NWNC:
Table 3. ANOVA Results for Femoral Cartilage Cross-Sectional Area
Group
Non-Weighted (Means ± SD) Weighted (Means ± SD)
Pre
(mm2)
Post
(mm2) Raw Δ %Δ
Pre
(mm2)
Post
(mm2) Raw Δ %Δ
NWD 90.67 ± 8.13 87.13 ± 8.13 -3.54 ± 1.32 -3.90 ± 1.46 89.83 ± 8.26 88.79 ± 7.14 -1.04 ± 2.91 -1.01 ± 3.22 NWNC 91.83 ± 13.58 91.88 ± 13.97 0.05 ± 0.87 0.00 ± 0.92 91.03 ± 12.76 91.87 ± 12.85 0.84 ± 3.10 0.96 ± 3.38 NWI 87.53 ± 12.89 90.39 ± 13.05 2.85 ± 1.37 3.30 ± 1.52 88.72 ± 14.08 88.79 ± 13.64 0.08 ± 1.04 0.17 ± 1.31 All Participants 90.59 ± 11.47 89.82 ± 11.73 -0.77 ± 2.66 -0.84 ± 2.96 90.14 ± 11.19 90.14 ± 10.94 -0.01 ± 2.82 0.07 ± 3.09
NWD=Non-Weighted Decrease, NWNC=Non-Weighted No-Change, NWI=Non-Weighted
Figure 3. Condition x Group Interaction for Femoral Articular Cartilage Cross-Sectional Area
NW(D)=Non-Weighted Decrease, NW(NC)=Non-Weighted No-Change, NW(I)=Non-Weighted Increase -6 -5 -4 -3 -2 -1 0 1 2 3 4 5 6
Non-Weighted Weighted
Fe m or al C ar ti la ge D ef or m at io n ( m m 2 ) Loading Condition
CHAPTER V: DISCUSSION
For our primary aim, we found no significant main effect in the ∆CSA measurements between the two loading conditions. Therefore, our findings did not support our primary hypothesis that the weighted condition would result in a
greater negative ∆CSA when compared to the non-weighted condition. In addition to dissimilarities in our cartilage measures, we found no significant association between normalized quadriceps strength and ∆CSA following the weighted and non-weighted walking conditions. Therefore, our results did not support our hypothesis that
higher QBM would result in smaller changes in ∆CSA following a non-weighted and weighted walking Protocol. Interestingly, in our post-hoc analysis, we found three different ∆CSA responses to walking during the non-weighted condition, which included participants who decreased (NWD), increased (NWI), and demonstrated no-change
(NWNC) in CSA. These findings are significant because they suggest that femoral
articular cartilage may exhibit varying responses to usual walking, instead of consistently decreasing as previous studies have demonstrated.42–44
Femoral Cartilage Adaptations to Exercise
measured medial and lateral compartment thickness. However, these studies differed in the type and intensity of activity performed and the blinding technique used when assessing the US images. Harkey et al.10 used a standardized walking protocol at a self-selected comfortable walking speed for each participant, while Roberts et al.45 utilzed a less regulated, maximal running and cycling trial that more closely resembled
competition. These two studies measured femoral CSA under two very different exercise conditions. The current study’s non-weighted condition protocol was based on Harkey et al.,10 and differed only in the acute addition of 20% of each participant’s body weight via a weight vest during the weighted condition. Although the total length of the walking protocol during the two conditions was identical, we hypothesize the weighted condition likely increased the difficulty and intensity of the walking protocol due to the increase in weight. While this may explain the variation in the results of the weighted condition, it does not account for the discrepancies in the ∆CSA we found in the non-weighted condition. However, these differences may be explained by the intrinsic properties of articular cartilage.
individuals in NWD experienced a negative ∆CSA after the non-weighted walking
protocol because they were less physically trained and unable to resist deformation as effectively as NWI and NWNC. Using the same logic, NWI experienced a positive ∆CSA
in response to loading because they were more physically active and better able to adapt to the acute change in load, whereas NWNC may have been moderately trained, but did
not experience a significant ∆CSA their femoral cartilage lacked the previous loading exposure to develop adaptation.
Image Analysis and Blinding
rates compared to assessing images blinded to sequence.48,50,51 Similarly, researchers
have found that reading radiographs in OA patients with known chronology tended to yield increased sensitivity to changes in joint space narrowing measures.49 It is important to note that although RA and OA are comparable, they are not the same.
One of the primary flaws that numerous researchers have pointed out is that, unlike RA, there is currently no gold standard for OA image analysis.48,51 Specifically,
due to the novelty of ultrasonography to assess ∆CSA, no parameters exist to guide image analysts as they determine what may or may not constitute as cartilage. Ideally, to determine the most appropriate method to measure femoral articular cartilage using US, images would need to be measured using both techniques and then compared to the gold standard. Unfortunately, the gold standard for US assessment is currently nonexistent.48,51
In the previous studies discussed earlier, Harkey et al.10,43,52 analyzed images with known chronology and condition, meaning the investigator was aware of both the condition and the time point each image was taken while segmenting. In contrast, Roberts et al.45 blinded images to both chronology and condition, meaning the segmentor was unaware of the condition and time point each image was collected. Due to the lack of consensus regarding which technique is the most suited for US analysis, we chose to blind the image analyzer to both condition and chronology in an effort to control for any bias. Therefore, the discrepancies in our results and those reported by Harkey et al.,10 may be partially attributed to the differences in the blinding approach.
contrast, we examined ∆CSA for this study to get a sense of what happens to the anterior portion of the femoral cartilage as a whole after a walking protocol. Researchers have studied the effects of walking, running, and drop landing on medial and lateral CSA and found similar results to their thickness measurements.10,43,52 However, both thickness and CSA compartmental measurements are based off the investigator’s perception of the center of the intercondylar notch, which still leaves room for variability and bias.47
Although ∆CSA measurements have not been studied as in depth as thickness measures, it may provide a more holistic view of the cartilage’s response to load and may eliminate variability in placement of medial and lateral compartment measures across the cartilage. The use of ultrasonography to depict and quantify acute ∆CSA is a novel approach; therefore, more evidence is needed to establish which measurement most accurately represents the cartilage’s response to loading.
Walking Kinematics
Femoral articular cartilage is viscoelastic, thus making it a key factor in energy attenuation and force dispersal at the knee joint. Articular cartilage lacks pliability and is unable to conform quickly to rapid increases in load, thus resulting in failure.9,54 During walking gait, the greatest weight bearing loads and ground reaction forces occur during or immediately following heel strike.46 In response to the rapid increase in load, sufficient knee flexion must occur to appropriately attenuate forces at the knee and throughout the lower extremity chain.54 Although we did not include gait biomechanics in our current investigation, overweight and obese individuals exhibit less knee flexion and
we can speculate that all three groups may have exhibited a stiffened knee response during the weight acceptance phase of gait, thus exposing the femoral cartilage to a rapid increase in load, resulting in no significant ∆CSA as compared to the non-weighted condition.
Originally, we hypothesized that individuals with greater quadriceps strength may be able to better resist ∆CSA during the weighted condition. Although statistically this was not the case, our outcome measures may have been altered by the walking speed protocol. Previous investigators have shown that obese individuals typically walk an average of 0.3 m/s slower compared to individuals of normal weight.24 It is possible slower walking speeds are used to compensate for poor energy attenuation, thereby decreasing loading rates on lower extremity tissues and lessening the overall stress on the articular cartilage.5,6,24 By maintaining the same walking speed during both the non-weighted and non-weighted conditions, we may have exacerbated the already increased load on the articular cartilage by voiding the natural compensation, which may occur when weight is added, which resulted in varying responses in the cartilage.
Limitations
we are only able to measure the anterior portion of the femur.10,45 It is possible that the
cartilage reacted differently in the posterior or central portions of the tibiofemoral joint, but we were unable to quantify the changes without the use of MRI. Additionally, our weight gain model does not take into account the addition of both non-lean and lean increases in body mass as the addition of twenty percent of each participant’s body weight via a weight would more accurately depict a 20% increase in pure body fat without a corresponding increase in muscle mass. This immediate and exponential increase in body fat may have caused the cartilage to stiffen and react differently than if the participants were to gradually gain weight over weeks to months.
Conclusion
Overall, our findings did not support our primary hypothesis that the weighted condition would result in a greater negative ∆CSA when compared to the non-weighted condition. Additionally, quadriceps strength does not predict cartilage deformation. The response of femoral articular cartilage to load may be non-uniform, as we found 3 distinct responses to non-weighted walking including, increasing, decreasing, or demonstrating in no-change in CSA following 5000 steps. There were no differences between subgroups following the weighed walking condition, suggesting individuals who usually increase or decrease in CSA during non-weighted walking demonstrate less of an increase or
REFERENCES
1. Glyn-Jones S, Palmer AJR, Agricola R, et al. Osteoarthritis. Lancet. 2015;386(9991):376-387.
2. Batsis JA, Zbehlik AJ, Barre LK, Bynum J, Pidgeon D, Bartels SJ. Impact of obesity on disability, function, and physical activity: data from the Osteoarthritis Initiative. Scand J Rheumatol. 2015;9742(September):in press.
3. Johnson VL, Hunter DJ. The epidemiology of osteoarthritis. Best Pract Res Clin Rheumatol. 2014;28(1):5-15.
4. Pamukoff DN, Dudley RI, Vakula MN, Blackburn JT. An evaluation of the heel strike transient in obese young adults during walking gait. Gait Posture.
2016;49:181-183.
5. Pamukoff DN, Lewek MD, Blackburn JT. Greater vertical loading rate in obese compared to normal weight young adults. Clin Biomech. 2016;33:61-65.
6. Harding GT, Hubley-Kozey CL, Dunbar MJ, Stanish WD, Astephen Wilson JL. Body mass index affects knee joint mechanics during gait differently with and without moderate knee osteoarthritis. Osteoarthr Cartil. 2012;20(11):1234-1242.
7. Messier SP, Gutekunst DJ, Davis C, DeVita P. Weight loss reduces knee-joint loads in overweight and obese older adults with knee osteoarthritis. Arthritis Rheum. 2005;52(7):2026-2032.
8. Messier SP, Legault C, Loeser RF, et al. Does high weight loss in older adults with knee osteoarthritis affect bone-on-bone joint loads and muscle forces during walking? Osteoarthr Cartil. 2011;19(3):272-280.
10. Harkey M, Blackburn JT, Davis H, Sierra-Arevalo L, Nissman D, Pietrosimone B. Ultrasound Assessment of Medial Femoral Cartilage Deformation Acutely
Following Walking and Running. Osteoarthr Cartil.
11. Pietrosimone B, Lepley AS, Harkey MS, et al. Quadriceps Strength Predicts Self-reported Function Post-ACL Reconstruction. Med Sci Sports Exerc.
2016;48(9):1671-1677.
12. Woolf AD, Pfleger B. Burden of major musculoskeletal conditions. Bull World Health Organ. 2003;81(9):646-656.
13. Felson DT, Chaisson CE. 2 Understanding the relationship between body weight and osteoarthritis. Baillieres Clin Rheumatol. 1997;11(4):671-681.
14. Felson DT. Weight and Osteoarthritis. Lakartidningen. 1998;95(44):4869-4872.
15. Christensen R, Bartels EM, Astrup A, Bliddal H. Effect of weight reduction in obese patients diagnosed with knee osteoarthritis: a systematic review and meta-analysis. Ann Rheum Dis. 2006;66(4):433-439.
16. Aaboe J, Bliddal H, Messier SP, Alkjær T, Henriksen M. Effects of an intensive weight loss program on knee joint loading in obese adults with knee osteoarthritis. Osteoarthr Cartil. 2011;19(7):822-828.
17. Harding GT, Dunbar MJ, Hubley-Kozey CL, Stanish WD, Astephen Wilson JL. Obesity is associated with higher absolute tibiofemoral contact and muscle forces during gait with and without knee osteoarthritis. Clin Biomech. 2016;31:79-86.
18. Mackie A, Muthumayandi K, Shirley M, Deehan D, Gerrand C. Association between body mass index change and outcome in the first year after total knee arthroplasty. J Arthroplasty. 2015;30(2):206-209.
20. Fowler-Brown A, Kim DH, Shi L, et al. The Mediating Effect of Leptin on the Relationship Between Body Weight and Knee Osteoarthritis in Older Adults. 2016;116(8):1477-1490.
21. Ode JJ, Pivarnik JM, Reeves MJ, Knous JL. Body mass index as a predictor of percent fat in college athletes and nonathletes. Med Sci Sports Exerc.
2007;39(3):403-409.
22. Messier SP, Loeser RF, Miller GD, et al. Exercise and Dietary Weight Loss in Overweight and Obese Older Adults with Knee Osteoarthritis: The Arthritis, Diet, and Activity Promotion Trial. Arthritis Rheum. 2004;50(5):1501-1510.
23. Spindler KP, Warren TA, Callison JC, et al. Clinical outcome at a minimum of five years after reconstruction of the anterior cruciate ligament. J Bone Jt Surgery, Am Vol. 2005;87A(8):1673-1680.
24. Browning RC, Kram R. Effects of obesity on the biomechanics of walking at different speeds. Med Sci Sports Exerc. 2007;39(9):1632-1641.
25. Guermazi A, Hayashi D, Roemer FW, Felson DT. Osteoarthritis. A Review of Strengths and Weaknesses of Different Imaging Options. Rheum Dis Clin North Am. 2013;39(3):567-591.
26. Hunter DJ, Zhang YQ, Tu X, et al. Change in joint space width: Hyaline articular cartilage loss or alteration in meniscus? Arthritis Rheum. 2006;54(8):2488-2495.
27. Buckland-Wright JC, Macfarlane DG, Lynch JA, Jasani MK, Bradshaw CR. Joint space width measures cartilage thickness in osteoarthritis of the knee: high
resolution plain film and double contrast macroradiographic investigation. Ann Rheum Dis. 1995;54:263-268.
28. Carovac A, Smajlovic F, Junuzovic D. Application of ultrasound in medicine. Acta Inf Med. 2011;19(3):168-171.
30. Keen HI, Wakefield RJ, Conaghan PG. A systematic review of ultrasonography in osteoarthritis. Ann Rheum Dis. 2009;68(5):611-619.
31. Naredo E, Cabero F, Palop MJ, Collado P, Cruz A, Crespo M. Ultrasonographic findings in knee osteoarthritis: A comparative study with clinical and radiographic assessment. Osteoarthr Cartil. 2005;13(7):568-574.
32. Østergaard M, Wiell C. Ultrasonography in rheumatoid arthritis: a very promising method still needing more validation. Curr Opin Rheumatol. 2004;16(3):223-230.
33. Troy Blackburn J, Pietrosimone B, Harkey MS, Luc BA, Pamukoff DN. Quadriceps Function and Gait Kinetics after Anterior Cruciate Ligament Reconstruction. Med Sci Sports Exerc. 2016;48(9):1664-1670.
34. Kulas A, Zalewski P, Hortobagyi T, DeVita P. Effects of added trunk load and corresponding trunk position adaptations on lower extremity biomechanics during drop-landings. J Biomech. 2008;41(1):180-185.
35. Erdfelder E. G * Power 3 : A flexible statistical power analysis program for the social , behavioral , and biomedical sciences. 2007;39(2):175-191.
36. Consultation WE. Public health Appropriate body-mass index for Asian populations and its implications for policy and intervention strategies. 2004;363:157-163.
37. Roberts D, Kuenze C, Saliba S, Hart JM. Accessory muscle activation during the superimposed burst technique. J Electromyogr Kinesiol. 2017;22(4):540-545.
38. Lepley AS, Ericksen HM, Sohn DH, Pietrosimone BG. The Knee Contributions of neural excitability and voluntary activation to quadriceps muscle strength
following anterior cruciate ligament reconstruction. Knee. 2017;21(3):736-742.
40. Pietrosimone BG, Selkow NM, Ingersoll CD, Hart JM, Saliba SA. Electrode Type and Placement Configuration for Quadriceps Activation Evaluation.
2011;46(6):621-628.
41. Luc BA, Harkey MH, Arguelles GD, Blackburn JT, Ryan ED, Pietrosimone B. Measuring voluntary quadriceps activation : Effect of visual feedback and stimulus delivery. 2016;26:73-81.
42. Pietrosimone B, Blackburn JT, Harkey MS, et al. Walking Speed As a Potential Indicator of Cartilage Breakdown Following Anterior Cruciate Ligament Reconstruction. 2016;68(6):793-800.
43. Harkey MS, Blackburn JT, Hackney AC, et al. Comprehensively Assessing the Acute Femoral Cartilage Response and Recovery After Walking and Drop-Landing: An Ultrasonographic Study. 2018;44(2):311-320.
44. Harkey MS, Blackburn JT, Davis H, Sierra-Arévalo L, Nissman D, Pietrosimone B. Ultrasonographic assessment of medial femoral cartilage deformation acutely following walking and running. Osteoarthr Cartil. 2017;25(6):907-913.
45. Roberts HM, Moore JP, Griffith-McGeever CL, Fortes MB, Thom JM. The effect of vigorous running and cycling on serum COMP, lubricin, and femoral cartilage thickness: a pilot study. Eur J Appl Physiol. 2016;116(8):1467-1477.
46. Vincent KR, Conrad BP, Fregly BJ, Vincent HK. The Pathophysiology of Osteoarthritis: A Mechanical Perspective on the Knee Joint. PM R. 2012;4(5 SUPPL.):S3-S9.
47. Schmitz RJ, Harrison D, Wang H-M, Shultz SJ. Sagittal-Plane Knee Moment During Gait and Knee Cartilage Thickness. J Athl Train. 2017;52(6):560-566.
48. Felson DT, Nevitt MC. Blinding images to sequence in osteoarthritis: evidence from other diseases. Osteoarthr Cartil. 2009;17(3):281-283.
49. Botha-Scheepers S, Watt I, Breedveld FC, Kloppenburg M. Reading radiographs in pairs or in chronological order influences radiological progression in
50. Ferrara R, Priolo F, Cammisa M, et al. Clinical trials in rheumatoid arthritis: Methodological suggestions for assessing radiographs arising from the GRISAR* study. Ann Rheum Dis. 1997;56(10):608-612.
51. Bruynesteyn K, Der Heijde D Van, Boers M, et al. Detecting radiological changes in rheumatoid arthritis that are considered important by clinical experts: Influence of reading with or without known sequence. J Rheumatol. 2002;29(11):2306-2312.
52. Harkey MS, Blackburn JT, Davis H, Sierra-Arévalo L, Nissman D, Pietrosimone B. The association between habitual walking speed and medial femoral cartilage deformation following 30 minutes of walking. Gait Posture. 2018;59(May):128-133.
53. Schmitz RJ, Wang H-M, Polprasert DR, Kraft RA, Pietrosimone BG. Evaluation of knee cartilage thickness: A comparison between ultrasound and magnetic resonance imaging methods. Knee. 2017;24(2):217-223.
54. Pamukoff DN, Dudley RI, Vakula MN, Blackburn JT. An evaluation of the heel strike transient in obese young adults during walking gait. Gait Posture.