TECHNICAL UNIVERSITY OF CLUJ-NAPOCA
ACTA TECHNICA NAPOCENSIS
Series: Applied Mathematics, Mechanics, and Engineering Vol. 61, Issue IV, November, 2018
NUMERICAL SIMULATION OF VICKERS MICRO-INDENTATION TEST
TO ESTIMATE MICRO-HARDNESS
Mihaela SIMION, Mircea Cristian DUDESCU, Radu CHIOREAN
Abstract: The paper aim is to investigate the experimental micro-hardness process by finite elements method (FEM) and validation of the numerical simulation by geometric evaluation of the imprint's parameters numerically obtained with the experimental results. In the first stage, micro-indentation experiments with a Vickers indenter were performed on two materials, aluminum 6060 and cooper C110. The average length of imprint diagonals and average value of Vickers micro-hardness of the materials were determined. In the second stage, the micro-indentation process for both materials were simulated by finite element method using a 3D model of a Vickers indenter for which the geometric and mechanical characteristics are known. For an accurate simulation the mechanical constants and material behavior in terms of strain –stress curves of the studied materials, has to be determined. Thus, the uniaxial tensile test was performed for both materials and their mechanical properties and the stress – strain curves were measured. The values of Vickers micro-hardness and the geometric parameters of imprints obtained from the finite element simulation were in very good agreement with the results obtained from micro-indentation experiments.
Key words: Vickers micro-hardness, micro-indentation, imprint parameters, numerical simulation.
1. INTRODUCTION
The micro-indentation technique is widely used for determine hardness and basic mechanical properties at nano and micro scale for different materials like metals, ceramics, composites, thin films, second phase particles and magnetic hard disk recording media [1-4]. This technique presents the advantage that the measurements can be performed on small amounts of material, with no restrictions regarding sample cross section, and the tests are realized without permanent destruction of the sample [5].
Micro-indentation consists in pressing against the material’s sample with a force by an indenter with known geometry, causing local elastic and plastic deformations, resulting an imprint. The hardness of the sample is calculated taking account the applied force and the diagonals of the imprint optically measured. Most of the researchers have focused their investigations on estimation the elastic modulus
and hardness of the tested sample by using loading and unloading indentation curve (P – h)
provided by instrumented micro-indentation technique [6-12]. However, indentation curves are not available for traditional hardness equipment, thus occurs the necessity to apply finite element methods (FEM) in order to characterize mechanical properties of the materials.
In the last two decades, FEM technique is highly used for modeling and solving many engineering problems. The advantage of using FEM is that can be performed several simulations in different conditions for the same sample for a better understanding of mechanical phenomena, thus saving time, material and financial resources.
load-indentation depth curve for elasto-plastic materials, the mechanical and micro-structure behavior of the material, and the distribution of equivalent plastic deformations during nano and micro-indentation process [19-23].
In other studies were exhibited numerical analysis taking into account the influence of the coefficient of friction between the indenter and sample’s surface on numerical estimation of elastic modulus and hardness of material [24]. Another aspect analyzed by numerical micro-indentation simulations is the sink-in and pile-up phenomenon, given by plastic deformation of the impression, and their influence in the estimation of Young's modulus and hardness of tested material [25]. Researchers have proposed numerical methods which allow assessment of indentation imprint and to estimate the hardness of bulk materials or metal matrix. They have compared numerical results obtained from FE simulation of nano-indentation process with experimental values in order to validate the FE simulation methods of indentation process [10, 26-29].
In this study, a 3D numerical simulation of experimental micro-indentation test using a Vickers indenter was performed to determine the geometrical parameters of imprint after elastic recovery and to estimate the Vickers micro-hardness of aluminum 6060 and cooper 110 samples. Uniaxial tensile test are made on both samples in order to define stress-strain curve required for numerical simulations. Also, Vickers micro-indentation experiments was made to compare experimental hardness with numerical results and to check the proposed FE method. For both samples, the Vickers micro-hardness, respectively the parameters which define the geometry of imprints determined by numerical simulations were in very good agreement with Vickers micro-hardness and imprints obtained from the micro-indentation experiment.
2. METHODS AND MATERIALS
2.1 Methods
As previously defined, the conventional Vickers hardness is given by the maximum force divided by the four-sided pyramidal contact area, which is evaluated from the diagonals of the residual indentation marks after unloading.
In literature are given several formula to calculate the conventional Vickers hardness (HV), where either the imprint diagonals or
projected area are taken into account [30, 31]. The base formula used to calculate the conventional Vickers micro-hardness (HV) is according to ASM Handbook. The HV value is
depending on mean diagonals optically measured and the applied force is previously known [32, 33]:
(
)
2 2
d F 4 . 1854 d
2 sin F 2000
HV = α = (1)
where d is the mean diagonal of the residual
impression [µm]; F is the applied force [gf] and
α is the angle between opposite faces of the
indenter and it is 136° for pyramidal indenter (Vickers).
In micro-indentation process local elastic and plastic deformations occurs when maximum force is applied and thus the residual imprint is generated. The elastic recovery during unloading happens mainly along loading direction and it is negligible in-plane direction (normally to loading direction).
If the recovery in the in-plane direction during unloading is negligible [34, 35], the diagonal evaluated from the contact depth at the corners in the loaded state should be the same as those of the residual imprint. The contact depth at the corner determines conventional Vickers hardness given by equation [11]:
( )
2 c maxh 43 . 26
F HV
×
= (2)
In equation (2) the denominator represents the projected contact area at the maximum indentation depth determined by Fmax and can be
calculated directly from the geometry of the residual imprint. The relationship between the diagonal and contact depth at the corner of the residual indent is given by:
(
2)
tan 2 2d hc
α
= (3)
Equations (1) and (2) are used to determine Vickers micro-hardness when conventional indentation test are performed.
The investigated materials are aluminum extrusion alloy (Al 6060 T6) from the series 6 of the alloy and 110 copper known as Electrolytic Tough Pitch copper (ETP) or C11000. Aluminum alloy is widely used for architectural and building products, pipe and tubes, electrical components, profile products, heat sinks etc.
The Al 6060 T6 alloy offers good mechanical strength and good resistance corrosion, and the finished products are obtained with good surface quality. The chemical composition of aluminum alloy is given in standard EN-573-3:1994 and the mechanical properties in EN 755-2:2008 (Vickers hardness HV = 0.785 [GPa], elastic modulus, E = 69 [GPa]) [36, 37].
Copper 110 (C11000) is the most common copper type on the market and it has the highest electrical conductivity of any metal (except silver). Copper is used as an electrical component in transformers, switch gears and parts that require a high electrical conductivity. Mechanical properties of copper 110 is given in EN 1652 (or ASTM B152/B 152M – 06a): elastic modulus is 117 GPa and Vickers hardness varies between 90 and 117 GPa, depending on thermal treatments applied [38, 39].
The aluminum sample used for experimental measurements were cut from a commercial L shape profile with 1.25 mm wall thickness and the copper sample was cut from a sheet with 0.32 mm thickness. The finished surfaces of the aluminum profile were covered with a thin layer of corrosive protection (thickness of the micron size), which influence the micro-hardness of the material.
To obtain correct values of mechanical properties and micro-hardness by experimental measurements for both samples, it was necessary to (1) carefully polish the samples surface in order to remove the protection layer and (2) carefully remove the impurities of samples surface with dissolvent solution.
3. EXPERIMENTAL MEASUREMENTS
3.1 Micro-indentation test
In order to estimate the Vickers micro-hardness of the aluminum and copper samples by finite elements method (FEM) and to check
the proposed numerical model, it was necessary to determine the hardness of the aluminum Al 6060 T6 and copper samples by micro-indentation experimental tests. The Vickers micro-hardness test were performed according to ASTM E 384-99 and ISO 6057-1 [32, 40].
The micro-indentation tests were performed using a Wilson Hardness Tukon 1202 tester equipped with diamond square base indenter – Vickers indenter, in laboratory conditions at temperature T = 25 ± 1 °C and stable humidity (53%). The Wilson Tukon 1202 is a conventional micro-hardness tester which perform static micro-indentations and the imprint on sample’s surface is generated by the vertical motion (downward) of the Vickers indenter given by the action of a selected weight. Then, the Vickers micro-hardness value is automatic computed by WinControl software using the diagonals length of imprint optically measured.
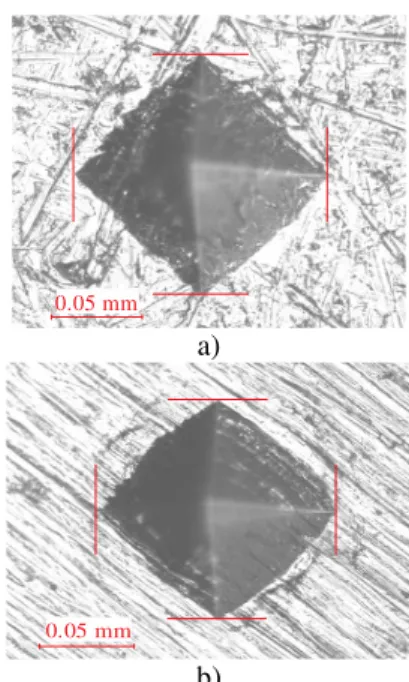
Thus, on polished surface of the aluminum sample were made 15 indentations with a maximum load of 9.81 N (1000 gf), in order to check the repeatability of the measurements. The dwell time of the applied load was automated set by software at 10 s. The same procedure of experimental micro-indentation test it was achieved for cooper sample as well. For example, one imprint is given in figure 1 for each sample.
a)
b)
Fig. 1. Imprint of Al 6060 T6 (a) and copper (b)
obtained by Vickers micro-indentation
0.05 mm
The average value of both Vickers micro-hardness (HVexp) and imprint diagonal (dexp) of
Al 6060 T6 and copper samples were obtained (table 1).
2.2 Tensile test
To perform the numerical simulations, the mechanical properties of aluminum Al 6060 T6 and copper 110 samples have been determined by tensile tests, according to ISO 6892-1 [41].
The mechanical properties and the stress-strain curve (σ–ε) of the materials were
determined using Instron 3366 Dual Column Universal Testing Machine. For measurements of elastic strains (ε) with high accuracy a
uniaxial extensometer was used.
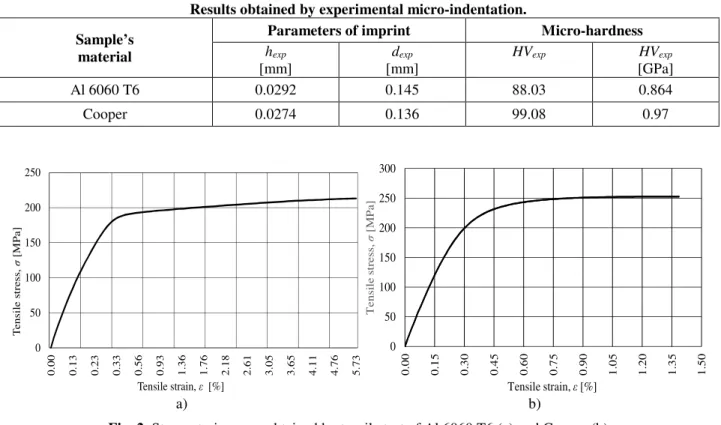
The experimental stress-strain curve for Al 6060 and copper 110 are represented in figure 2 and the obtained mechanical properties are given in table 2
Table 1
Results obtained by experimental micro-indentation.
Sample’s material
Parameters of imprint Micro-hardness
hexp
[mm]
dexp
[mm]
HVexp HVexp
[GPa]
Al 6060 T6 0.0292 0.145 88.03 0.864
Cooper 0.0274 0.136 99.08 0.97
a) b)
Fig. 2. Stress-strain curve obtained by tensile test of Al 6060 T6 (a) and Copper (b)
Table 2
Mechanical properties of Al 6060 T6 from tensile test. Sample’s material E modulus, Etensile [GPa] Sample’s thickness, t
[mm] Load at break [kN] Yield stress, Rp0.2 [MPa] Tensile strength, Rm
[MPa]
Al 6060 T6 64.010 1.25 3.328 191.78 213.01
Copper 110 84.907 0.32 0.451 252.74 252.68
4. NUMERICAL SIMULATION
A three-dimensional model and ANSYS Workbench software is adopted to simulate the Vickers micro-indentation process in order to determine the geometrical parameters of the imprint, respectively the micro-hardness of the samples. The boundary condition was modeled as a fixed support at the lower surface of the
samples to prevent movements in any directions of the lower nodes of the modeled sample and the indenter was defined as traction-free on vertical direction. The size of the indented sample was taken to be large enough compared with the maximum contact radius, thus the boundary conditions have no effect on the computational results. 0 50 100 150 200 250 0 .0 0 0 .1 3 0 .2 3 0 .3 3 0 .5 6 0 .9 3 1 .3 6 1 .7 6 2 .1 8 2 .6 1 3 .0 5 3 .6 5 4 .1 1 4 .7 6 5 .7 3 T en si le s tr es s, σ [M P a]
Tensile strain, ε[%]
0 50 100 150 200 250 300 0 .0 0 0 .1 5 0 .3 0 0 .4 5 0 .6 0 0 .7 5 0 .9 0 1 .0 5 1 .2 0 1 .3 5 1 .5 0 T en si le s tre ss , σ [M P a]
The contact conditions were imposed between inclined surfaces of the indenter and upper horizontal surface of the sample, without taking into account the friction between surfaces [25, 42]. The mesh of the numerical model were automatically generated with 3D tetrahedral finite elements (270.733 nodes and 191.644 finite elements) having a maximum element size of 0.11 mm. In order to improve the contact conditions a very fine mesh was defined in the contact area, mesh size increasing to larger elements as they get further away from indenter tip.
For this study, the material of the samples was considered isotropic and homogenous. The experimental tensile stress-strain curve has been employed to characterize the elasto-plastic behavior of the material and the large deformation formulation is included. The Poisson’s ratio value of ν = 0.33 for the
aluminum alloy and copper was taken from the literature [18, 43, 44].
It was demonstrated that the tip imperfection of the indenter does not have a major influence on hardness [45-47]. In this context, for numerical simulations the Vickers indenter was modeled in the hypothesis of an ideal indenter and no corrections were made at the tip. The Vickers indenter was modeled as a 3D rigid body with the angle between its opposite faces α
= 136°. The mechanical properties of the indenter were defined as the following: Ei =1140
GPa, νi = 0.07 [9].
The loading force was applied on the upper horizontal surface of the indenter, corresponding with the external applied force of the experimental Vickers micro-indentation.
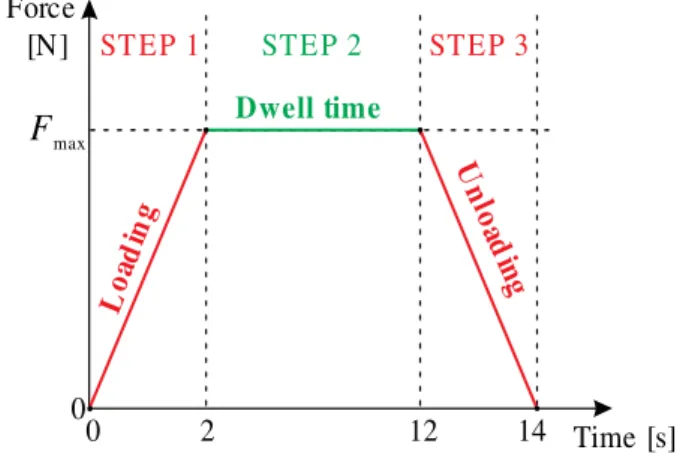
The three distinct phases in the micro-indentation process, loading – dwell time – unloading, realized by the movements in the vertical direction of the indenter, were numerically simulated through defining the force according to the load steps shown in figure 3.
Fig. 3. The force-time history used in numerical
simulations of indentation test
Thus, in the first step the force increases from 0 to Fmax (9.81 N), generating the sample
penetration (elastic-plastic deformations), the second step corresponds to the dwell time where the force is maintained constant resulting the maximum height of the imprint (hmax),
respectively the imprint mark, and in the last step the force decreases to zero, corresponding to upward movement of the indenter and the elastic recovery of the material, resulting the final height (hf) of imprint.
Also, it is specified that the computation time of the numerical micro-indentation, for each step described above, has been set as the experimental micro-indentation test: loading and unloading steps at 2 s and dwell time to 10 s.
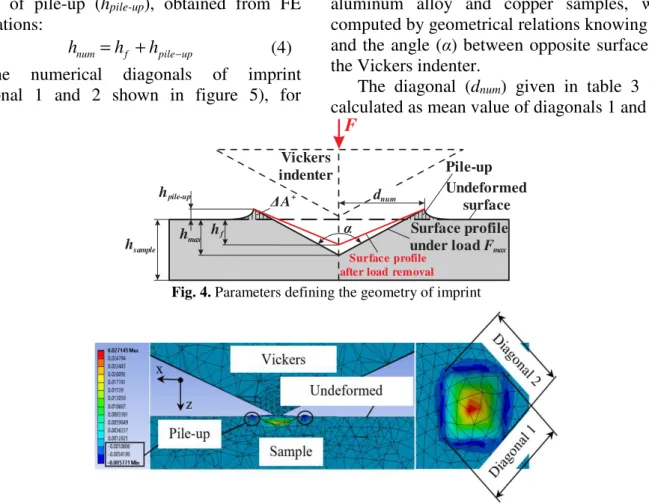
From numerical imprint, were taken into consideration the parameters that define the height of the imprints (figure 4), for both samples, as follows: the maximum height (hmax)
when is applied the maximum force and the imprint is generated, and final height (hf) after
unloading and the elastic recovery in loading direction of the residual imprint is produced.
Analyzing the simulation results shown in figure 5, it can be observed that the plastic deformations in loading direction are highlighted by the appearance of pile-up effect around the imprint by a residual area (∆A+),
which influence the shape and size of the imprint [48, 49]. The pile-up effect can be identified in the numerical diagram from figure 5 by negative values, calculated from the undeformed surface of the sample [50].
Thus, the height of the numerical imprint (hnum) was calculated taking into account the
final height (hf) of imprint (after loading) and the
Time [s] 2
0 12 14
Force [N]
Fmax
0
Lo ad
ing
U n
lo ad
in g Dwell time
height of pile-up (hpile-up), obtained from FE
simulations:
up pile f
num h h
h = + − (4)
The numerical diagonals of imprint (diagonal 1 and 2 shown in figure 5), for
aluminum alloy and copper samples, were computed by geometrical relations knowing (hf)
and the angle (α) between opposite surfaces of
the Vickers indenter.
The diagonal (dnum) given in table 3 was
calculated as mean value of diagonals 1 and 2.
Fig. 4. Parameters defining the geometry of imprint
Fig. 5. Imprint obtained from numerical 3D simulation of the micro-indentation
Table 3
Numerical values for geometrical parameters of imprint and micro-hardness calculated with equation (2)
Numerical results
Sample’s material
Parameters of imprint Micro-hardness
hmax
[mm]
hf
[mm]
hpile-up
[mm]
hnum
[mm]
dnum
[mm]
c
h [mm]
HVnum HVnum
[GPa]
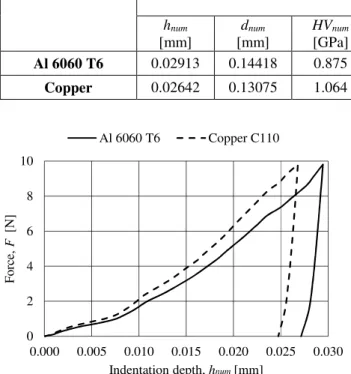
Al 6060 T6 0.0295 0.0271 0.00203 0.02913 0.14418 0.02059 89.2 0.875
Copper 0.0268 0.0247 0.00168 0.02642 0.13075 0.01876 108.48 1.064
The Vickers micro-hardness given in table 3 was computed with equation (2) where hc
(equation 3) was calculated according to the average value of the diagonal (dnum) determined
by numerical simulations. Also, the Vickers micro-hardness obtained for both specimens were checked with the equation (1) defined by the standard.
3. RESULTS AND DISCUSSION
Numerical simulation of indentations allows determination of geometrical parameters of imprints and calculation of sample’s Vickers
micro-hardness of 0.875 GPa (for aluminum) and, respectively 1.064 GPa (for copper).
It can be observed that the values of Vickers micro-hardness of the tested materials obtained by experimental micro-indentations of 0.864 GPa for aluminum and 0.97 for copper are in good agreement with the numerical micro-hardness, relative deviations being under 10% (see table 4).
Based on experimental Vickers micro-hardness measurements the average length of diagonals of imprint for both materials have also a closed values to those determined by Vickers micro-hardness (table 4).
F
hsample
hmax
hpile-up
Vickers indenter
Surface profile after load removal
Pile-up
hf α Surface profile
under load Fmax
dnum
∆A+ Undeformed
In this study the validation of inverse method for extracting Vickers micro-hardness from non-instrumented indentation tests has been proposed in terms of dimensional analysis and finite element simulations. Both the uniaxial
tensile test and the micro-indentation experiment were performed on the same materials in order to compare and validate the values of micro-hardness obtained from numerical simulations.
Table 4
Numerical and experimental values of impression parameters and micro-hardness Sample’s
material
Numerical micro-indentation
Experimental micro-indentation
Relative deviation
hnum
[mm]
dnum
[mm]
HVnum
[GPa]
hexp
[mm]
dexp
[mm]
HVexp
[GPa]
HV
[%]
Al 6060 T6 0.02913 0.14418 0.875 0.0292 0.145 0.864 1.27
Copper 0.02642 0.13075 1.064 0.0274 0.136 0.97 9.69
Fig. 6. Force vs. indentation depth curve obtained by
numerical simulation
Fig. 7. Time vs. indentation depth during
micro-indentation simulations
The experimental micro-indentation tests have been validated by 3D finite element simulation. The result was the geometry of the imprint (diagonals size, maximum height during loading, final height after unloading and the
pile-up effect around imprint) of the Al 6060 T6 and copper 110 samples and its Vickers micro-hardness, respectively.
Figure 6 gives the variation of indentation depth during load steps defined in the numerical simulations, for both studied materials, and represents a typical force–displacement curve for an instrumented indentation test. The plot corresponds to the test segments identified in figure 3, data in step 2 is plotted, but is not visible as a function of displacement.
The force versus indentation depth unloading curve helps to estimate the contact stiffness and the contact area, in order to be able to evaluate the elastic modulus and micro-hardness by applying the Oliver and Pharr approach.
Figure 7 represent an indentation depth – time history curve, obtained also by numerical simulations for aluminum alloy and copper samples.
From these figures it can be observed that, the material of the samples exhibits a nonlinear behavior during a loading-unloading micro-indentation cycle, as expected from theoretical curve presented in [6], and respectively highlights the elastic recovery in loading direction of the material after indentation is performed.
Good agreement was found between the values of Vickers micro-hardness obtained from the two methods (experimental and numerical simulations) and the results validation being achieved by good agreement between the geometric parameters of imprint obtained from
0 2 4 6 8 10
0.000 0.005 0.010 0.015 0.020 0.025 0.030
Fo
rc
e,
F
[N
]
Indentation depth, hnum[mm]
Al 6060 T6 Copper C110
0.000 0.005 0.010 0.015 0.020 0.025 0.030
0 2 4 6 8 10 12 14
In
de
nt
at
io
n
de
pt
h,
h
n
u
m
[m
m
]
Time, t[s]
the finite element simulation and those obtained from the micro-indentation experiment.
Moreover, the measured Vickers hardness, and respectively the numerical micro-hardness are close to those reported in literature [11, 13, 37, 39].
The finite elements technique is a useful tool to provide information that would have been difficult to obtain by experimental tests and also offer a better understanding of the mechanical behavior of the sample during micro-indentation measurements.
4. REFERENCES
[1] Adonias, R.F.J., Pintaude, G., Sinatora, A., Pinedo, C.E., Tschiptschin, A.P., The use of a Vickers indenter in depth sensing indentation for
measuring elastic modulus and Vickers hardness,
Journal of Material Research, Vol. 7, No. 3, pp. 483-491, 2004.
[2] Yan, W., Pun, C.L., Simon, G.P., Conditions of applying Oliver-Pharr method to the indentation of particles in composites, Composites Science and Technology, Vol. 72, pp. 1147-1152, 2012. [3] Nastic, A., Merati, A., Bielawski M., Bolduc,
M., Fakolujo, O., Nganbe, M., Instrumented and Vickers indentation for the characterization of stiffness, hardness and toughness of zirconia
toughened Al2O3 and SiC armor, Journal of
Material Sciente and Technology, Vol. 31, pp. 773-783, 2015.
[4] Bahri, A., Guermazi, N., Bargui, M., Elleuch, K., Estimation of elastic modulus of the alumina coated AA1050 aluminium: Modelinh and
experiments, Material Science and Engineering
A, Vol. 670, pp. 188-195, 2016.
[5] Gubicza, J., Juhasz, A., Tasnadi, P., Arato, P., Voros, G., Determination of hardness and elastic modulus from continuous Vickers indentation
testing, Journal of Material Science and
Technology, Vol. 28, No. 7, pp. 626-635, 2012. [6] Oliver, W.C., Pharr, G.M., An improved technique
for determining hardness and elastic modulus using load and displacement sensing indentation experiments, Journal of Material Research, Vol. 7, No. 6, 1992.
[7] Hay, J., Introduction to instrumented indentation
testing, Experimental Techniques, Vol. 33, No. 6,
pp. 66-72, 2009.
[8] Oliver, W.C., Pharr, G.M., Measurements of hardness and elastic modulus by instrumented
indentation: Advances in understanding and refinement to methodology, Journal of Material Science, Vol. 19, No. 1, 2004.
[9] Zorzi, J.E., Perottoni, C.A., Estimating Young’s modulus and Poisson’s ratio by instrumented indentation test, Materials Science & Engineering A, Vol. 574, pp. 25-30, 2013.
[10] Chen, X.-Q., Niu, Haiyang, Li, Dianzhong, Li, Yiyi, Modeling hardness of polycrystalline materials and bulk metallic glasses, Intermetallics, Vol. 19, No. 9, pp. 1275-1281, 2011.
[11] Kang, S.K., Kim, J.Y., Park, C.P., Conventional Vickers and true instrumented indentation hardness determined by instrumented indentation
tests, Journal of Material Science, Vol. 25, No.2,
pp. 337-343, 2010.
[12] Bueno, S., Baudin, C., Instrumented Vickers
microindentation of alumina-base materials,
Journal of Material Research, Vol. 21, No.1, pp. 161-173, 2006.
[13] Wagih, A., Experimental and Finite Element Simulation of Nano-indentation on Metal Matrix
Composites: Hardness Prediction, International
Journal of Engineering (IJE), TRANSACTIONS A: Basics, Vol. 29, No. 1, pp. 78-86, 2016. [14] Sun, Y., Bell, T., Zheng, S., Finite element analysis of
the critical ratio of coatings thickness to indentation depth for coating property measurements by nanoindentation, Thin solid films, Vol. 258, No. 1, pp. 198-204, 1995.
[15] Bolshakov, A., Oliver, W., Pharr, G., Influences of stress on the measurements of mechanical properties using nanoindentation: Part ii. Finite
element simulations, Journal of Material Research,
Vol. 11, No. 3, pp. 760-768, 1996.
[16] Moy, C., Bocciarelli, M., Ringer, S., Ranzi, G., Indentation and imprint mapping for the identification of material properties in
multi-layered systems, Computational Materials Science,
Vol. 50, No. 5, pp. 1681-1691, 2011.
[17] Zhao, M., Ogasawara, N., Chiba, N., Chen, X., A new approach to measure the elastic-plastic properties of bulk materials using spherical indentation, Acta Materialia, Vol. 54, pp. 23-32, 2006.
[18] Zhang, M., Ning, Z., Wang, Q., Contact elasto-plasticity of inhomogeneous materials and numerical method for estimating matrix yield strength of composites, Tribology International, Vol. 127, pp. 84-95, 2018.
[19] Laursen, T.A., Simo, J.C., A study of the mechanics
of microindentation using finite elements, Journal
of Material Research, Vol. 7, No. 3, 1992.
microindentation experiments: Uniqueness of the solution, 20th European Conference on Fracture (ECF20), Procedia Material Science, Vol. 3, pp. 215-220, 2014.
[21] Karimzadeh, A., Ayatollahi, M.R., Alizadeh, M., Finite element simulation of nano-indentation
experiment on aluminium 1100, Computation
Material Science, Vol. 81, pp. 595-600, 2014. [22] Liu, M., Lu, C., Tieu, K., Yu, H., Numerical
comparison between Berkovich and conical nano-indentations: Mechanical behaviour and
micro-texture evolution, Material Science and
Engineering A, Vol. 619, pp. 57-65, 2014.
[23] Wang, D., Zhao, J., Xue, C., Cao, Y., Finite element simulation of Vickers micro-indentation test of micro-nano-composite ceramic tool
materials based on microstructure model, Journal
of Refractory Metals and Hard Materials, Vol. 58, pp. 34-41, 2016.
[24] Guo, W.C., Rauchs, G., Zhang, W.H., Ponthot, J.P., Influence of friction in material
characterization in microindentation
measurement, Journal of Computational and
Applied Mathematics, Vol. 243, pp. 2183-2192, 2010.
[25] Lee, J.M., Lee, C.J., Lee, K.H., Kim, B.M., Effects of elastic-plastic properties of materials on residual indentation impressions in nano-indentation using sharp indenter, Transaction of Nonferrous Metals Society of China, Vol. 22, No. 3, pp. 585-595, 2012. [26] Stauss, S., Schwaller, P., Bucaille, J.L., Rabe, R., Rohr, L., el. al., Determining the stress-strain behaviuor of small devices by nanoindentation in
combination with invese methods, Microelectronic
Engineering, Vol. 67, pp. 818-825, 2003.
[27] Lichinchi, M., Lenardi, C., Haupt, J., Vitali,
R., Simulation of Berkovich nanoindentation
experiments on thin films using finite element
method, Thin Solid Films, Vol. 333, No. 1, pp.
278-286, 1999.
[28] Karimzadeh, A., Ayatollahi, M., Alizadeh, M., Finite element simulation of nano-indentation
experiment on aluminum 1100, Computational
Materials Science, Vol. 81, pp. 595-600, 2014. [29] Celentano, D.J., Guelorget, B., Francois, M.,
Cruchaga, M.A., Slimane, A., Numerical simulation and experimental validation of the
microindentation tets applied to bulk
elastoplastic materials, Modelling and
Simulation in Materials Science and Engineering, Vol. 20, No. 4, 2012.
[30] Tabor, D., The hardness of solids, Review of Physics in Technology, Vol. 1, No. 3, 1970. [31] Fischer-Cripps, A.C., Contact mechanics, in
Nanoindentation, Springer, 1-19, 2011.
[32] ASTM E 384-99, Standard Test Method for
Microindentation Hardness of Materials.
[33] ASM Handbook, Mechanical Testing and
Evaluation, Vol. 8, 2000.
[34] Pharr, G.M., Bolshakov, A., Understanding
nanoindentation unloading curves, Journal of
Material Research, Vol. 17, No. 10, pp. 2660-2671, 2002.
[35] Alcala, J., Barome, A.C., Anglada, M., The influence of plastic hardening on surface deformation modes around Vickers and
spherical indents, Acta Materialia, Vol. 48, pp.
3451-3464, 2000.
[36] BS EN 573-3:2003 Standard, Aluminium and aluminium alloys - Chemical composition and
form of wrought products, in Part 3: Chemical
composition, 2003.
[37] BS EN 755-2:2008 Standard, Alloy 6060 –
Generic physical properties, 2008.
[38] ASTM B152/B 152M – 06a, Standard specification for copper sheet, strip, plate and rolled bar.
[39] C110 (ETP) Data sheet: www.luvata.com. [40] ISO 6507-1, Metallic materials – Vickers
hardness test – Part1: Test method.
[41] International Standard ISO 6892-1, Metallic materials – Tensile testing –Part 1: Method of
test at room temperature, 2009.
[42] Minster, J., Micka, M., Numerical simulation of an indentation process for defining the viscoelastic characteristics of time-depedent
materials, Journal of Science and Engineering B,
Vol. 2, No. 1B, pp. 81-89, 2012.
[43] ThyssenKrupp, Aluminum alloy 6060, in Material Data Sheet, 2013.
[44] Li, Q., Lovell, M.R., The establishment of a failure criterion on cross wedge rolling, The International Journal of Advanced Manufacturing Technology, Vol. 24, pp. 180-189, 2004.
[45] da Silva Dias, A.M., Modenesi, P.J., de Godoy, G.C., Computer simulation of stress distribution during Vickers hardness testing of
WC-6Co, Material Research, Vol. 9, No. 1, pp.
73-76, 2006.
[46] Ma, Z.S., Zhou, Y.C., Long, S.G., Lu, C.S., An inverse approach for extracting elastic-plastic properties of thin films for small scale sharp
indentation, Journal of Material Science and
Technology, Vol. 28, No. 7, pp. 626-635, 2012. [47] Sakharova, N.A., Fernandes, J.V., Antunes,
J.M., Oliveira, M.C., Comparison between Berkovich, Vickers and conical indentation tests:
International Journal of Solids and Structures, Vol. 46, pp. 1095-1104, 2009.
[48] Ma, Z.S., Zhou, Y.C., Long, S.G., Lu, C.S., A new method to determine the elastoplastic properties of ductile materials by conical
indentation, Science China Physics, Mechanics
and Astronomy, Vol. 55, No. 6, pp. 1032-1036, 2012.
[49] Antunes, J.M., Menezes, L.F., Fernandes, J.V., Three-dimensional numerical simulation of
Vickers indentation tests, International Journal of Solids and Structures, Vol. 43, pp. 784-806, 2006.
[50] Tang, Z., Guo, Y., Jia, Z., Li, Y., Wei, Q., Examining the effect of pileup on the accuracy of
sharp indentation testing, Advanced in Material
Science and Engineering, 2015.
SIMULAREA NUMERICĂ A PROCESULUI DE MICROINDENTARE VICKERS
PENTRU ESTIMAREA MICRODURITĂŢII
Rezumat: Scopul lucrării este de a investiga procesul experimental de microduritate prin metoda elementelor finite
(MEF) și validarea simulării numerice prin evaluarea geometrică a parametrilor amprentei obținuți
numeric cu amprenta experimentală obținută prin microidentare. În prima etapă s-au efectuat măsurători
de microindentare cu indenter Vickers pe două materiale, aluminiu 6060 și cupru C110. S-au determinat
lungimea medie a diagonalelor amprentei și valoarea medie a microdurității Vickers a materialelor. În cea
de-a doua etapă, s-a efectuat simularea numerică a procesului de microindentare cu MEF utilizând un
indenter 3D Vickers pentru care sunt cunoscute caracteristicile geometrice și mecanice. Pentru simularea
fidelă a comportamentului mecanic al materialelor studiate cu MEF este necesar să se cunoască în prealabil
curba de tensiuni - deformații specifice (σ – ε). Astfel, s-a efectuat testul de tracțiune uniaxială pentru
determinarea curbei (σ – ε) și a proprietăților mecanice pentru cele două materiale. Valorile microdurității
Vickers și parametrii geometrici ai amprentelor obținute prin simularea cu MEF au fost în concordanță
foarte bună cu rezultatele obținute experimental, prin microindentare Vickers.
Mihaela SIMION, Ph.D, Eng, Lecturer, Technical University of Cluj-Napoca, Mechanical Engineering Department, E-mail: [email protected], No.103-105, Muncii Blvd., 400641, Cluj-Napoca
Mircea Cristian DUDESCU, Ph.D, Eng, Professor, Technical University of Cluj-Napoca, Mechanical Engineering Department, E-mail: [email protected], No.103-105, Muncii Blvd., 400641, Cluj-Napoca